Mesoscale Numerical Simulation Study of Warm Fog Dissipation by Salt Particles Seeding
2016-12-07HuiHEXueliangGUOXiangLIUQianGAOandXingcanJIA1BeijingWeatherModificationOfficeBeijing100089
Hui HE,Xueliang GUO,Xiang’e LIU,Qian GAO,and Xingcan JIA1Beijing Weather Modification Office,Beijing 100089
2Key Laboratory of Beijing for Cloud,Precipitation,and Atmospheric Water Resources,Beijing 1000893Chinese Academy of Meteorological Sciences,Beijing 100081
Mesoscale Numerical Simulation Study of Warm Fog Dissipation by Salt Particles Seeding
Hui HE∗1,2,Xueliang GUO3,Xiang’e LIU1,2,Qian GAO1,2,and Xingcan JIA1,2
1Beijing Weather Modification Office,Beijing 100089
2Key Laboratory of Beijing for Cloud,Precipitation,and Atmospheric Water Resources,Beijing 1000893Chinese Academy of Meteorological Sciences,Beijing 100081
Based on the dynamic framework of WRF and Morrison 2-moment explicit cloud scheme,a salt-seeding scheme was developed and used to simulate the dissipation of a warm fog event during 6–7 November 2009 in the Beijing and Tianjin area.The seeding effect and its physical mechanism were studied.The results indicate that when seeding fog with salt particles sized 80µm and at a quantity of 6 g m-2at the fog top,the seeding effect near the ground surface layer is negative in the beginning period,and then a positive seeding effect begins to appear at 18 min,with the best effect appearing at 21 min after seeding operation.The positive effect can last about 35 min.The microphysical mechanism of the warm fog dissipation is because of the evaporation due to the water vapor condensation on the salt particles and coalescence with salt particles. The process of fog water coalescence with salt particles contributed mostly to this warm fog dissipation.Furthermore,two series of sensitivity experiments were performed to study the seeding effect under different seeding amounts and salt particles sizes.The results show that seeding fog with salt particles sized of 80µm can have the best seeding effect,and the seeding effect is negative when the salt particle size is less than 10µm.For salt particles sized 80µm,the best seeding effect,with corresponding visibility of 380 m,can be achieved when the seeding amount is 30 g m-2.
warm fog,fog dissipation,salt-seeding scheme,physical mechanism,seeding effect
1.Introduction
Fog is a boundary layer weather phenomenon with abundant droplets and crystals that reduces visibility to less than 1 km(WMO,1992).Heavyfoghassignificantimpactsonaviation,trafficandotherhumanactivities,andsuchimpacts have become increasingly notable in recent years.Meanwhile,fog also intensifies atmospheric pollution and can harm human health.Reducing fog damage to improve air quality is a serious concern of governments and society.
Artificial fog dissipation refers to artificially dissipating some or all of the fog droplets in the local range,so as to improve visibility.It is an important part of weather modification.Artificial fog dissipation has been studied extensively from different points of view with various methods, such as using hygroscopic particle seeding to dissipate fog droplets,and helicopters to dissipate fog—based on the theory of the turbulent mixing of dry air into the fog layer by the helicopter’s downwash,and so on(Gultepe et al.,2007).
In terms of field experiments on fog dissipation,differenttechnologieshavebeenutilizedforthedissipationofcoldand warm fog worldwide.To date,artificial cold fog dissipation has achieved good effects in many countries.America,England,France,Russia andother countrieshavecarriedout cold fog dissipation experiments with many refrigerationcatalysts at many airports.The technique has been applied commercially for some airports and highways.Compared with cold fog dissipation,artificial warm fog dissipation is much more difficult.An important method of warm fog dissipation is to seed it with hygroscopic particles(e.g.,salt,urea).The feasibility of dissipating warm fog by seeding hygroscopic particles was firstly proposed by Houghton and Radford(1938). They carried out some experiments on dissipating warm fog by seeding hygroscopic particles using a theoretical calculation,and found that the visibility improved evidently.Since then,some scientists have studied warm fog seeding with hygroscopic particles from the perspectives of field experiments,laboratory experiments,and numerical simulations, and concluded that visibility in the fog could be obviously improved by seeding with a certain amount and certain sized hygroscopic particles;however,the amount and location of the seeding and the required size of the hygroscopicparticles are crucial factors that are difficult to determine.
©Institute of Atmospheric Physics/Chinese Academy of Sciences,and Science Press and Springer-Verlag Berlin Heidelberg 2016
For the simulation of seeding for fog dissipation,Kornfeld(1970)designed the growth process of hygroscopic particles in a one-dimensional air mass model.He carried out a fog dissipation experiment by seeding hygroscopic particles on account of fog conditions,and concluded that the hygroscopic particle size must be selected according to the correspondingfog dropletspectrum distributionfor the warm fog dissipation.Silverman and Kunkel(1970)studied the effect of hygroscopic particles on fog dissipation with a onedimensional fog model and concluded that the particle size of the hygroscopic particles for efficient dissipation of fog was about 10µm,and the seeding amount was proportional to the fog water content(FWC)and inversely proportional to the size of fog droplets.Zhao(1989)conducted a numerical simulation of warm fog dissipation with a two-dimensional fog model by coupling the growth equation of hygroscopic particles developed by Hu et al.(1983).The result showed that it was entirely possible to dissipate the warm fog locally with salt particles,and that larger salt particles and seeding amounts can improve the seeding effect.Huang(1988) studied warm fog dissipation by salt particle seeding in a one-dimensional fog model,and concluded that the effect of fog dissipation by salt particles sized 20–30µm with a seeding rate of 0.54–0.91 g m-3was more notable.Guo and Zhang(1991)simulated the effect of heating on fog via the changing of air temperature in a one-dimensional fog model, and showed that with an increase in temperature the number concentration of fog droplets decreased,while the size of fog droplets firstly increased and then decreased.He et al. (2011)introduced the interacting process of liquid nitrogen and cloud in the Reisner2 scheme(Reisner et al.,1998)of the mesoscale numerical model MM5,and carried out a numerical simulation of cold fog dissipation in the Beijing area on 26 December 2007 with the seeding scheme.The results showed that by seeding for 10 minutes at 1–2 km on the upwind side of the target area at a seeding rate of 5 g s-1,the target area started to show the seeding effect at 9 minutes and thebest effectappearedat24minutesaftertheoperation.The seeding effect can last about 20 min,and the most significant seeding effect is achieved by seeding at the rate of 15 g s-1and at 5–6 km on the upwind side of the target area.
At present,simulationstudies of warm fogdissipationare mainlyconductedinfogmodels,andfogmodelsaredesigned mainly for local fog without consideration of the influences of the orographic and environment fields on fog evolution, which may significantly differ from natural fogs.Fog dissipation simulation with a fog model has a certain limitation for analyzing and studying fog dissipation and understanding the underlying microphysical mechanisms.Mesoscale models can fully make use of actual atmospheric data and simulate the weather process closer to reality by considering the orographic and environment fields and their effect.
In this work,a salt-seeding scheme was developed based on the dynamic framework of WRF and Morrison 2-moment explicit cloud scheme(Morrison et al.,2005).The WRF model,coupled with the new salt-seeding scheme,was used to simulate warm fog dissipation for a warm fog event during 6–7 November 2009 in the Beijing and Tianjin area. The seeding effect and its physical mechanism were studied.Furthermore,two series of sensitivity experiments were performed to study the seeding effect under different seeding amounts and salt particle sizes.The weather patterns are described in section 2,and then the model configurations and the new seeding scheme are described in section 3.Model validation is given in section 4.Fog dissipation seeding simulation and its physical mechanism are discussed in sections 5 and 6.Results from the sensitivity experiments using different salt particles sizes and seeding amounts are discussed in section 7.And,finally,section 8 summarizes the study’s key findings.
2.Weather patterns
Before the fog formed,the Beijing–Tianjin region was in a uniformpressurefieldduetoaweakcoldhigh-pressuresystem,so the wind near the ground surface layer was relatively weak.At 850 hPa,a small trough was located in the west of the Hetao Plateau,transporting humid and warm air to North China.At 500 hPa,the air current was relatively longitudinal,and the latitudinal dimensionof the trough and ridge was not big.In general,the latitudinal direction of the high-level layer was small,and the low-level layer was relatively stable, located in the weak uniform pressure system with sufficient supply of water vapor.This synoptic pattern has been shown to be conducive to fog formation(Ge et al.,1998).These conditions caused the heavy fog in North China during 6–7 November.On 8 November,the fog in the Beijing–Tianjin region gradually dissipated due to the invasion of severely cold air.
The blue line in Fig.1a is the temporal variation of the visibility observed at Wuqing Station,Tianjin,from 0000 LST 6 November to 0600 LST 8 November.It can be seen that the fog mainly appeared in two periods,0300–1100LST 6 November and 2000 LST 6 November to 0500 LST 8 November,and the visibility in these two periods was below 100 m.The visibility after 0600 LST 8 November became gradually better.
3.Salt-seeding scheme and model configuration
3.1.Salt-seeding scheme
The WRF mesoscale modeling system and the Morrison 2-momentexplicit cloud scheme were chosen as the dynamic and microphysical platform for the salt seeding scheme.The WRF model is a next-generation mesoscale forecast and assimilationsystemdesignedtoservebothoperationalforecastingandatmosphericresearchneeds;itisafullycompressible, nonhydrostatic model(Skamarock et al.,2008).The Morrison 2-momentum microphysical scheme predicts the number concentration and mass mixing ratios of cloud water,cloud ice,snow,rain,andgraupel/hail.Thesalt-seedingschemehas been introduced into the Morrison 2-moment explicit cloudscheme.In the salt-seeding scheme,the mass concentration Qnand number concentration Nnof salt particles are predicted,where n represents salt particles.The conservation equation of Qnand Nnis considered as also includes the evaporation/condensation process of cloud droplets due to the condensation/evaporation process of salt particles.

Fig.1.Temporal variation of observed and simulated(a)visibility,(b)FWC,and(c)wind speed,near the ground surface layer.

The sedimentation process equation of salt particles is as follows:


where VVV (Vx,Vy,Vz)is the 3D wind vector,D is the turbulent diffusion.The thirdterm on the right-handside of Eq.(1)and Eq.(2)represent the effects of the sedimentation.
The remaining terms on the right-hand side of Eq.(1)denote the microphysical processes of condensation/evaporation growth and coalescence growth of salt particles with fog droplets,respectively.In addition,the salt-seeding scheme
where usis the salt particles’terminal velocity andρis the air density.Accordingto the salt particles’radii(rs),their fall velocity is set as follows(Hu et al.,1983):

The reaction of salt particles and fog droplets mainly in-cludes the following processes:calculating the condensation growth of salt particles;adjusting the vapor pressure of ambient air;calculating the evaporation process of fog droplets; calculating the coalescence growth of salt particles with fog droplets;andadjustingthe mass concentrationoffogdroplets and the mass concentration and number concentration of salt particles(Silverman and Kunkel,1970).
3.1.1.Condensation/evaporationprocess of salt particles
Referring to the condensation/evaporation process equation of a single cloud droplet(Mason,1971),the condensation/evaporation process equation of salt particles is as follows:
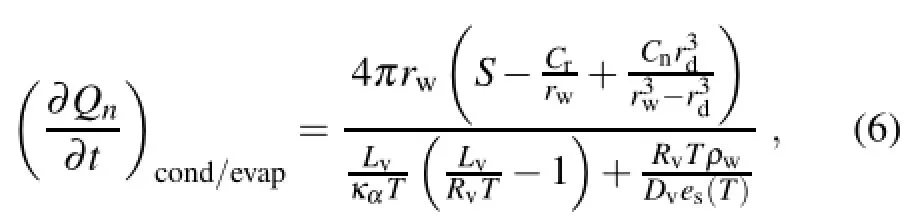
whereκαis the thermal conductivity of air;es(T)is the saturation vapor pressure at temperature T;S is the value of the supersaturation with respect to water;Lvis the latent heat of condensation,rwis the wet particle radius;rdis the dry salt particle radius;the curvature term is Cr=2σ/ρwRvT,where σ(=75.6×10⁻³N m-1)represents the free energy of the water unit surface area(namely,the surface tension coefficient),Rv(=461.5 J kg-1k-1)is the specific gas constant of water vapor;and the solution term is Cn=iρnMw/Ms, where i(=2)is the number of ions for each salt molecule, ρn(=2165 kg m-3)is the density of the salt particles,and Msand Mware the molecular masses of the salt particles and water,respectively;ρw(=1000 kg m-3)is the mass density of water;and Dvrepresents the diffusivity of water vapor molecules in the atmosphere.The latter is a function of temperature and pressure,with the expression of

whereT0=273.15K,P0=1013.25hPa,Pis the air pressure, and this equation is valid when-40◦C<T<40◦C.
3.1.2.Evaporation/condensation of fog droplets due to the condensation/evaporationprocess of salt particles
Referring to the conversion equation from vapor into cloud water(Reisner et al.,1998),the evaporation(condensation)process of fog droplets equation due to the condensation(evaporation)of salt particles seeded in the fog is as follows:
When(∂Qn/∂t)cond/evapNn>0,it would cause the evaporation of fog droplets:

WhereFWC is thefogwater contentinunitsofgkg-1,When (∂Qn/∂t)cond/evapNn<0,it would cause the condensation of fog droplets:

where Sf,evap/condis the evaporation/condensation process of fog droplets,

qvswis the saturated mixing ratio at temperatureT(units:K), cpis the specific heat of air at constant pressure and Dtis the time step used in the simulation.
3.1.3.Coalescencegrowthofsaltparticleswithfogdroplets
The coalescence growth equation of a single salt particle with a fog dropletCscis as follows:

where Qfis the water content of the fog droplet,ufis the fall velocity of the fog droplet,rsis the salt particle radius,and E is the coalescence coefficient of the salt particle and fog droplet,which is according to the different salt particle sizes developed by Mason(1971).
Therefore,the total mass content of fog droplets coalesced with salt particles is:

where Nnis the number concentration of salt particles.Finally,the water content of the fog droplet(Qf)reduces due to the condensation and coalescence growth of salt particles:

3.2.Model configuration
The WRF model,developedjointly by NCAR/NCEP and the Forecast Systems Laboratory/NOAA(Grell et al.,2005), was employed for simulation of this fog event.Two-way nesting with four domains having horizontal resolutions of 27,9,3 and 1 km,respectively,was selected.The domains were centered at(40◦N,115◦E)and consisted of 51×151, 184×142,202×175and100×103grids,respectively.Since model performance in fog simulation is highly sensitive to its vertical resolution(Kong,2002;Tardif,2007),the troposphere from the ground to 50 hPa was divided into 33 sigma layers in the vertical direction,with 14 layers within the lowest 1000 m to capture the turbulent processes in the boundary layer.Since fog is closely related to land use,terrain height,and other static terrain data,the experiment adopted the terrain data of the WRF’s highest resolution(~0.9 km). The main physical options used for this simulation was the Kain cumulus convection parameterization scheme,the Morrison 2-moment microphysics explicit cloud scheme,the RRTM longwave radiation calculation scheme,the Dudhia shortwave radiation calculation scheme,and Quasi-Normal Scale Elimination(QNSE)boundarylayer scheme.The Kaincumulus convection parameterization scheme and Morrison 2-moment microphysics explicit cloud scheme were both adopted in the domains with horizontal resolutions of 27 and 9 km,while the Morrison 2-moment microphysics explicit cloud scheme only was adopted in the domains with horizontal resolutions of 3 and 1 km.The initial and boundary conditions were derived from the NCEP FNL(final operational global analysis)data,with a 1◦×1◦spatial resolution andsix-hourtemporalresolution.Meanwhile,FNLdatawere applied to the Newton grid point nudging four-dimensional assimilation process of WRF,so that the meteorological field was updated continuously and the system deviation caused by the long time integral was reduced.The simulation period was set from 0800 LST 5 November to 0800 LST 7 November 2009.
4.Model evaluation
Figure 1a shows the temporal variation of observed and simulatedvisibility from0000LST 6 Novemberto 0600LST 8 November at Wuqing Station,Tianjin.The simulated visibility was calculated according to the equation developed by Kunkel(1984):

Where Vis is the visibility in units of m.As seen in Fig.1a, thetwo visibilities are quiteclose intheir magnitudeandtemporaltrends:thevisibilityrapidlyreducedfromabout1000m at 0000 LST to below 100 m at 0300–0400LST 6 November. The visibility rose above900 m at about1100 LST 6 November,but rapidly reduced to below 100 m again at about 1800 LST 6 November;and this low visibility did not improve until about 0600 LST 8 November.
Figure 1b shows the temporal variation of FWC near the ground surface layer observed with an FM-100 fog monitor and simulated from 2300 LST 6 November to 0700 LST 8 November at Wuqing Station,Tianjin.The observation and simulation both show that the FWC began to rise after 2300 LST 6 November and reached a large value at 0300–0800 LST 7 November,with a maximum of about 0.8 g kg-1.After that,the FWC near the groundsurface layer,observedand simulated,began to reduce,to a minimumat 1200–1600LST 7 November,while the simulated FWC was obviously larger than observed.The observed FWC began to rise after 1600 LST and reached a secondary peak with a value of about 0.7 g kg-1at about 2300 LST 7 November.Meanwhile,the simulated FWC did not rise after 1600 LST 7 November,and only fluctuated around the value of 0.4 g kg-1.The simulated and observedfog water both dissipated thoroughlyafter 0700 LST 8 November.
Figure 1c is the temporal variation of observed and simulated wind speed near the ground surface layer from 0000 LST 6 November to 0600 LST 8 November at Wuqing Station,Tianjin.It can be seen that the temporal evolution trend ofobservedandsimulatedwindspeedis relativelyconsistent, both of them with low values from 0600 LST 6 November to 0600 LST 7 November,increasing after 0600 LST 7 November with values exceeding 2 m s-1,and reducing after 1500 LST.Meanwhile,at this time,the simulated wind speed was obviously larger than observed.The observed and simulated wind speed both increased rapidly as the cold air invaded at 0000 LST 8 November;the corresponding visibility also increased and the fog dissipated.
According to Cotton and Anthes(1993),the range of the FWC should be 0.05–0.2g kg-1,but varies with differentgeographical features and fog formation conditions.This work takes the FWC of 0.05 g kg-1as the lower critical value of the fog region,with no limit to the upper critical value.
The simulated spatial distribution of the FWC was compared using the satellite-derived fog areas at 1012 LST 6 November and 0946 LST 7 November 2009.The results,presented in Fig.2,show that the simulated fog areas were consistent with observations in the Beijing–Tianjin region.
Figure 3 presents the time–height cross section of observedand simulatedtemperatureat the observationsite from 1730 LST 6 November to 1300 LST 8 November at Wuqing Station,Tianjin,with the blue line in Fig.3 representing the inversion height.As can be seen from Fig.3a,from 1730 LST 6 November to 0230 LST 8 November,the observed temperature inversionappeared at about 800 m and increased to 1400 m between 0230 LST and 1430 LST 7 November. After then,the inversion height gradually reduced to 800 m at 1430 LST 7 November,400 m at 0000 LST,and 200 m at 0230 LST 8 November.Compared with the observation, the simulated temperature showed similar features:At first, the temperature inversion appeared at 800–1000 m above the ground,and then increased to 1200 m at 0700LST 7 November.After then,the inversionlayer showed a graduallyreducing trend.However,the simulated inversion height was not consistent with the observed.
Through the above comparisons and analyses,we conclude that,despite some small differences,WRF can adequately reproduce this dense fog event.
5.Setup of the seeding experiments
The salt particle seeding was carried out at 0331 LST 7 November.Figure 4 shows the simulated FWC distribution near the ground surface layer at this moment.Nine grid points shown in Fig.4 representseeding points,with the center of the nine gird points being Wuqing Station,Tianjin,and the initial height of seeding near the fog top.In the control seeding experiment,the salt particle size was 80µm and the seeding rate 0.020 g m-2s-1.The seeding operation lasted for 5 min,so the total seeding amount was 6 g m-2.The salt particles’size and seeding amount in the control experiment were similar to previous studies,such as Zhao(1989) and Huang(1988).To study the effect of different sized salt particles and different seeding amounts on the fog dissipation,two series of sensitivity seeding experiments were alsoconducted.Theseedinglocationsandtimes wereall thesame as in the control experiment.Detailed information regarding the seeding experiments is provided in Table 1.

Fig.2.Polar orbit meteorological satellite fog image(a,c)and the simulated FWC image(b,d)at ground level at 1012 LST 6(a,b)and 0944 LST 7(c,d)November 2009.units:g kg-1.

Fig.3.Time–height cross section of(a)observed and(b)simulated temperature at the observation site from 1730 LST 6 November to 1300 LST 8 November(units:K;blue line represents inversion height).

Fig.4.Fog water distribution near the ground surface layer at 0331 LST7November(thenineblack pointsrepresent theseeding points,and their center is Wuqing Station,Tianjin;units: g kg-1).

Table 1.Details of the seeding experiments.
6.Results
Figure 5 shows the time–height cross section of the mass content,number concentration and salt particles’size at the center of the seeding area in the control seeding experiment. As can be seen,with time,the salt particles gradually fall from the fog top to bottom after being seeded at the fog top,and the salt particles can fall to the ground completely in about 20 min.Since salt particles experience condensation and coalescence growth during their descent,their particle size will gradually increase.When falling to the ground, the particle size increased from the initial 80µm to a final size of about 300µm.Since salt particles diffuse during the falling process,and the condensationandcoalescence growth of salt particles has no impact on the number concentration, the number concentration of salt particles was at a maximum at the end of the seeding operation(5 min),and then gradually reduced because of their diffusion process.As for the mass content of salt particles,they graduallyincreased due to experiencing the condensation and coalescence growth process.
Figure 6 shows the longitude–height cross section of unseeded and seeded FWC,salt particle mass content,and wind field(Vx,100Vz)at the center of the seeding area at 1 min, 6 min,9 min and 15 min after the seeding operation,separately.It can be seen that,compared to the unseeded result, the seeded FWC corresponding to the position of salt particles obviously reduced.Meanwhile,for the salt particles seeded at the fog top,the seeded FWC also graduallyreduced from the fog top to bottom as the salt particles fell.In addition,because of a weak updraft air current near 116.96◦E,a plume above the fog top was formed there.

Fig.5.Time–height cross section of(a)salt mass content(units:g kg-1),(b)salt number concentration(units:L-1)and(c)its diameter(units:µm)at the center of the seeding area.

Fig.6.Longitude–height cross section of the unseeded FWC(a,d,g,j),seeded FWC(b,e,h,k),salt mass content(c,f,i,l), and wind field(U,100 W)at 1 min(a–c),6 min(d–f),9 min(g–i)and 15 min(j–l)after the seeding operation at the center of the seeding area(units:g kg-1).

Fig.7.Temporal variation of unseeded and seeded visibility near the ground surface layer at the center of the seeding area.
Figure 7 shows the temporal variation of unseeded and seeded visibility near the ground surface layer at the center of the seeding area;the visibility was calculated according to Eq.(12).In this study,the influence of seeded salt particles on visibility was also considered and their extinction coefficient was assumed to be equal to that of fog water in the same mass content.It can be seen that it took a certain time for the salt particlesto fall fromthe fogtop to bottom.Therefore,the seeded visibility near the ground surface layer at the initial stage showed no differenceto that without seeding operation. Six minutes after the seeding operation,the seeded visibility near the ground surface layer was worse than that without seedingoperationas thesalt particlesfelltothelowlayer,and the visibility was the worst at 15 minutes after the seeding operation.At about 18 minutes after the seeding operation, the seeding operation beganto induce positive effects and the seededvisibility improvedcomparedwith the unseededoperation.The best effect appeared at about 21 minutes after the seeding operation,and the positive seeding effect was able to last for about 35 minutes.
7.Fog dissipation mechanism via seeding salt particles
Figure 8 shows the time–height cross section of the unseededandseededsupersaturation,the microphysicalconversion rate of water vapor condensed on the salt particles,fog droplet evaporation,fog water coalesced with the salt particles,and the difference of the fall velocity between the salt particles and fog droplets at the center of the seeding area.
It can be seen that,because of the supersaturation in the fog area,the salt particles consumed a lot of water vapor through condensation growth.This process will cause the supersaturation to reduce to subsaturation,and thus lead to the evaporation of the fog droplets.As for the salt particles, the dry salt particle radius was 40µm,the mean radius of wet salt particles was about 70µm,and the temperature was about 288K.Accordingto Eq.(6),it can be calculated that to ensure the condensation growth of the wet salt particles,the value of supersaturation with respect to water only needed to be greater than-0.3.As can be seen from Fig.8b,the subsaturation caused by the salt particle seeding was larger than -0.3,so it would have caused fog droplet evaporation and salt particle condensation.It can be seen from Eq.(9)that the mass content of fog droplets coalesced with salt particles is proportionalto the size of the salt particles;duringthe falling process of a salt particle,the process of salt particles coalescing with fog droplets gradually strengthened as the size of salt particles gradually increased.Therefore,it mainly occurs in the lower part of the fog region.As seen from Eq.(6), the condensation growth of salt particles is mainly proportional to the supersaturation in the fog.The supersaturation in the fog will reduce somewhat with the condensation and coalescence growth during the falling process of salt particles.Therefore,the evaporation of fog droplets due to the condensation of salt particles mainly occurs in the upper part of the fog region.It can be seen from Fig.8d that the fall velocity of salt particles seeded in the fog was obviously larger than that of fog droplets.The salt particles consumed a lot of fog water through condensation and coalescence growth, and then fell to the ground rapidly,causing the visibility in the fog to improve.
Additionally,as can be seen in the seeding simulation of this case,compared to the evaporation of fog droplets caused by salt condensation,the process of fog droplets coalescing with salt particles mainly contributed to the fog dissipation; in particular,the fog dissipation near the groundsurface layer was basically caused by the process of salt particles coalescing with fog droplets.
Figure 9a is the time–height cross section of the salt mass content affected by its sedimentation process.It can be seen that the salt particles fell from the high layer to low layer due to gravity,thus causing the mass content of salt particles in the upper layer to reduce and the mass content of salt particles in the low layer to increase.Most of the salt particles werealreadyinthelowlayeratabout15minaftertheseeding operation,so the particles that fell to the ground were greater in number than those that fell to this layer from the upper layer,which caused the mass content of the salt particles in the whole fog region to reduce.
Figure 9b is the time–height cross section of the differencein the fogwater mass contentaddedon thesalt particles’mass content and the unseeded fog water mass content at the center of the seeding area.It is known from Eq.(12)that this quantity decides the variation in visibility.When its value is above 0,the visibility will worsen,and when its value is below 0,the visibility will improve.It can be seen from Fig.9b that,at the initial stage ofthe seedingoperation,the reduction in fogwater mass contentcausedby thesalt particles was less than the mass content of the seeded salt particles themselves. So,the seeding operation caused the visibility to worsen at this stage.With the sedimentation process of salt particles from the upper layer to the lower layer,the visibility in the upper layer started to improve and the visibility in the lower part continued to worsen.At about 20 minutes after the seeding operation,the visibility in the whole fog region could be improved,as the salt particles have fallen to the ground due to the effect of gravity.

Fig.8.Time–height cross section of the(a)unseeded and(b)seeded supersaturation,the microphysical conversion rate of water vapor condensed on the salt particle(c)(units:g kg-1s-1),the fog droplet evaporation(d)(units:g kg-1s-1), the fog water coalesced with the salt particle(e)(units:g kg-1s-1),and the difference in the fall velocity between the salt particle and fog droplet(f)(units:cm s-1)at the center of seeding area.

Fig.9.Time–height cross section of the salt mass content affected by sedimentation(a)(units:g kg-1s-1)and the difference between the seeded FWC added on the salt mass content and the unseeded FWC(b)(units:g kg-1)at the center of the seeding area.
8.Sensitivity experiment
8.1.Salt particles of different sizes
In order to study the effect of salt particles of different sizes on the fog dissipation,S1 group sensitivity experiments wereconductedwheretheinitialsizeofthesalt particleswere 2,5,10,20,40,60,100,150 and 200µm,separately.The seeding locations and times were the same as in the control experiment.
Figure 10a shows the temporal variation in visibility near the groundsurface layer after seeding with differentsalt sizes at the center of the seeding area.It can be seen that,for the salt sizes larger than 10µm,the visibility near the ground surface layer worsens in the initial stage of the operation as the salt particles fall to the low layer;therefore,in this period, the operation shows a negative effect.With time,the visibility will gradually improve.Since salt particles of larger size fall faster,their effect on horizontal visibility in the low layer is also faster,i.e.,the visibility near the groundlayer worsens earlier and also improves faster.
When the seeding amount is 6 g m-2,the seeding effect of salt particles sized 80µm is the best.However,for salt particles sized less than 10µm,the seeding effect is mainly negative;and the smaller the particle size,the worse the seeding effect.
First,we discuss why the seeding effect of salt particles sized 80µm is the best at the seeding amount of 6 g m-2. According to section 6,the fog dissipation process near the groundsurfacelayeris mainlycausedbythecoalescenceprocess with salt particles.Therefore,we compared the mass content of fog droplets coalesced with salt particles sized 80 µm with those sized 40µm and 150µm,separately.It can be seen from Eq.(10)that the total mass content(∂Qn/∂t)coalof salt particles coalescing with fog droplets depends on the number concentration N of salt particles and the fog droplet mass contentCscthat a single salt particle can coalesce.Figure 11 shows the ratios of particles sized 80µm to particles sized 40 and 150µm,separately,for the number concentration of salt particles,the fog droplet mass content that a single salt particle can coalesce near the ground surface,and the fog droplet mass content that total salt particles can coalesce near the ground surface layer.That is:N80/N40,N80/N40, Csc,80/Csc,40,Csc,80/Csc,150,(∂Qn/∂t)coal,80/(∂Qn/∂t)coal,40 and(∂Qn/∂t)coal,80/(∂Qn/∂t)coal,150.Three moments for different salt particle sizes when maximum salt particle coalescence with fog droplets occurred were selected for comparison.That is:15,18 and 21 min for 80µm;24,27 and 30 min for 40µm;and 9,12 and 15 min for 150µm.As seen from Fig.11,compared with salt particles of size 40 µm,the number concentration of salt particles of size 80µm is decreased.However,each 80µm salt particle can coalesce more fog water mass content.The increment due to coalescence with fog water is higher than that of the decrement due to the number concentration.Thus,the total FWC coalesced with salt particles of 80µm is increased.
As for 150-µmsalt particles,the numberconcentrationof salt particles of size 80µm is increased.However,each 80 µm salt particle coalesces less FWC.The decrement due to coalescencewith fogwater is lowerthanthatofthe increment due to the number concentration.Thus,the FWC coalesced is increased compared with the salt particles of size 150µm. It can be seen from the analysis above that the size of salt particles is inversely proportional to the number concentration and proportional to the FWC that a single salt particle can coalesce when the total seeding quantity is fixed.There is a threshold value of particle size at which the total value of salt coalescing with FWC reaches a maximum.

Fig.10.Temporal variation of the visibility near the ground surface layer at the center of the seeding area seeded with (a)different salt particle sizes and(b)different seeding amounts.

Fig.11.Ratios of particles sized 80µm to(a)40µm and(b)150µm for the number concentration of salt particles,the fog droplet mass content that a single salt particle can coalesce,and the fog droplet mass content that total salt particles can coalesce,near the ground surface layer at the center of seeding area.
Next,we analyze why the seeding effect of salt with particles sized less than 10µm is negative;and the smaller the particle size,the worse the seeding effect.Figure 12 shows the time–height cross section of salt particle size and the difference between the fall velocities of salt particles and fog droplets,separately,at the center of the seeding area after seeding the salt particles with a size of 2µm.It can be seen that,comparedtothesaltparticleswithasizeof80µm,2-µm salt particles float longer in the air,their growth is relatively slow,and their final size is only about 8µm as they fall to the low layer.And,in the overall process of salt particles falling from the fog top to bottom,the fall velocity is smaller than that of fog droplets in the correspondingregion.It is because the particle sizes are so small that they cannot coalesce with fog droplets.The growth of salt particle size is slow,and the fall velocity of salt particles is smaller than that of fog droplets,thus causing the visibility to worsen.
8.2.Salt particles at different seeding amounts
In order to study the effect of salt particles at different seeding amounts on fog dissipation,S2 sensitivity experiments with seeding amounts of 12,24,30 and 36 g m-2were also conducted,on the basis of the control experiment’s seeding amount of 6 g m-2for particles sized 80µm.The seeding locations and times were the same as in the control experiment.
Figure 10b shows the temporal variation in visibility after the seeding operation with different seeding amounts at the center of the seeding area.It can be seen that,the larger the seeding amount,the worse the seeding effect in the initial stage,and the later the seeding effect begins to improve, while the better the seeding effect in the later stage.There is an optimal value of seeding amount at which the maximum enhancement of visibility will be achieved.For salt particles sized 80µm,the corresponding best visibility is 380 m and the optimal seeding amount value is 30 g m-2.

Fig.12.Time–height cross section of salt particle size(a)(units:µm)and the difference between the fall velocity of salt particles and fog droplets(b)(units:cm s-1)at the center of the seeding area after seeding with salt particles sized 2µm.
In the initial stage,since the mass content of seeded salt itself is more than that of the reduced fog water caused by salt seeding,the visibility in the fog can only be improved as the salt particles fall to the ground continuouslythrough condensation and coalescence growth.So,the larger the seeding amount,the worse the seeding effect in the initial stage. Meanwhile,the FWC is definite;as the numberconcentration of salt particles increases,the FWC coalesced by a single salt particle will reduce,which causes the final size that salt particles can grow to reduce,meaning the settling velocity will also be reduced.Therefore,the larger the seeding amount, the later the seeding effect begins to improve.Meanwhile,in the later stage,with the same particle size,the larger seeding amount means a larger number concentration of salt particles,and the condensation and coalescence growth of salt particles will be greater.Therefore,more fog water will be consumed as the salt particles fall to the ground gradually through the sufficient condensation and coalescence growth. Hence,the larger seeding amount,the better the seeding effect in the later stage.
Meanwhile,since the FWC is certain,salt particles with optimal number concentration for a certain particle size can fully reduce FWC through condensation and coalescence growth processes.And,when the number concentration of salt particlesexceedstheoptimalvalue,theamountthat FWC can further reduce is less than the salt particles’own increment,thus causing the best visibility seeded to reduce somewhat.Therefore,for salt particles with a certain size,there is an optimal value of seeding amount in cases of certain FWC.
9.Conclusion
A salt-seeding scheme was developed based on the dynamicframeworkofthemesoscaleWRF modelandMorrison 2-moment explicit cloud scheme.The salt-seeding scheme was used to simulate warm fog dissipation by seeding salt particlesinawarmfogeventthatoccurredon6and7November 2009.The fog evolution characteristics and its dissipation mechanism were studied.Furthermore,sensitivity experiments were performed to study the seeding effect under different seeding amounts and salt particles sizes.The main conclusions can be summarized as follows:
(1)After seeding the salt particles from the fog top,the FWC will also gradually weaken from the fog top to bottom with the settling of salt particles.
(2)After seeding the salt particles sized 80µm for 5 min at a seeding rate of 0.020 g m-2s-1(total seeding amount of 6 g m-2),near the ground surface layer,a negative effect appears in the initial stage of operation,and the ground visibility worsens.At 18 min after the seeding operation,a positive seeding effect begins to appear,the visibility will be improved,and the best effect appears at about 21 min after the operation.The positive seeding effect can last for about 35 min.
(3)The mechanism of fog dissipation by salt seeding is that the FWC is reduced due to the coalescence process by salt particles and evaporationcaused by condensation growth of salt particles.As the salt particles fall to the ground,the visibility will be improved.The evaporation of fog droplets due to the condensation growth of salt particles mainly occurs in the upper part of the fog area,and the process of fog dropletscoalescedbysalt particlesmainlyoccursinthelower part of the fog area.In this case,the fog droplets consumed by the salt particle coalescence process is the main process of fog dissipation.
(4)When the seeding amount is 6 g m-2,sensitivity experiments with different salt particles sizes showed that the seeding effect of salt with particles sized 80µm is the best. Whereas,for salt with particles sized less than 10µm,the seeding mainly takes on a negativeeffect;and the smaller the particle size,the worse the seeding effect.
(5)The larger the seeding amount,the worse the seeding effect in the initial stage,and the better the seeding effect in the later stage.There is an optimal value of seedingamount,andthebestvisibilitywouldbeachievedat thisseeding amount.For salt with a particle size of 80µm,the best correspondingvisibility is 380 m when the seeding amountis 30 g m-2.
Acknowledgements.This research was partially supported by the National Science Foundation of China(Grant Nos.41205100, 41375136 and 41405127),the Beijing Municipal Science and Technology Commission(Project No.Z141100001014017),and the National Department of Public Benefit Research Foundation of China (Grant No.GYHY201306065).
REFERENCES
Cotton,W.R.,and R.A.Anthes,1993:Storm and Cloud Dynamic. China Meteorological Press,311–320.
Ge,L.Y.,Y.R.Jiang,H.M.Liang,S.W.Zhu,and E.Z.Lin, 1998:Discussion on the reason of the five day sustained fog onHu-Ning region intheend of 1996.Scientia Meteorologica Sinica,18(2),181–188.(in Chinese)
Grell,G.A.,S.E.Peckham,R.Schmitz,S.A.McKeen,G.Frost, W.C.Skamarock,and B.Eder,2005:Fully coupled“online”chemistry within the WRF model.Atmos.Environ.,39(37), 6957–6975.
Gultepe,I.,and Coauthors,2007:Fog research:A review of past achievements and future perspectives.Pure Appl.Geophys., 164(6-7),1121–1159.
Guo,E.M.,and J.Y.Zhang,1991:Numerical simulation of the fog evaporation by the warm effect.Journal of the Air Force Institute of Meteorology,12(3),11–16.(in Chinese)
He,H.,X.L.Guo,H.Y.Li,H.Jin,and J.Z.Liu,2011:Numerical simulation of the cold fog dissipation.Chinese Journal of Atmospheric Sciences,35(2),272–286.(in Chinese)
Houghton,H.G.,and W.H.Radford,1938:On the local dissipation of natural fog.Pap.Phys.Oceanogr.Meteor.,6(3),doi: 10.1575/1912/1094.
Hu,Z.J.,C.F.Yan,and Y.B.Wang,1983:Numerical simulation of rain and seeding processes in warm layer clouds.Acta Meteorologica Sinica,41(1),79–88.(in Chinese)
Huang,P.Q.,1988:Numerical simulation of the fog dissipation by salt-seeding.Journal of the Air Force Institute of Meteorology,9(1),33–40.(in Chinese)
Kong,F.,2002:Anexperimental simulationof acoastal fog-stratus case using COAMPS(tm)model.Atmos.Res.,64,205–215.
Kornfeld,P.,1970:Some numerical experiments for warm fog clearing by seeding with hygroscopic nuclei.J.Appl.Meteor., 9,459–463.
Kunkel,B.A,1984:Parameterization of droplet terminal velocity and extinction coefficient in fog models.J.Climate Appl. Meteor.,23(1),34–41.
Mason,B.J.,1971:The Physics of Clouds.Clarendon Press,305–328.
Morrison,H.,J.Curry,and V.Khvorostyanov,2005:A new double-moment microphysics parameterization for application in cloud and climate models.Part I:Description.J.Atmos.Sci.,62(6),1665–1677.
Reisner,J.,R.M.Rasmussen,and R.T.Bruintjes,1998:Explicit forecasting of supercooled liquidwater in winter storms using the MM5 mesoscale model.Quart.J.Roy.Meteor.Soc.,124, 1071–1107.
Silverman,B.A.,and B.A.Kunkel,1970:A numerical model of warm fog dissipation by hygroscopic particle seeding.J. Appl.Meteor.,9,627–633.
Skamarock,W.C,and Coauthors,2008:A description of the advanced research WRF version 3.NCAR Tech.Note NCAR/ TN-475+STR.[Available online at http://www.mmm.ucar. edu/wrf/users/docs/arwv3.pdf.]
Tardif,R.,2007:The impact of vertical resolution in the explicit numerical forecasting of radiation fog:A case study.Pure Appl.Geophys.164,1221–1240.
WMO,1992:International Meteorological Vocabulary.WMO/ OMM/BMO-No,782 pp.
Zhao,Q.Y.,1989:Numerical simulation of warm fog dissipation by salt-seeding.Journal of Tropical Meteorology,5(3),245–252.(in Chinese)
He,H.,X.L.Guo,X.Liu,Q.Gao,and X.C.Jia,2016:Mesoscale numerical simulation study of warm fog dissipation by salt particles seeding.Adv.Atmos.Sci.,33(5),579–592,
10.1007/s00376-015-5151-2.
30 June 2015;revised 14 October 2015;accepted 21 October 2015)
∗Hui HE
Email:hehui@bjmb.gov.cn
杂志排行

Advances in Atmospheric Sciences的其它文章
- Analyses and Forecasts of a Tornadic Supercell Outbreak Using a 3DVAR System Ensemble
- Comparison of a Very-fine-resolution GCM with RCM Dynamical Downscaling in Simulating Climate in China
- Evaluation of Atmosphere–Land Interactions in an LES from the Perspective of Heterogeneity Propagation
- Barotropic Processes Associated with the Development of the Mei-yu Precipitation System
- Impact of Atmospheric and Oceanic Conditions on the Frequency and Genesis Location of Tropical Cyclones over the Western North Pacific in 2004 and 2010
- Upper-Tropospheric Environment–Tropical Cyclone Interactions over the Western North Pacific:A Statistical Study