A self-made, low-cost infrared system for evaluating the sciatic functional index in mice
2016-12-02LukasFrickerVincenzoPennaFlorianLampertBjoernStarkChristianWitzelGeorgiosKoulaxouzidis
Lukas Fricker, Vincenzo Penna, Florian Lampert, G. Bjoern Stark, Christian Witzel, Georgios Koulaxouzidis,
1 Department of Plastic and Hand Surgery, University of Freiburg Medical Center, Freiburg, Germany
2 Plastic and Reconstructive Surgery, Charité — Universitätsmedizin Berlin, Berlin, Germany
RESEARCH ARTICLE
A self-made, low-cost infrared system for evaluating the sciatic functional index in mice
Lukas Fricker1, Vincenzo Penna1, Florian Lampert1, G. Bjoern Stark1, Christian Witzel2,#, Georgios Koulaxouzidis1,*,#
1 Department of Plastic and Hand Surgery, University of Freiburg Medical Center, Freiburg, Germany
2 Plastic and Reconstructive Surgery, Charité — Universitätsmedizin Berlin, Berlin, Germany
The sciatic functional index (SFI) is a popular parameter for peripheral nerve evaluation that relies on footprints obtained with ink and paper. Drawbacks include smearing artefacts and a lack of dynamic information during measurement. Modern applications use digitized systems that can deliver results with less analytical effort and fewer mice. However, the systems are expensive (€40,000). This study aimed to evaluate the applicability and precision of a self-made, low-cost infrared system for evaluating SFI in mice. Mice were subjected to unilateral sciatic nerve crush injury (crush group; n = 7) and sham operation (sham group; n = 4). They were evaluated on the day before surgery, the 2nd, 4thand 6thdays after injury, and then every day up to the 23rdday after injury. We compared two SFI evaluation methods, i.e., conventional inkand-paper SFI (C-SFI) and our infrared system (I-SFI). Our apparatus visualized footprints with totally internally reflected infrared light (950 nm) and a camera that can only detect this wavelength. Additionally we performed an analysis with the ladder beam walking test (LBWT) as a reference test. I-SFI assessment reduced the standard deviation by about 33 percent, from 11.6 to 7.8, and cut the variance around the baseline to 21 percent. The system thus requires fewer measurement repetitions and fewer animals, and cuts the cost of keeping the animals. The apparatus cost €321 to build. Our results show that the process of obtaining the SFI can be made more precise via digitization with a self-made, low-cost infrared system.
#These authors contributed equally to this study.
orcid: 0000-0001-5679-7686 (Georgios Koulaxouzidis)
nerve regeneration; sciatic nerve; crush; frustrated total internal reflection; infrared; ladder beam walking test; error rate; mouse; peripheral nerve injury; neural regeneration
Introduction
Numerous tests exist for evaluating nerve regeneration in experimental animal models, and they can be assessed in very different ways (Navarro, 2016). There are many studies producing contradictory results (Nichols et al., 2004; Neubauer et al., 2010; Brushart, 2011). In view of the stagnation in improvements to clinical outcomes (Irintchev et al., 2005), we believe there is an urgent need to tackle this issue via specification and improved objectivity.
The sciatic functional index (SFI) is a reliable, reproducible, quantitative and widely used test for assessing peripheral nerve recovery in rats and mice (de Medinaceli et al., 1982; Monte-Raso et al., 2008). It allows researchers to determine the state of functional regeneration after unilateral injury to the sciatic nerve by comparing footprints from the affected side with those from the unaffected side (Bain et al., 1989; Inserra et al., 1998; Yao et al., 1998).
The conventional method of acquiring the SFI has two major disadvantages with regard to precision. First, as the footprints are obtained with ink and paper, distortions are frequent and smearing artefacts are unavoidable (Figure 1). Second, the researcher who selects the footprints for analysis does not have access to essential dynamic information (Dijkstra et al., 2000; Sarikcioglu et al., 2009), and so cannot relate the footprints to the circumstances under which they were made. The researcher will not know if a mouse was sitting, hesitating, constantly moving, running, or jumping. For example, every time an animal stops during a run, it presses down with its entire foot pad and heel, creating longer footprints than it would while walking. If the researcher chooses this kind of long footprint for evaluation, the variance will increase. These drawbacks mean that the experiments need numerous animals and involve considerable effort and expense.
To address this issue, we built an infrared system that could digitize the SFI and thus allow us to record the footprints as well as the circumstances under which they were made (Figure 2). This easy-to-build, self-made apparatus is partly similar to a multi-touch display that uses the frustrated total internal reflection (FTIR) effect with infrared light (Han, 2005; Laufs et al., 2009).
In this study, we compared conventional SFI (C-SFI) with a novel self-made infrared system (I-SFI). The ladder beam walking test serves as an external reference, since it assesses the combination of motor and sensory function and correlates with the SFI (Farr et al., 2006; Cummings et al., 2007; Rupp et al., 2007; Metz and Whishaw, 2009; Antonow-Schlorke et al., 2013). Our hypothesis was that the precision of the I-SFI would reduce the number of experimental animals used and the number of experiments needed for evaluation. Like commercial digital systems, this would cut the cost of keeping animals and, since they would haveto perform the test fewer times, put them under less stress compared to the conventional method. However, since our system is more affordable than commercial options, the likelihood of it being used is higher.

Figure 2 Example of the processing of three frames recorded using the new infrared system.
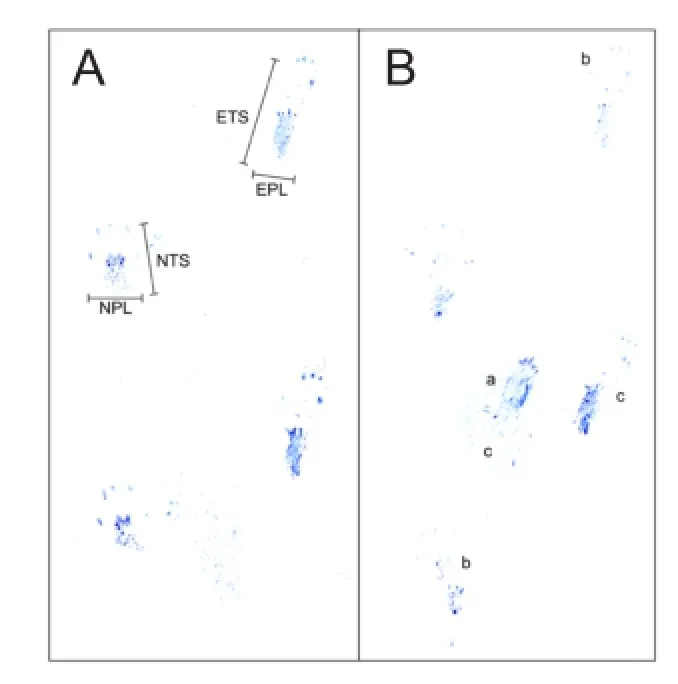
Figure 1 Disadvantages of conventional ink-and-paper sciatic functional index.
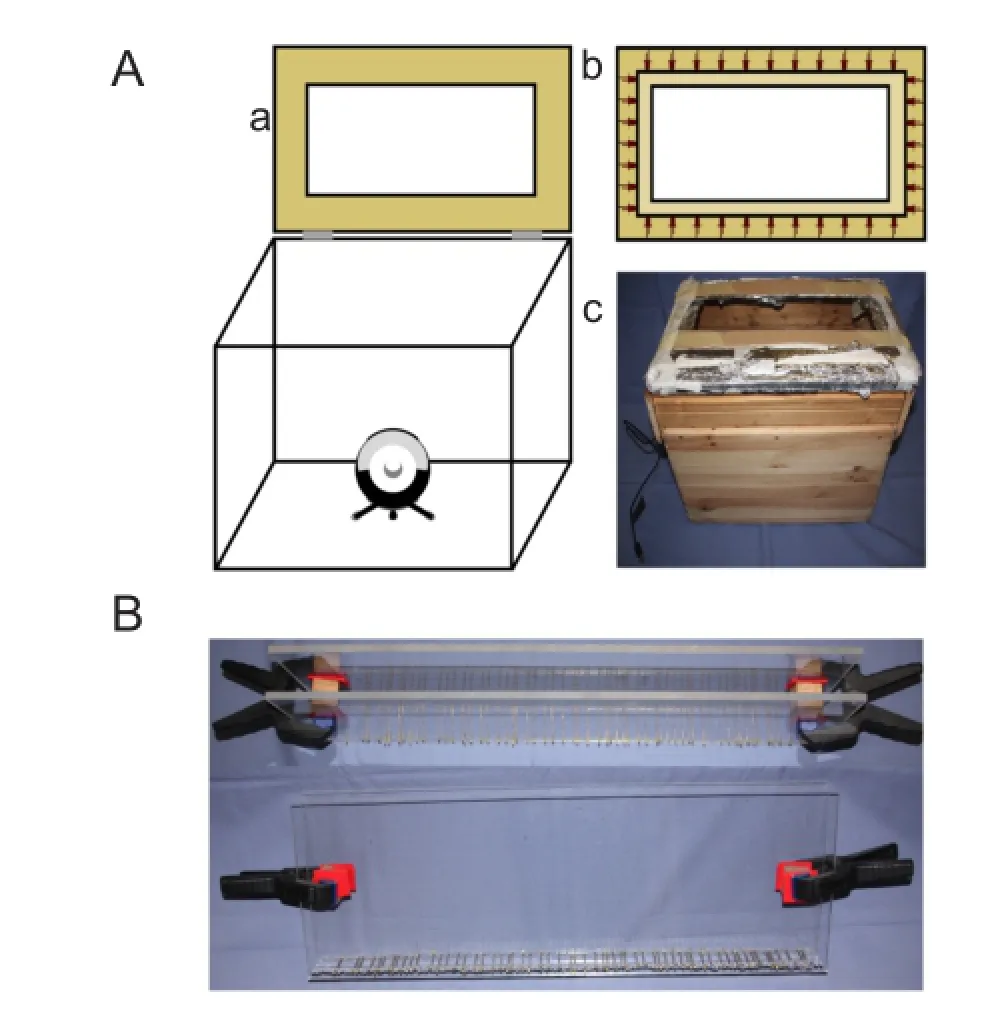
Figure 3 The novel self-made infrared system (I-SFI) and the ladder beam walking test (LBWT).
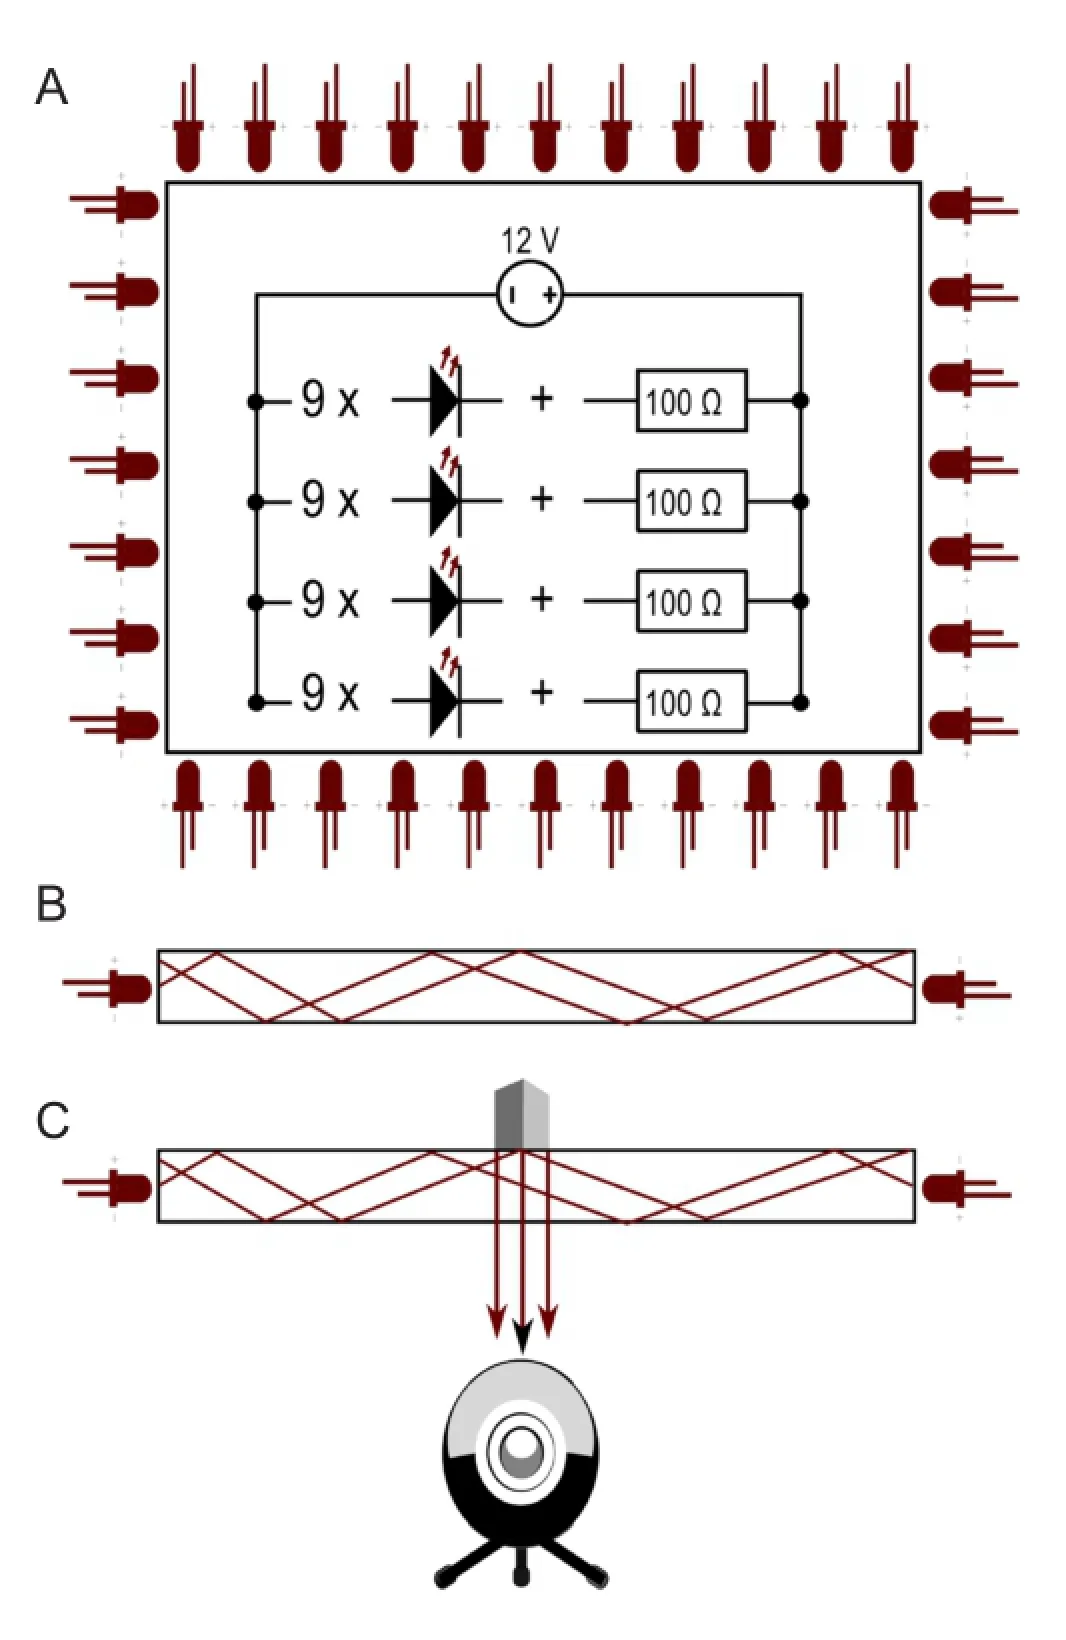
Figure 4 Diagram and principle of the infrared system (I-SFI) capturing apparatus.

Figure 5 Statistical graphs.
Materials and Methods
Animals
Eleven C57BL/6 mice (male and female) were used. They weighed between 22 and 34 g and were randomly divided into two groups. The approving authority of the Regional Commission of Freiburg approved all procedures used in this study. The animals were housed in individual cages, given food and water ad libitum and exposed to a cycle of 12-hour light/dark.
Seven mice were subjected to a unilateral local crush lesion of the sciatic nerve (crush group). The remaining four mice were used as a control group and subjected to sham surgery (sham group). The sham group served as the control group for a stable baseline, while the crush group delivered the full deflection of the SFI spectrum.
Surgical procedure
The mice were heavily anaesthetized with an intraperitoneal injection of a solution consisting of 16 mg/kg xylazine (Rompun®, Bayer, Leverkusen, Germany) and 100 mg/kg ketamine (Ketavet®, Pfizer, Berlin, Germany) after induction with isoflurane (Furene®, Wiesbaden, Germany). After asepsis and trichotomy of the gluteus region, the sciatic nerve was either simply exposed via a longitudinal incision and isolated from the adjacent tissues (sham group; n = 4), or crushed 2 mm proximal to the trifurcation using a bulldog clamp and applying a constant force (2.4 N) at the tip of the clamp for 60 seconds (crush group; n = 7).
Functional tests
The animals in the crush group were evaluated on the day before surgery, on the 2nd, 4thand 6thdays after injury, and then every day up to the 23rdday after lesion (20 postoperative measurements in total). The animals in the sham group were evaluated on the day before surgery, on the 2nd, 4th, 6th, 8th, 11th, 14th, 18th, and 23rddays after injury (9 measurements in total).
Conventional obtained sciatic functional index (C-SFI)
The numerical value of the SFI (Inserra et al., 1998) that we processed ranged from +10 to —110. Animals that dragged their toes were arbitrarily assigned a value of —100. The animals were made to walk in one direction through an acrylic corridor (70 cm × 20 cm × 4 cm) at least three times. The first three analyzable walks were evaluated, and any preceding walks were ignored. Two different methods were used to image the footprints. One used blue ink and white paper (conventional method) and the other used the apparatus we designed (infrared system). For the conventional method, the animals' hind feet were pressed onto an ink pad. After the mice walked through the corridor over A4 white printerpaper (80 g/m2), their footprints were measured with a ruler and rounded to the nearest 0.5 mm.
Infrared system (I-SFI)
The apparatus (Figure 3A) for the infrared method consisted of an acrylic sheet (35.7 cm × 20.7 cm × 1 cm) flooded with infrared light (950 nm) emitted by 36 light-emitting diodes (LEDs), 0.1 A, 1.3 V (Osram® SFH4516, Munich, Germany). The LEDs were evenly distributed along the edges of the acrylic sheet. A camera (Microsoft® HD Studio Webcam, USA) with a resolution of 1,024 × 786 at eight frames per second and fitted with a 52 mm infrared 950 nm bandpass filter (Neewer®, USA) was positioned beneath the sheet. The LEDs were wired in four series of nine bulbs with a resistor, 100 Ω (Yageo®, San Jose, CA, USA). The four series were wired in parallel to a LED transformer, 12 V, 15 W (Goobay®, Pillmannstraße, Braunschweig, Germany) (Figure 4A). The light, which was shielded to the outside with aluminum foil, was only allowed to enter the acrylic sheet from the edges. Thus, the light was trapped between the two surfaces of the acrylic sheet because of frustrated total internal reflection (Figure 4B) (Han, 2005). When an object touched the surface of the acrylic sheet, the light was allowed to leave, thereby illuminating the object (Figure 4C). This is how the camera captured the footprints made by the mice. The researcher chose only the footprints made by a mouse walking steadily, and processed the prints frame by frame with ImageJ software (National Institutes of Health, Bethesda, Maryland, USA). Prints were selected if they were visible on a minimum of two and a maximum of five frames.
Modified ladder beam walking test (LBWT)
The slightly modified LBWT (Farr et al., 2006; Cummings et al., 2007; Metz and Whishaw, 2009; Antonow-Schlorke et al., 2013) consisted of two acrylic sheets (70 cm × 20 cm × 4 cm) fitted with metal rungs spaced at random intervals of between 0.5 cm and 2.5 cm (Figure 3B). The ladder was placed horizontally 20 cm above a mirror, which allowed the researcher to record the mouse's hind feet with a camera (Canon FS11, software: VirtualDub 1.10.4 after conversion to ★.avi using MPEG Streamclip 1.2) while the animal walked from one end of the ladder to the other. The researcher counted the steps of the mouse's hind feet, as well as the incorrect steps. Only steps within a complete step sequence — one step on the affected side and one on the non-affected side — were counted. The error rate was expressed as a percent of all steps, ranging from 0 to 100 percent. Incorrect steps included a slip (the foot was placed on a rung but slipped off), a miss (the foot was placed between two rungs), a drag (the back of the foot was placed on a rung), a lateral glide, and every correction of these errors. A lateral glide means that the mouse's foot slipped backwards and touched the rung behind. This was counted as an error if the angle between the hind foot and a line running parallel to the ladder exceeded 30 degrees at any time during the step. After an error occurred, the next step sequence was ignored.
Data analysis
Statistical analysis was carried out with the software products R (R Core Team, 2015) and OpenOffice Calc 4.1.1 (Apache, Houston, Texas, USA). The significance level was set at 0.05. In a first step, we analyzed and compared the two methods of obtaining SFI. We performed a descriptive statistic for each test and compared the standard deviations (Figure 5A, B). To analyze and compare the means, we used the two-sided Welch two-sample t-test. To analyze variance, we used the two-sided two-sample F-test. We analyzed the correlation of C-SFI, I-SFI and LWBT and, after a curve fit test indicating linearity, performed linear regressions. Using the respective regression equations, we calculated a mean regression equation and then assessed the degree of correlation between the results from both regression equations and the mean (Figure 5C, D). The results are presented as scatter plots (Figure 5E, F) (direct comparison of two tests in a Cartesian coordinate system) and mountain plots (Figure 5A—D) (also known as folded empirical cumulative distribution plots) (Krouwer and Monti, 1995). Mountain plots are an easy way of comparing two tests. The center and the tails are important; the closer the center lies to the y-axis and the closer the tails are to each other, the more precise the test is compared to the other. To aid interpretation, it is possible to superpose the center (50thpercentile) and compare the areas underneath the curves. The smaller they are, the more precise the test is compared to the other.
Results
C-SFI versus I-SFI
Correlation analysis (Spearman's rank correlation and Pearson's correlation) of all postoperative data was performed. Spearman's rank correlation and Pearson's correlation analyses provided identical results, with a correlation coefficient of r = 0.99 (P value = 8.42e—06 and 1.51e—14 respectively; 19 degrees of freedom (DF)).
Standard deviations (SDs) and correlation analysis results of both SFI evaluation methods in the crush group
All data from the 7thpostoperative day were used for analysis because the SFI was constantly obtainable at that time point. The separate consideration of each test run for each mouse provided three footprints, which were analyzed to calculate the SFI. The SD of the three SFI values, which were averaged, showed how precise each test method was. The average SD was 11.6 (range: 1.1—36.9) for C-SFI and 7.8 (range: 0.9—23.6) for I-SFI. Figure 5A provides a visual comparison of the ranges. The average SD of I-SFI was 33.2 percent lower than it was for C-SFI. The absolute reduction was 3.8 (95%CI: 2.5—5.2; P = 1.25e—07; 212 DF). The numerical reduction was only 1.4 of the SDs of the averaged SFI values in the crush group (95%CI: —2.3—4.8; P = 0.49; 40 DF).
Variance analysis results of the sham group
All postoperative data were used for analysis. Both C-SFIand I-SFI evaluation methods showed that the sham group was not affected. Equal footprints on both sides led to an SFI value of —7.5. The mean of the sham group was —7.69 for C-SFI and —7.47 for I-SFI (Figure 5B). Both values are very close to the baseline value of —7.5, but the variance was remarkably different. The quotient of the variance (F-test) for the individual values was 0.48 (95%CI: 0.24—0.96; P = 0.039), and 0.21 (95%CI: 0.05—0.95; P = 0.043) for the mean values of the sham group. I-SFI led to a significant reduction of up to 21 percent of the variance of the conventional method.
Correlation analysis and linear regression results of the SFI methods with the LBWT in the crush group
All postoperative data were used for analysis. Table 1 shows the correlation between two SFI evaluation methods and the reference test. All results show similarly high correlations and are statistically significant.
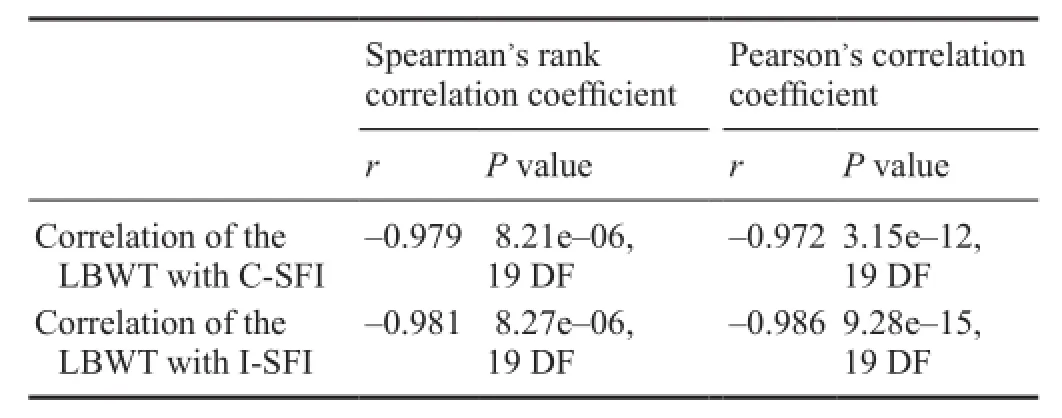
Table 1 Correlation of SFI evaluation methods with the LBWT
Linear regression results
Linear regression revealed the following relationships (19 DF):
C-SFI: y-intercept: —12.32 (P = 0.00078); slope: —1.99 (P = 3.27e—11)
I-SFI: y-intercept: —10.29 (P = 0.0014); slope: —2.03 (P = 3.02e—12)
The average common regression of both methods was therefore SFI(X): —2.01 X — 11.305. For a better visual assessment, the values of the C-SFI and I-SFI were compared with the common mean of their linear regressions. To achieve this, the C-SFI and I-SFI values were inserted in their linear regression formula. Then the difference from the above mentioned average common regression of the SFI values with the LBWT was compared for the crush group (Figure 5C) and the sham group (Figure 5D).
Discussion
The C-SFI obtaining method, which uses ink and paper, is a popular test for assessing nerve recovery in rats and mice (de Medinaceli et al., 1982; Monte-Raso et al., 2008). It indicates the state of functional regeneration after unilateral sciatic nerve injury (Bain et al., 1989; Inserra et al., 1998; Yao et al., 1998). However, disruptive artefacts are common and a lack of dynamic information makes it hard for researchers to objectively select footprints for analysis, as they do not know the circumstances under which the prints were made. These uncertainties reduce precision and mean that the experiments require numerous animals and involve considerable effort and expense (Dijkstra et al., 2000; Sarikcioglu et al., 2009).
Commercially available complete solutions that automatically record SFI and other parameters are a very good option for improving the abovementioned problems. However, a search of Pubmed showed that, out of 1,742 papers published in the last 10 years taking “mice” and “sciatic nerve” as the retrieval words, only four were associated with complete solutions such as “catwalk,” “runwayscan” and “gaitlab.” One reason could be the expense of these types of automated gait analysis systems: in 2013, costs stood at between €35,000 and€40,000.
This study presents an infrared apparatus (I-SFI) that is easy to build and whose parts cost €321. It excludes smearing artefacts, records how footprints are made and estimates the velocity of the mice to the necessary degree.
The aim of our study was to compare two methods of recording mouse footprints to validate I-SFI and a reference test, the LBWT was used. The correlations with the LBWT are very high for both methods and hardly differ from one another. What does differ, however, is the consistency with the mean of the linear regressions. Here, the infrared system demonstrates an advantage over C-SFI.
As the high correlations show, the SFI results of the crush group predominantly agree. Since both methods (I-SFI and C-SFI) measure the same thing, this agreement was a precondition for further investigation. The mean SD of I-SFI is 33.2 percent lower than it is for C-SFI. The results of the sham group also indicate that I-SFI is better. The infrared system reduces the variance to 0.2 times the variance of the conventional method. This suggests that our I-SFI evaluation method increases precision. Another sign of this is that the I-SFI is more consistent with the mean of the linear regression of the LBWT than the C-SFI is. We can therefore assume that I-SFI will require fewer animals to reach a sufficient level of significance.
We used the number of frames at a given frame rate to preselect a range for the animals' velocity. The sciatic static index for mice (SSIm) was developed to rule out the problem of velocity (Bervar, 2000; Baptista et al., 2007). The SSIm correlates with the SFI and is also based on footprints. Unlike the SFI, however, the mouse stands still, thus eliminating the problem of changes in speed. The authors obtained the SSIm with a camera placed beneath an acrylic sheet, and evaluated the footprints with the help of anatomical features. Evaluating the prints in this way is a weak point, but it can easily be improved upon by combining the footprint-visualizing apparatus and the SSIm. This would reduce the number of uncertainties that impact the precision of the assessment.
Conclusion
Our easy-to-build apparatus reduced the amount of humaneffort required, and removed some of the stress from the animals because there was no need to stain their hind feet with ink. The reduction of the SD of the regeneration curve (crush group) by about a third (33.2%) and that of the baseline variance (sham group) by nearly 80 percent are significant and might reduce the number of animals needed for such experiments. Our hypothesis is that this inexpensive method of digitization can help minimize artefacts and can increase analytical objectivity by making it easier to select suitable footprints and reject those that are unsuitable. Complete solutions consisting of hardware and associated software are available and can be used for the gait analysis of mice (Vogelaar et al., 2004). However, the solutions are too expensive for small study groups, they can be prone to interference from ambient light, and they have rarely been used, despite having been available for more than 10 years.
Author contributions: LF, CW and GK designed the study and performed the research. VP, FL and GBS interpreted the data and critically reviewed the paper for important intellectual content. LF was also responsible for data collection and statistical analysis, and wrote the paper. All authors approved the final version of the paper.
Conflicts of interest: None declared.
Plagiarism check: This paper was screened twice using Cross-Check to verify originality before publication.
Peer review: This paper was double-blinded and stringently reviewed by international expert reviewers.
Antonow-Schlorke I, Ehrhardt J, Knieling M (2013) Modification of the ladder rung walking task-new options for analysis of skilled movements. Stroke Res Treat 2013:418627.
Bain JR, Mackinnon SE, Hunter DA (1989) Functional evaluation of complete sciatic, peroneal, and posterior tibial nerve lesions in the rat. Plast Reconstr Surg 83:129-138.
Baptista AF, Gomes JR, Oliveira JT, Santos SM, Vannier-Santos MA, Martinez AM (2007) A new approach to assess function after sciatic nerve lesion in the mouse - adaptation of the sciatic static index. J Neurosci Methods 161:259-264.
Bervar M (2000) Video analysis of standing--an alternative footprint analysis to assess functional loss following injury to the rat sciatic nerve. J Neurosci Methods 102:109-116.
Brushart TM (2011) Nerve repair. New York: Oxford University Press.
Cummings BJ, Engesser-Cesar C, Cadena G, Anderson AJ (2007) Adaptation of a ladder beam walking task to assess locomotor recovery in mice following spinal cord injury. Behav Brain Res 177:232-241.
de Medinaceli L, Freed WJ, Wyatt RJ (1982) An index of the functional condition of rat sciatic nerve based on measurements made from walking tracks. Exp Neurol 77:634-643.
Dijkstra JR, Meek MF, Robinson PH, Gramsbergen A (2000) Methods to evaluate functional nerve recovery in adult rats: walking track analysis, video analysis and the withdrawal reflex. J Neurosci Methods 96:89-96.
Farr TD, Liu L, Colwell KL, Whishaw IQ, Metz GA (2006) Bilateral alteration in stepping pattern after unilateral motor cortex injury: A new test strategy for analysis of skilled limb movements in neurological mouse models. J Neurosci Methods 153:104-113.
Han JY (2005) Low-cost multi-touch sensing through frustrated total internal reflection. In: the 18th annual ACM symposium (Baudisch P, Czerwinski M, Olsen D, eds), pp115. ACM, New York, NY, USA.
Inserra MM, Bloch DA, Terris DJ (1998) Functional indices for sciatic, peroneal, and posterior tibial nerve lesions in the mouse. Microsurgery 18:119-124.
Irintchev A, Simova O, Eberhardt KA, Morellini F, Schachner M (2005) Impacts of lesion severity and tyrosine kinase receptor B deficiency on functional outcome of femoral nerve injury assessed by a novel single-frame motion analysis in mice. Eur J Neurosci 22:802-808.
Krouwer JS, Monti KL (1995) A simple, graphical method to evaluate laboratory assays. Eur J Clin Chem Clin Biochem 33:525-527.
Laufs U, Block M, Link J, Ardilio A, Schuller A, Bierkandt J (2009) In: Studie Multi-Touch — Technologie, Hard-/Software und deren Anwendungsszenarien (Spath D, Weisbecker A, eds). Beteiligt. Fraunhofer IAO.
Metz GA, Whishaw IQ (2009) The ladder rung walking task: a scoring system and its practical application. J Vis Exp pii: 1204.
Monte-Raso VV, Barbieri CH, Mazzer N, Yamasita AC, Barbieri G (2008) Is the Sciatic Functional Index always reliable and reproducible? J Neurosci Methods 170:255-261.
Navarro X (2016) Functional evaluation of peripheral nerve regeneration and target reinnervation in animal models: a critical overview. Eur J Neurosci 43:271-286.
Neubauer D, Graham JB, Muir D (2010) Nerve grafts with various sensory and motor fiber compositions are equally effective for the repair of a mixed nerve defect. Exp Neurol 223:203-206.
Nichols CM, Brenner MJ, Fox IK, Tung TH, Hunter DA, Rickman SR, Mackinnon SE (2004) Effects of motor versus sensory nerve grafts on peripheral nerve regeneration. Exp Neurol 190:347-355.
R Core Team (2015) R: A Language and Environment for Statistical Computing. http://www.R-project.org.
Rupp A, Dornseifer U, Fischer A, Schmahl W, Rodenacker K, Jütting U, Gais P, Biemer E, Papadopulos N, Matiasek K (2007) Electrophysiologic assessment of sciatic nerve regeneration in the rat: surrounding limb muscles feature strongly in recordings from the gastrocnemius muscle. J Neurosci Methods 166:266-277.
Sarikcioglu L, Demirel BM, Utuk A (2009) Walking track analysis: an assessment method for functional recovery after sciatic nerve injury in the rat. Folia Morphol (Warsz) 68:1-7.
Vogelaar CF, Vrinten DH, Hoekman MF, Brakkee JH, Burbach JP, Hamers FP (2004) Sciatic nerve regeneration in mice and rats: recovery of sensory innervation is followed by a slowly retreating neuropathic pain-like syndrome. Brain Res 1027:67-72.
Yao M, Inserra MM, Duh MJ, Terris DJ (1998) A longitudinal, functional study of peripheral nerve recovery in the mouse. Laryngoscope 108:1141-1145.
Copyedited by Gundogdu C, Haastert-Talini K, Li CH, Song LP, Zhao M
10.4103/1673-5374.182712 http://www.nrronline.org/
How to cite this article: Fricker L, Penna V, Lampert F, Stark GB, Witzel C, Koulaxouzidis G (2016) A self-made, low-cost infrared system for evaluating the sciatic functional index in mice. Neural Regen Res 11(5)∶829-834.
Accepted: 2016-02-02
*Correspondence to: Georgios Koulaxouzidis, M.D., georgios.koulaxouzidis@ uniklinik-freiburg.de.
杂志排行

中国神经再生研究(英文版)的其它文章
- Possible application of apolipoprotein E-containing lipoproteins and polyunsaturated fatty acids in neural regeneration
- Recovery of injured fornical crura following neurosurgical operation of a brain tumor: a case report
- Antibody-based neuronal and axonal delivery vectors for targeted ligand delivery
- Coordination of the axonal cytoskeleton during the emergence of axon collateral branches
- Alzheimer's disease: the silver tsunami of the 21stcentury
- Clinical trial perspective for adult and juvenile Huntington's disease using genetically-engineered mesenchymal stem cells