Assimilating Surface Observations in a Four-Dimensional Variational Doppler Radar Data Assimilation System to Improve the Analysis and Forecast of a Squall Line Case
2016-08-09XingchaoCHENKunZHAOJuanzhenSUNBowenZHOUandWenChauLEE0046
Xingchao CHEN,Kun ZHAO,Juanzhen SUN,Bowen ZHOU,and Wen-Chau LEE/0046
2National Center for Atmospheric Research,Boulder,Colorado80301,USA
Assimilating Surface Observations in a Four-Dimensional Variational Doppler Radar Data Assimilation System to Improve the Analysis and Forecast of a Squall Line Case
Xingchao CHEN1,2,Kun ZHAO*1,Juanzhen SUN2,Bowen ZHOU1,and Wen-Chau LEE2
1Key Laboratory for Mesoscale Severe Weather/MOE and School of Atmospheric Science,Nanjing University,Nanjing210046,China
2National Center for Atmospheric Research,Boulder,Colorado80301,USA
(Received 30 December 2015;revised 24 March 2016;accepted 8 April 2016)
This paper examines how assimilating surface observations can improve the analysis and forecast ability of a fourdimensional Variational Doppler Radar Analysis System(VDRAS).Observed surface temperature and winds are assimilated together with radar radial velocity and re fl ectivity into a convection-permitting model using the VDRAS four-dimensional variational(4DVAR)data assimilation system.A squall-line case observed during a fi eld campaign is selected to investigate the performance of the technique.A single observation experiment shows that assimilating surface observations can in fl uence the analyzed fi elds in both the horizontal and vertical directions.The surface-based cold pool,divergence and gust front of the squall line are all strengthened through the assimilation of the single surface observation.Three experiments—assimilating radar data only,assimilating radar data with surface data blended in a mesoscale background,and assimilating both radar and surface observations with a 4DVAR cost function—are conducted to examine the impact of the surface data assimilation. Independent surface and wind pro fi ler observations are used for veri fi cation.The result shows that the analysis and forecast are improved when surface observations are assimilated in addition to radar observations.It is also shown that the additional surface data can help improve the analysis and forecast at low levels.Surface and low-level features of the squall line—including the surface warm in fl ow,cold pool,gust front,and low-level wind—are much closer to the observations after assimilating the surface data in VDRAS.
VDRAS,4-D data assimilation,radar data,surface data,squall line
1. Introduction
With the increases in computing power,it is possible to resolve and forecast the features of severe convective systems throughaconvection-permittingnumericalmodel.Oneofthe major challenges of storm-resolving numerical weather prediction(NWP)models is the accuracy of initial conditions. However,the forecast of meso-or convective-scale weather systems is a highly nonlinear initial value problem;the inaccuracy of the analyzed initial state becomes the fundamental limitation for the prediction of severe convective systems(Schenkman et al.,2011a).The high temporal(<10 min)and spatial(<1.0 km)resolution of Doppler radar makes it the best remote sensing device to probe the variation of hydrometeors and the air fl ow structures inside the convective system(Lilly,1990;Sun et al.,1991).Numerous studies have shown that the assimilation of radar re fl ectivity and radial velocity data can improve the analysis and subsequent forecast of convective systems(e.g.,Sun and Crook,1998;Weygandt et al.,2002a,2002b;Dawson and Xue,2006).
Considering the in fl uence of Earth’s curvature,the height between the lowest radar beam(if the lowest radar elevation is 0.5°)and the surface can exceed 1.0 km at 80 km away from the radar site,and could be even more extended under sub-refraction conditions.This blind region to the radar largely lies in the planetary boundary layer(PBL),in whichPBLprocessessuchashorizontalconvectiverolls,drylines,and cold-pools can trigger convection under a favorable large-scale environment(Sobash and Stensrud,2015).In particular,surface-based cold pools produced by the evaporation of precipitation can in fl uence the initiation,development andpropagationofconvectivesystems(e.g.,Tompkins,2001;Lima and Wilson,2008).The intensity of cold pool and environmental vertical wind shear are critical factors in determining a convective system’s structure and evolution(e.g.,Ro-tunno et al.,1988;Weisman et al.,1988;Bryan et al.,2006;Parker,2010).These PBL processes cannot be resolved well if only radar data are assimilated in NWP.Data from surface observations have been used in the past to detect these processes and will be more valuable if assimilated into NWP models along with radar data.
In the past several years,with the increase and improvement of surface observation networks[e.g.,automatic weather stations(AWSs)],surface data at high spatial(<10 km)and temporal(~5 min)resolution have become commonly available in real time.Rapidly evolving surface mesoscale features that are important to the analysis and forecasting of convective systems can be monitored routinely. Therefore,it is expected that assimilating these surface observations into NWP models at frequent intervals can fi ll the low-level blind region of radar detection and yield a better analysis and forecast,since PBL processes play an essential role in convective systems.
Several studies have been conducted to assimilate surface observations together with radar observations with a convection-permitting model.For example,Zhang et al.(2004)found that when low-level radar observations are missing,the EnKF(ensemble Kalman fi lter)can provide a better estimate of the storm with the incorporation of surface wind and temperature observations.Dong et al.(2011)indicated that when a radar is far away from a convective system,a positive impact results from assimilating surface observations,as long as the network spacing is less than 20 km.Through assimilating high-resolution Doppler radar radial velocities and in situ surface observations into an EnKF system,Marquis et al.(2014)successfully simulated mesocyclone-scale processes in the Goshen County,Wyoming,and the tornadic supercell of 5 June 2009.Yussouf et al.(2015)developed a multiscale ensemble-based assimilation and prediction system that can assimilate the radar,surface,and other observations together.Using this system,they analyzed the storm-scale features of the 27 April 2011 Alabama severe weather outbreak.Through assimilating radar and surface observations with an EnKF in combination with a double-moment microphysics scheme,Putnam et al.(2014)analyzed the microphysical states and precipitation structures within a mesoscale convective system that passed over western Oklahoma during 8—9 May 2007.Schenkman et al.(2011b)examined the impact of radar and Oklahoma Mesonet data assimilation on the prediction of mesovortices in a tornadic mesoscale convective system(MCS)through a three-dimensional variational data assimilation(3DVAR)system.Results again con fi rmed the positive impact of surface data in the absence of radar data.Snook et al.(2015)analyzed the same tornadic MCS through an EnKF system and found that assimilating the convectional observations(including surface,wind pro fi ler,and upper-air observations)together with radar observations resulted in better meso-and convective-scale features.Similar conclusions,regarding the prediction of heavy rainfall over southern China,were reached in Hou et al.(2013).
Despite positive results,surface observations are still underused in operational data assimilation systems(Pu et al.,2013).To the best of the authors’knowledge,there have been no studies that have assessed the impact of assimilating surface observations along with radar data using a fourdimensional variational(4DVAR)data assimilation system. 4DVAR has been proven to be more accurate than 3DVAR. Moreover,when compared with the EnKF,it allows for the assimilation of asynchronous observations with serially correlated errors by including time correlations(Kalnay et al.,2007).However,the 4DVAR method requires an adjoint model,whose numerical structures must closely follow those in the prognostic model(Tai et al.,2011).Therefore,high computational cost is accrued,and greater complexity expected,in 4DVAR systems.
In this study,we describe a surface data assimilation method in the 4DVAR radar data assimilation system VDRAS(Variational Doppler Radar Analysis System)(Sun and Crook,1997)developed by NCAR.A squall-line case observed during the Observation,Prediction and Analysis of SevereConvectionofChina(OPACC) fi eldcampaignin2014 is used to test the impact of the surface data assimilation.The objective is to examine whether additional surface observations can improve the analysis and short-term forecast ability of VDRAS.
The rest of this paper is organized as follows:In section 2,VDRAS and the new development for surface data assimilation are described.An overview of the squall-line case observed in OPACC is introduced in section 3.The experimental design is described in section 4.Results and veri fication are presented in section 5.A summary and discussion are given in section 6.
2. Surface data assimilation in VDRAS
2.1. VDRAS description
VDRAS is a convective-scale data assimilation system based on the 4DVAR technique with a cloud model as its constraint.It has been successfully used as the analysis and short-term forecast system of the Beijing Summer Olympics(Sun et al.,2010)and is still in operation at NCAR,the Beijing Meteorological Bureau and Taiwan Central Weather Bureau.The main objective of VDRAS is to produce rapidly updated(in the order of minutes)analysis for severe weather analysis and nowcasting,which is made possible by using a short 4DVAR assimilation window that covers three volumes of radar observations.The main data sources of VDRAS are from Doppler radar and surface networks,while other large-scale data are indirectly incorporated by using a highresolution mesoscale model’s analysis/forecast as the background and boundary conditions.Through the cloud model and the 4DVAR scheme,VDRAS can retrieve the unobserved(by radar)temperature,wind and other microphysical variables by assimilating re fl ectivity and radial velocity observations from a single or multiple radar networks.Readers are referred to Sun and Crook(1997,2001)for the system’s design and cloud model,Chang et al.(2015)for the recent ad-dition of an ice physics scheme,and Sun and Crook(2001),Crook and Sun(2004),and Sun et al.(2010)for an evaluation of the system’s operational performance.
In this study,the operational WRF forecast during OPACC at 4 km spatial resolution is used to provide the background and boundary conditions.The operational WRF forecast is performed over a single domain that covers most parts of China with 1409×1081 horizontal grid points and 27 vertical levels.The WRF model employs the ACM2 boundary layer scheme(Pleim,2007),the Pleim—Xiu surface model(Pleim,2007),the CAM longwave and shortwave radiation schemes,and the WRF Morrison double-moment microphysics scheme(Morrison et al.,2009).In addition,the VAD(velocity azimuth display)wind pro fi le(Klazura and Imy,1993)for each radar has been computed and blended with the WRF background to produce a gridded mesoscale analysis using a Barnes interpolation technique(Barnes,1964).This mesoscale analysis is used as a fi rst guess in the fi rst analysis cycle.Each analysis cycle contains a 15-min assimilation window and a 5-min short forecast to provide background for the next cycle.In each cycle,an optimal initial state between the background fi eld and radar observations is calculated by minimizing a cost function(J),

In Eq.(1),the summation is conducted over space(σ)and time(t), xxx0represents the model state variables at the beginning of the current cycle, xxxbstands for the background information,and B is the covariance matrix of background error. The weighting coefficients ηvand ηqstand for the inverse of theobservationalerrorvarianceforradialwindandrainwater,respectively.Uncorrelated observation error is assumed.The model-generated Doppler radial velocity and rainwater mixing ratio are represented by vrand qr,while their observed counterparts are expressed by v0,rand q0,r.Jpis a penalty term for additional constraints to preserve the temporal and spatial smoothness of the analysis.Jmbstands for the background penalty term that measures the di ff erence between the 4DVAR analysis and the mesoscale analysis to ensure that the 4DVAR radar analysis is not too far from the mesoscale analysis in the region outside the radar coverage.The observed rainwater mixing ratio is estimated from radar re fl ectivity by the following formula,which assumes a Marshall—Palmer raindrop size distribution(Sun and Crook,1997):

where Z is the re fl ectivity in dBZ and ρ is the density of air. A complete description of VDRAS can be found in Sun and Crook(2001),and Crook and Sun(2004).
Many previous studies have shown that VDRAS can retrieve the meteorological variables of convective storms through the depth of the troposphere(e.g.,Sun and Zhang, 2008).For real-time applications,however,VDRAS is usually implemented to retrieve only low-level wind and temperature,due to limited computation resources Sun et al.(2010). In this paper,we retrieve the meteorological variables of the squall line up to 15 km,with a focus on the improvements at the low levels.
2.2. Improvements to the surface data assimilation inVDRAS
In its original version,surface observations are used to improve the retrieval capability of VDRAS.However,they are used to correct the WRF analysis/forecast prior to the 4DVAR radar data assimilation using a 3D analysis method in the mesoscale background analysis step(Crook and Sun,2004).Surface observations are interpolated horizontally onto the VDRAS grid using the Barnes interpolation scheme,and then vertically combined with the VAD-corrected WRF background data(described in section 2.1)using a leastsquares fi ttingmethod.Thereasonforsuchadesignisthat,in the past,most of the available surface observations were from the conventional synoptic network.The spatial and temporal resolutions of the conventional surface observations are much sparser and less frequent than radar observations,so that they only stand for the large-scale environmental conditions.This two-step approach can provide a more detailed analysis of the convective-scale features from the radar observations by using a small assimilation window and a small length scale for the background error covariance represented in a recursive fi lter(Hayden and Purser,1995;Sun and Zhang,2008).
With the development of AWS surface observation networks,mesoscale and in some cases convective-scale processes,can be captured.The temporal resolution of surface observations can reach 5 min,which is similar to the duration of radar volume scan.Concurrent assimilation of surface and radar observations in 4DVAR is expected to yield a better mesoscale analysis and short-term forecast than the original two-step approach in which the surface observations are fi rstly interpreted to the background analysis,and then the radar data assimilated through the 4DVAR scheme.In the current work,surface temperature and wind are assimilated with radar re fl ectivity and radial velocity simultaneously,with the following cost function:

Three additional terms are included in Eq.(3),representing surface temperature(Ts)and the x and y components of the surface winds(Us,Vs).The observed surface 10 m winds(U10m,V10m)from AWSs are extrapolated to the lowest model level(U0,sand V0,s)based on an empirical power law relation in the surface layer(Peterson and Hennessey,1978),
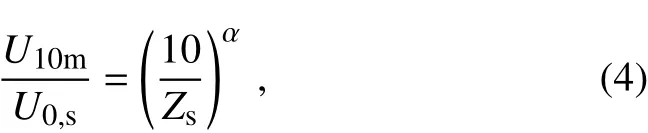
where Zsis the height of the lowest model grid level,set to 100 m in this study,which is around the top of the surface layer.The exponent α is an empirically derived coefficient that depends on the local stability.For neutral conditions,α is approximately 0.143(Hsu et al.,1994).Estimated temperature at the lowest model level(T0,s)is extrapolated from the AWS 2 m temperature using a lapse rate of 6.5°C km-1.The weighting coefficients ηT,ηUand ηVstand for the inverse of the respective observation error variances.In this study,all surface weighting coefficients are taken as constants(set to 1.0)for simplicity.The optimal weighting coefficients will requirefurtherstudy.Correspondingtothenewcostfunction,the adjoint model of VDRAS is modi fi ed and the accuracy of the adjoint model veri fi ed following the method in Sun and Crook(1997).
3. Overview of the squall-line case
The squall-line case studied in this paper is selected from the OPACC fi eld campaign.OPACC is a 5-year project focused on studying the dynamical and microphysical characteristics of convective weather systems over eastern China,as well as the observation techniques and forecasting methods for such systems.The fi rst fi eld campaign of OPACC was conducted from 1 June to 3 August 2014 over the Yangtze River—Huaihe River(YHR)basin.Several quasi-linear convective systems and two squall lines were observed on 30 July 2014 during the intensive observing period(IOP)10 of OPACC.A tropical cyclone was situated over the South China Sea at that time.Its circulation transported warm and moist air from the ocean inland to the YHR basin,setting up a moist and unstable environment that was favorable for convectiveinitiation.Figure1showsthemergedcompositeradar re fl ectivity from 0830 to 1600 UTC 30 July 2014,using six operational radars(FYRD,BBRD,NJRD,HFRD,TLRD and AQRD in Fig.2).The merged composite radar re fl ectivity is computed at each grid point by taking the maximum re fl ectivity among all six radars.A convective system was initiated near 0330 UTC over the northern part of the observation domain in Fig.1(not shown).It organized into a west—east oriented squall line(the fi rst squall line)with extreme rainfall and high surface wind 5 hours later(Fig.1a).In the next three hours,this squall line moved to the central part of the domain and broke into several north—south oriented quasilinear MCSs around 1130 UTC(Fig.1b).By 1430 UTC,a new squall line had been triggered on the east side of these MCSs(Fig.1c).The second squall line matured at around 1600 UTC and formed a bowing structure with a maximum re fl ectivity of greater than 55 dBZ(Fig.1d).Extreme surface wind(up to 19.2 m s-1)and precipitation(up to 56.6 mm h-1)were also observed at this time.
4. Experimental design
Two single observation experiments(SP-AWS and SPNOAWS)were designed to investigate the impact of assimilating single-point surface observations on the VDRAS analysis in both the horizontal and vertical directions.The domain of the single observation experiments is shown by a red dashed box in Fig.2.Re fl ectivity and radial velocity from the Hefei radar(HFRD in Fig.2)are assimilated together with the surface wind and temperature observations from the AWS(red dot in Fig.2)in SP-AWS,whereas HFRD data alone are assimilated in SP-NOAWS.The domain of the two experiments has 80×80 horizontal grid points and 50 vertical levels.The horizontal resolution of these two experiments is 3 km and the vertical grid size is 200 m,with the lowest model level at 100 m above the surface.The data assimilation procedure starts at 1300 UTC 30 July 2014,and ends at 1620 UTC.This time period includes the initiation and development stages of the second squall line documented in section 3(Figs.1c and d).Altogether,eleven analysis cycles are included.Each cycle has a 15 min 4DVAR time window,followed by a 5-min forecast,to provide background for the next cycle.The short forecasts between two assimilation windows are added such that no observations will be used twice(Sun and Zhang,2008).The typical volumetric scan for radars is 5—6 min and the time resolution of AWS observations is 5 min;two to three radar volumetric scans and three surface observations are included in each assimilation window.Increments(SP-AWS minus SP-NOAWS)of di ff erent model variables(temperature,pressure and horizontal wind)are analyzed in section 5.1.
Three assimilation experiments(RAD-ONLY,SURFMESO and SURF-4DVAR)are conducted to examine whether including the AWS observations can improve VDRAS with multiple radar assimilations.The model domain for these three experiments is larger than the single observation experiment,in order to include all seven radars.It has 140×140 horizontal grid points and 50 vertical levels(see Fig.2).The grid spacing is the same as the single observation experiments.In RAD-ONLY,surface data are not used either in the background analysis step or in the 4DVAR cost function.Radar re fl ectivity and radial velocity data from six S-band operational radars(FYRD,BBRD,NJRD,HFRD,TLRD and AQRD)and one C-band research radar developed by Nanjing University(NJU-CPOL in Fig.2)are assimilated through the 4DVAR cost function shown in Eq.(1),using the VAD-corrected WRF 4-km data as the mesoscale background.In the experiment SURF-MESO,the original surface data assimilation method is applied,i.e.,the AWS data are used in the background analysis prior to the 4DVAR radar data assimilation,as described in section 2.In SURF-4DVAR,the background analysis is the same as RAD-ONLY but additional AWS data are assimilated in the 4DVAR cycles using the cost function in Eq.(3).
The three assimilation experiments start at 0700 UTC 30 July 2014,and end at 1940 UTC.The period extends from the initiation of the fi rst quasi-linear MCS to the dissipation of thesecondbowingsquallline(Fig.1).Timelengthsofassimilation windows are 15 min,followed by a 5-min forecast—thesameasinthesingleobservationexperiments.A1-hforecast is performed at the end of each analysis cycle to furtherinvestigate the in fl uence of surface data assimilation on the forecast.Data from two AWSs(green dots in Fig.2)are not assimilated in SURF-MESO or SURF-4DVAR,and are used for veri fi cation.A wind pro fi ler(green square in Fig.2)is also used to examine the e ff ects of surface data assimilation on low-level wind fi elds.

Fig.1.Mosaics of composite radar re fl ectivity at(a)0830,(b)1130,(c)1430 and(d)1600 UTC.Provincial borders are superimposed as black contours.The location of Hefei radar is represented by the black triangle,and the two surface stations used for independent veri fi cation are marked by black dots.
5. Results and veri fi cation
5.1. Single AWS observation experiment
Figure 3 shows the analysis increments of temperature,pressure and horizontal wind fi elds on the lowest model level(100 m)between SP-AWS and SP-NOAWS at 1500 UTC 31 July 2014.The second squall line evolved into a bowing structure on the east side of the dissipating quasi-linear MCS at this time.The assimilation of a single surface observation produces near-surface cooling around the AWS station(Fig. 3a)and intensi fi es the surface-based cold pool strength of the oldMCS.Thesecondsqualllineislocatedattheleadingedge of this intensi fi ed cold pool.Spatial inhomogeneity can be found with a stronger cooling over the region covered by the new squall line(around 117.8°E),which represents the intensi fi cation of the cold pool produced by the second squall line after surface data are assimilated.Though the pressure fi eld hasnotbeenassimilated throughthe 4DVARscheme directly,it is adjusted through the cloud model and its adjoint model in the 4DVAR system during the assimilation cycles,wherever the pressure responds to the analyzed temperature.The analysis increment of the pressure fi eld has a similar spatial distribution pattern as the temperature fi eld.Increases in pressure arefoundovertheoldandnewcoldpoolareaproducedbythe original MCSs and the second squall line,respectively.Analysis increments inUandVwind components are shown in Figs.3b and c.The spatial inhomogeneity of the wind fi elds is much clearer than for the temperature and pressure fi elds.Incremental divergence can be found under the quasi-linear MCS,corresponding to the region with decreasing temperature and increasing pressure.Assimilation of the single-point surface observations also increases the strength of the out fl ow to the east of the new squall line.

Fig.2.Analysis and forecast domains for the real-data assimilation experiments(black dashed box)and the single observation experiment(red dashed box).The locations of the six S-band operational radars and one C-band research radar(CPol)are marked by the black triangles.The blue dots represent AWSs. Two AWSs(ID:58203 and 58236)and a wind pro fi ler used for veri fi cation are marked by the green dots and square.The AWS used in the single observation experiment is marked by the red dot.Orography(units:m)is shown in gray-scale,and provincial borders by black lines.
Verticalcrosssections alongthe blackdashed lines in Fig. 3 are presented in Fig.4.Two convective systems are seen from the radar re fl ectivity contours,the old quasi-linear MCS in the center and the newly developed squall line on the right. As in Fig.3,strengthening of the cold pool under the MCS is indicated by decreased temperature in Fig.4a,and increased pressure in Fig.4b,below 1.5 km.Meanwhile,the incrementalstrengtheningofthesquallline’scoldpoolisnotclearover this cross section.This squall line was formed shortly before 1500 UTC;its cold pool is still very shallow at this time and can only be found at the lowest levels(Fig.3b).Incremental low-level and high-level divergence of the MCS in the center can also be found in Figs.4c and d.The gust front produced by the squall line is also intensi fi ed at around 118°E(Fig.4c).
5.2. VDRAS analyses of the real data experiments
The AWS observed surface wind and temperature fi elds at 1500 UTC are shown in Fig.5a,with the observed composite radar re fl ectivity superimposed as black contours.As seen in Fig.1,this is the time when the convective systems have moved from the northern part to the central part of the domain.Heavy rainfall occurred over the path of the system,so the surface temperature over these areas is much colderthan in the southern part.Based on the surface wind observations,a clear gust front,marked by the black dashed line in Fig.5a,and warm surface in fl ow,occur over the southeast side of the squall line.

Fig.3.Horizontal distributions of the analysis increments(SP-AWS minus SP-NOAWS)of(a)temperature,(b)pressure,(c)Uwind and(d)Vwind,on the lowest model level(100 m)at 1500 UTC 31 July 2014.Composite radar re fl ectivity is shown in black contours,starting from 30 dBZand with an interval of 10 dBZ.

Fig.4.Vertical cross sections of the analysis increments of(a)temperature,(b)pressure,(c)Uwind and(d)Vwind,along the black dashed line in Fig.3.Observed radar re fl ectivity is shown in black contours,starting from 30 dBZand with an interval of 10 dBZ.
The estimated surface wind and temperature fi elds at 1500 UTC from the three assimilation experiments are shown in Figs.5b—d.Surface wind and temperature are extrapolated from the model temperature and wind on the lowest grid level at 100 m.When only radar data are used in the 4DVAR assimilation,large di ff erences can be found between the AWS observation(Fig.5a)and the RAD-ONLY analysis(Fig.5b).The surface temperature of the northern and central domain in the RAD-ONLY analysis is much warmer than the AWS observations,especially for the region without the radar coverage.On the other hand,the surface warm in fl ow on the southeast side of the squall line(shown by the white box in Fig.5)is colder than observed.Surface-based cold pools of the old quasi-linear MCS and the bowing squall line are weaker.However,surface out fl ow from the cold pools is much stronger than in the AWS observations,and the position of the gust front is also further ahead of the squall line. In the RAD-ONLY experiment,the surface wind analysis is a combination of the upper-level radar radial velocity observations and the background fi eld through the spatial correlation implied in the cloud model,which also results in the temperature increment in the region with radar data through the crossvariable correlation in the cloud model.However,in the region without radar observations,both the wind and temperature analyses are mainly from the WRF background.Without the surface observations,the errors in the background cannot be corrected.That is the main reason for the large temperature error in the environment surrounding the convective system.It is also noted that in the region with radar observations,the temperature still shows a few di ff erences from the AWS observations,which can be partly attributed to the inadequate sample of radar data at low levels and the uncertainty of the cross-variable correlation in the cloud model.
In SURF-MESO,the AWS observations are used during the background analysis step.This results in an improvement of the surface temperature analysis compared to RAD-ONLY(Fig.5c).Nevertheless,signi fi cant di ff erences can still be found in the surface temperature,the southeast in fl ow,the cold-pool out fl ow and the position of the gust front.When AWS observations are assimilated together with radar data in the SURF-4DVAR experiment,the modeled surface temperature and wind fi elds are much closer to the observations(Fig. 5d).The northern and central domain is much colder,while southeastsurfacein fl owismuchwarmerthanthatintheother two experiments.The strength of the cold pool,southeast infl ow,surface out fl ow and the location of the gust front are also close to the AWS observations.
In order to quantitatively compare the analysis between the three experiments and the AWS observations,the gridded surface temperature and wind are interpolated to the AWSlocations.The mean temperature(MTD)and wind(MVD)di ff erences are calculated:
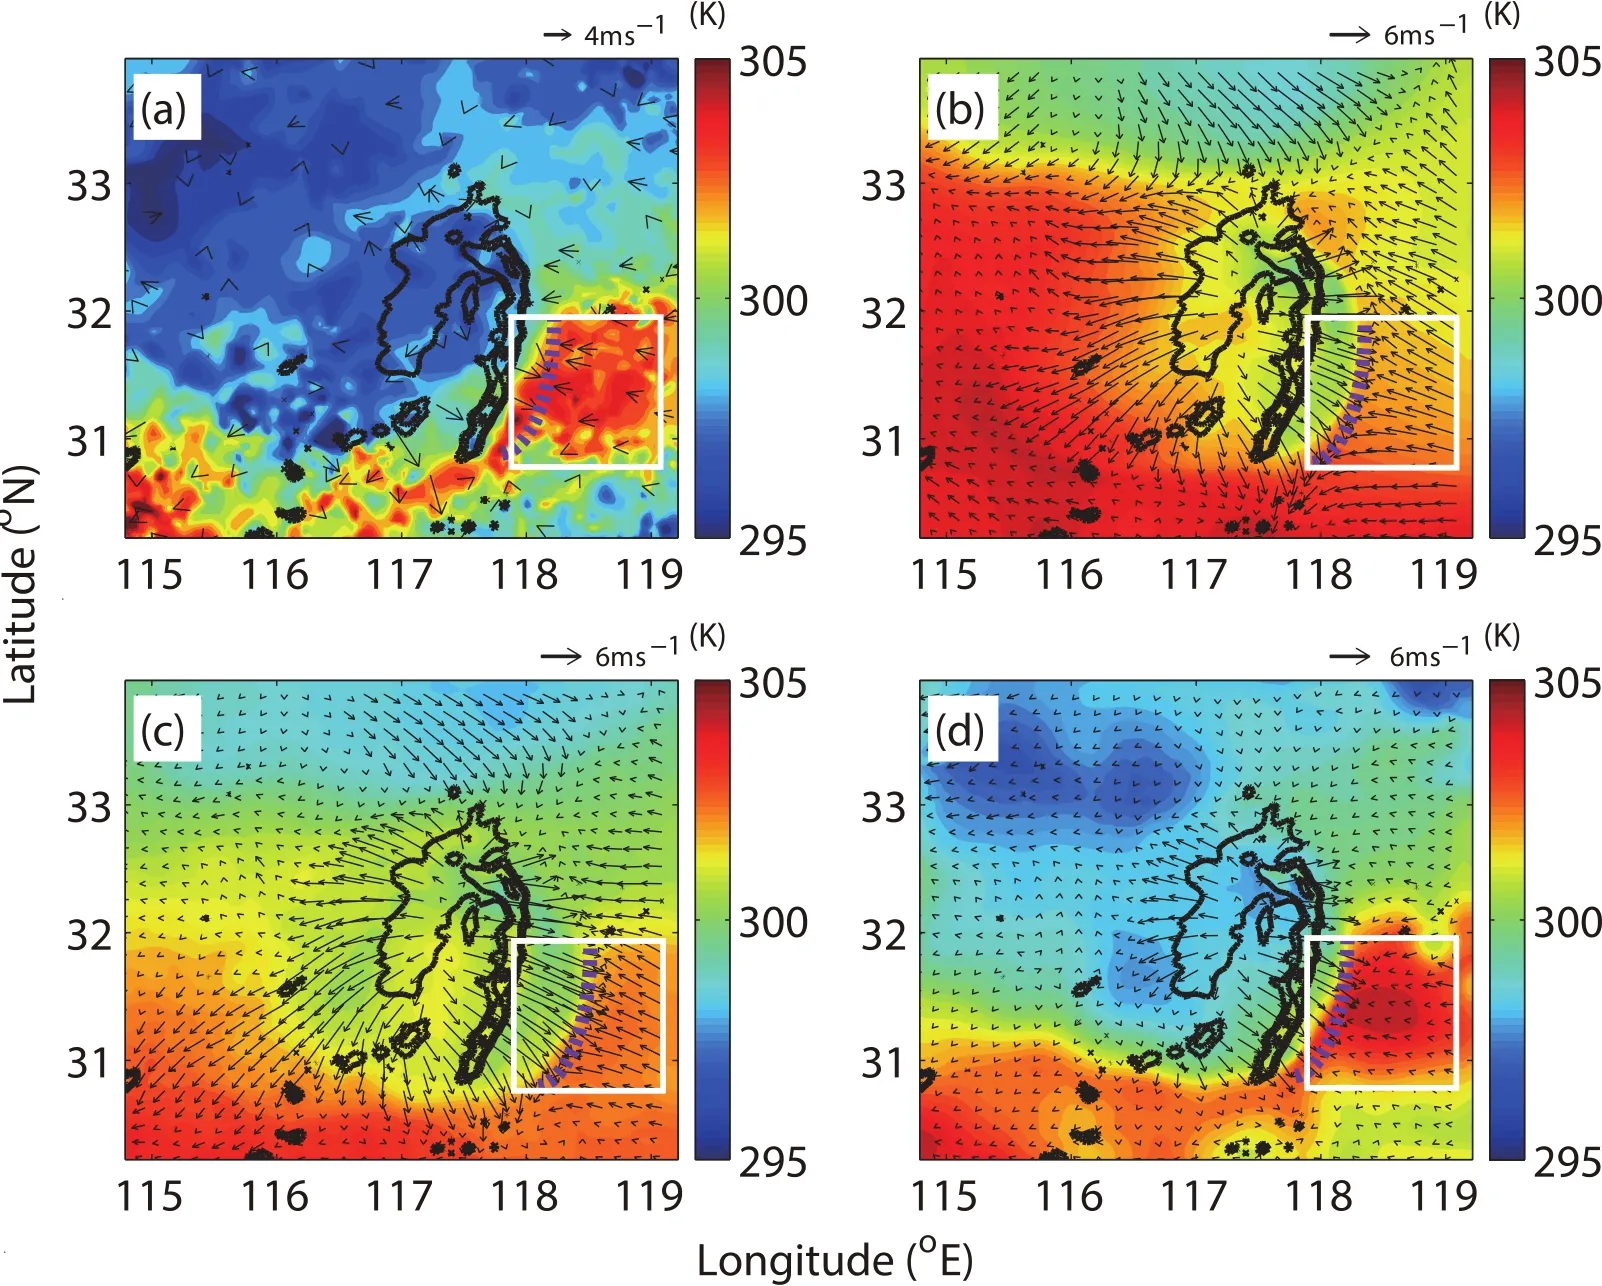
Fig.5.Surface temperature(color-shaded)and wind vectors(black arrows)at 1500 UTC 30 July 2014 from(a)AWS observations,(b)RAD-ONLY,(c)SURF-MESO and(d)SURF-4DVAR.The position of the gust front is shown as a purple dashed line,and the observed composite radar re fl ectivity—starting from 30 dBZand with an interval of 10 dBZ—is superimposed in all sub fi gures as black solid lines.The surface in fl ow region on the east side of the squall line is shown by a white box.

whereNrepresents the number of AWSs.Taws,UawsandVawsstand for the observed surface temperature and winds from each AWS.The extrapolated model surface temperature and winds at the AWS locations are represented byT,UandV.The MTDs at 1500 UTC in RAD-ONLY,SURF-MESO and SURF-4DVAR are 3.49 K,2.38 K and 1.23 K,and the MVDs are 3.91 m s-1,2.52 m s-1and 2.13 m s-1,respectively.Comparison of SURF-MESO with RAD-ONLY suggests that assimilating surface observations can help improve the near-surface fi elds of VDRAS.The further improvement of SURF-4DVAR over SURF-MESO demonstrates the advantages of the newly developed 4DVAR surface data assimilation methodology in comparison with the original methodology.
Two independent AWSs(Nos.58203 and 58326—marked by green dots in Fig.2)are chosen to further examine the improvement of VDRAS analysis using the new methodology in SURF-4DVAR.Station 58203 is located in the northwest.It recorded the surface temperature change duringthe passageofthe fi rstwest—eastoriented squall line at around 0840 UTC.Similarly,station 58326 is chosen for its spatial proximity to the second squall line.In Fig.6a,a dramatic decrease in surface temperature(~13 K)between 0830 and 0930 UTC is found at station 58203 after the passage of the squall line.In RAD-ONLY,the timing of the surface temperaturedropisclosetotheobservations,whiletheamplitude(~4.5 K)is much smaller.For SURF-MESO,the amplitude of the temperature drop is 7.3 K—closer to the observations than RAD-ONLY.The timing of the initial temperature drop,however,is 20 minutes earlier than both the observations and the RAD-ONLY experiment.In SURF-4DVAR,the surface temperature decreases by about 10.3 K—even closer to the observed magnitude.The timing of the event also agrees well with the observations.

Fig.6.Time series of observed and analyzed surface temperature at AWS No.(a)58203 and(b)58326.
In Fig.6b,before the initiation of the second squall line,simulated surface temperatures at station 58326 are close to one another,and in general agree with the observations.Better results are found in SURF-4DVAR over the other two. After the passage of the squall line,surface temperature decreasesinallthreeexperiments.Themagnitudeandtimingof the surface temperature drop in SURF-4DVAR is the closest to the observations among the three.The MTDs of this surface station are 1.82 K,1.42 K and 0.91 K for RAD-ONLY,SURF-MESO and SURF-4DVAR,respectively.The comparisons with the two representative stations again con fi rm the improvement of VDRAS analysis by assimilating surface observations together with radar data.
Besides the improvements of the near-surface fi elds,assimilatingsurfaceobservationsmayalsoimprovetheanalysis results at higher levels through the 4DVAR scheme.To investigate whether the surface data assimilation can improve the VDRAS analysis in the PBL and above,observations from a nearby wind pro fi ler(green square in Fig.2)are compared for further validation.Observed and analyzed vertical profi les ofUandVbelow the 3 km altitude at 1500 UTC are presented in Fig.7.The vertical pro fi les ofUin SURF-MESO and SURF-4DVAR are closer to the observations than those in RAD-ONLY.A slight improvement is achieved in SURF-4DVARinthelowest1kmforU,whileasigni fi cantimprovement is found forV,where the analysis results are closest to the observations.There is little di ff erence between the three experimentsabove1km.TheMVDsbelow3kmarealsocalculated for each experiment,and they are 2.69 m s-1,2.15 m s-1and 1.82 m s-1in RAD-ONLY,SURF-MESO and SURF-4DVAR,respectively.The comparison results show that assimilating surface data through the new 4DVAR scheme can improve the analyzed low-level wind pro fi les in VDRAS,with the most signi fi cant improvement found within the PBL.
5.3. Evaluation of 1-h nowcasts

Fig.7.Vertical pro fi les ofUandVfrom wind pro fi ler observations(black line)and VDRAS analysis at 1500 UTC 30 July 2014.

Fig.8.As Fig.5,but for the 1-h forecasted fi eld at 1600 UTC.
To validate the improvement of the very short-term forecastingskillofVDRASthroughassimilatingthesurfacedata,a 1-h nowcast is launched from each analysis cycle in all three assimilation experiments(RAD-ONLY,SURF-MESO and SURF-4DVAR).Observed surface temperature,surface wind and composite radar re fl ectivity at 1600 UTC are compared with the 1-h nowcast fi elds starting from the analysis at 1500 UTC in Fig.8.Overall,the forecasted re fl ectivity,surface wind and temperature from SURF-4DVAR are the best among three experiments.The one-hour forecasted temperature fi eld in RAD-ONLY at 1600 UTC(Fig.8b)is much warmer than observed for most parts of the domain,just as the analyzed surface fi eld is at 1500 UTC(Fig.5b).The coldpool is too weak and the surface out fl ow on the west side of this squall line is too strong.In SURF-MESO,the surface temperature is closer to the AWS observations than the RADONLY forecast(Fig.8c),but the cold pool is still too weak and the out fl ow is again too strong.Compared with the other two experiments,the 1-h forecasted surface fi elds in SURF-4DVAR are much closer to the observations(Fig.8d).The northern and central parts of the OPACC domain are colder than the southern domain,the cold pool is stronger,the surface out fl ow is weaker,and the surface in fl ow on the east side of the squall line is warmer.The position of the gust front ahead of the squall line is also close to the AWS observations.Quantitatively,the MTDs of the RAD-ONLY,SURFMESO and SURF-4DVAR experiments are 4.44 K,2.48 K and 1.26 K,and the MVDs are 4.09 m s-1,2.42 m s-1and 2.29 m s-1,respectively.All these results indicate improved forecast ability with the additional assimilation of the surface observations in VDRAS.It is noteworthy that the cold pool for the squall line(Fig.8a)remains close to the leading edge of the convection in the observations at 1600 UTC,while it appears to surge quickly outward in the 1-h forecasts of the three experiments.This disagreement may be induced by the lack of PBL processes in VDRAS,which can result in a stronger cold pool in the 1-h forecast.
Comparing the temperature time series of the observations at the two AWS stations(Figs.9a and b)with that of multiple 1-h forecasts from the continuous analyses for the three experiments,SURF-4DVAR performs much better at capturing the surface temperature drop after the passage of the two squall lines.The MTDs of station 58203(58326)are 5.61 K(2.2 K),3.96 K(1.81 K)and 1.49 K(1.45 K)in RAD-ONLY,SURF-MESO and SURF-4DVAR respectively. Figure 10 compares the observed and forecasted vertical profi les of U and V at 1600 UTC.Both the U and V components from SURF-4DVAR agree better with the wind pro fi ler observations than the rest.The primary improvement is found again in the PBL below 1 km—similar to the analysis results in Fig.7.The MVDs below 3 km are 5.35 m s-1,4.46 m s-1and 3.46 m s-1for RAD-ONLY,SURF-MESO and SURF-4DVAR,respectively.These validation results show that assimilating surface data together with radar observations not only improves the representation of the surface winds and temperature,but also the low-level dynamic and thermodynamic fi elds,especially within the PBL.
Compared with the temperature and wind fi elds,the 1-h forecast of the precipitation is not as signi fi cantly improved by the surface data assimilation.Quantitatively,the RMSE of compositeradarre fl ectivityis11.11dBZ inSURF-4DVAR—slightly smaller than the 11.39 dBZ and 11.35 dBZ in RADONLY and SURF-MESO for the 1-h nowcast from 1500UTC.The di ff erences between these forecasts are not signi ficant.The reasons for the small di ff erences need to be further investigated.

Fig.9.As in Fig.6,but for the observed and 1-h forecasted surface temperature.

Fig.10.As in Fig.7,but for the observed and 1-h forecasted wind pro fi les at 1600 UTC.
6. Summary and discussion
This paper explores the e ff ect of using an improved surface observation assimilation scheme on the analysis and nowcasting ability of VDRAS.Di ff erent from the original version,wheresurfacetemperatureandwindobservationsare mainly integrated into the model background using a simple interpolation scheme,the current method can assimilate high spatial and temporal resolution surface observations together with the radar re fl ectivity and radial velocity in the 4DVAR scheme.Surface observations are interpolated to the model bottom level and assimilated every 5 min.The objective of this study was to show whether the new scheme,through minimizing the cost function with the additional surface observation terms in the 4DVAR-based VDRAS,can obtain better low-level dynamic and thermodynamic analysis.The squall-line case of 30 July 2014,observed during IOP 10 of the OPACC fi eld campaign,is used to demonstrate the performance of the new scheme.A fi rst set of experiments assimilates observations from a single AWS station. Results show that the surface-based divergence,cold pool and out fl ow of the squall line are all strengthened towards the observed values.Some improvements are exhibited in the vertical pro fi les of wind,mostly within the PBL.A second set of three experiments(RAD-ONLY:only radar observations are assimilated;SURF-MESO:radar observations are assimilated with surface data blended with the WRF background;and SURF-4DVAR:radar and surface observations are assimilated together)is conducted to examine the impact of the surface data assimilation on the analysis and forecast of VDRAS.Among the three experiments,the analyzed surface temperature and wind in SURF-4DVAR show the best agreement with the AWS observations.The low-level wind pro fi les,especially those within the PBL,are also improved upon surface data assimilation.Similar improvements within the PBL are found in the 1-h forecast starting from the analysis fi elds.
The current study reveals the potential bene fi ts of assimilating surface data in a convection-permitting model in addition to radar data assimilation.Assimilating surface data can fi ll in the near-surface observational gap of radar data and improve the representation of near-surface and PBL conditions,which are essential for accurate analysis and forecasting of convective systems.Needless to say,more case studies are still needed to con fi rm the impact of the surface data assimilation,especially on the precipitation forecast.The idea presented in this study will be applied to mesoscale data assimilation systems,such as WRF data assimilation systems,in the future,to evaluate the applicability of the 4DVAR assimilation combining surface and radar observations to other systems.
Acknowledgements.This research was primarily supported by the National Fundamental Research 973 Program of China(GrantNo.2013CB430101),theNationalNaturalScience Foundation of China(Grant Nos.41275031,41322032 and 41475015),the Social Commonwealth Research Program(Grant Nos.GYHY201506004 and GYHY201006007),and the Program for New Century Excellent Talents in Universities of China.The author Xingchao CHEN thanks NCAR for hosting his visit,and the graduate school administration in Nanjing University for supporting his visit.
Open Access.This article is distributed under the terms of the Creative Commons Attribution 4.0 International License(http://creativecommons.org/licenses/by/4.0/),which permits unrestricted use,distribution,and reproduction in any medium,provided you give appropriate credit to the original author(s)and the source,provide a link to the Creative Commons license,and indicate if changes were made.
REFERENCES
Barnes,S.L.,1964:A technique for maximizing details in numerical weather map analysis.J.Appl.Meteor.,3,396—409.
Bryan,G.H.,J.C.Knievel,and M.D.Parker,2006:A multimodel assessment of RKW theory’s relevance to squall-line characteristics.Mon.Wea.Rev.,134,2772—2792.
Chang,S.-F.,Y.-C.Liou,J.-Z.Sun,and S.-L.Tai,2015:The implementation of the ice-phase microphysical process into a four-dimensional Variational Doppler Radar Analysis System(VDRAS)and its impact on parameter retrieval and quantitative precipitation nowcasting.J.Atmos.Sci.,73,1015—1038.
Crook,N.A.,and J.Z.Sun,2004:Analysis and forecasting of the low-level wind during the Sydney 2000 forecast demonstration project.Wea.Forecasting,19,151—167.
Dawson,D.T.,and M.Xue,2006:Numerical forecasts of the 15—16 June 2002 Southern Plains mesoscale convective system: impact of mesoscale data and cloud analysis.Mon.Wea.Rev.,134,1607—1629.
Dong,J.L.,M.Xue,and K.Droegemeier,2011:The analysis and impact of simulated high-resolution surface observations in addition to radar data for convective storms with an ensemble Kalman fi lter.Meteorol.Atmos.Phys.,112,41—61.
Hayden,C.M.,and R.J.Purser,1995:Recursive fi lter objective analysis of meteorological fi elds:Applications to NESDIS operational processing.J.Appl.Meteor.,34,3—15.
Hou,T.J.,F.Y.Kong,X.L.Chen,and H.C.Lei,2013:Impact of 3DVAR data assimilation on the prediction of heavy rainfall over Southern China.Advances in Meteorology,Article ID 129642,http://dx.doi.org/10.1155/2013/129642.
Hsu,S.A.,E.A.Meindl,and D.B.Gilhousen,1994:Determining the power-law wind-pro fi le exponent under near-neutral stability conditions at sea.J.Appl.Meteor.,33,757—765.
Kalnay,E.,H.Li,T.Miyoshi,S.-C.Yang,and J.Ballabrera-Poy,2007:4-D-Var or ensemble Kalman fi lter?Tellus A,59,758—773.
Klazura,G.E.,and D.A.Imy,1993:A description of the initial set of analysis products available from the NEXRAD WSR-88D system.Bull.Amer.Meteor.Soc.,74,1293—1311.
Lilly,D.K.,1990:Numerical prediction of thunderstorms—has its time come?Quart.J.Roy.Meteor.Soc.,116,779—798.
Lima,M.A.,and J.W.Wilson,2008:Convective storm initiation in a moist tropical environment.Mon.Wea.Rev.,136,1847—1864.
Marquis,J.,Y.Richardson,P.Markowski,D.Dowell,J.Wurman,K.Kosiba,P.Robinson,and G.Romine,2014:An investigation of the Goshen county,Wyoming,tornadic supercell of 5 June 2009 using EnKF assimilation of mobile mesonet and radar observations collected during VORTEX2.Part I:Experiment design and veri fi cation of the EnKF analyses.Mon. Wea.Rev.,142,530—554.
Morrison,H.,G.Thompson,and V.Tatarskii,2009:Impact of cloud microphysics on the development of trailing stratiform precipitation in a simulated squall line:Comparison of oneand two-moment schemes.Mon.Wea.Rev.,137,991—1007.
Parker,M.D.,2010:Relationship between system slope and updraft intensity in squall lines.Mon.Wea.Rev.,138,3572—3578.
Peterson,E.W.,and J.P.Hennessey Jr.,1978:On the use of power laws for estimates of wind power potential.J.Appl.Meteor.,17,390—394.
Pleim,J.E.,2007:A combined local and nonlocal closure model for the atmospheric boundary layer.Part II:Application and evaluation in a mesoscale meteorological model.Journal of Applied Meteorology and Climatology,46,1396—1409.
Pu,Z.X.,H.L.Zhang,and J.Anderson,2013:Ensemble Kalman fi lter assimilation of near-surface observations over complex terrain:Comparison with 3DVAR for short-range forecasts.Tellus A,65,19620.
Putnam,B.J.,M.Xue,Y.Jung,N.Snook,and G.F.Zhang,2014: The analysis and prediction of microphysical states and polarimetric radar variables in a mesoscale convective system using double-moment microphysics,multinetwork radar data,and the ensemble Kalman fi lter.Mon.Wea.Rev.,142,141—162.
Rotunno,R.,J.B.Klemp,and M.L.Weisman,1988:A theory for strong,long-lived squall lines.J.Atmos.Sci.,45,463—485.
Schenkman,A.D.,M.Xue,A.Shapiro,K.Brewster,and J.D. Gao,2011a:The analysis and prediction of the 8—9 May 2007 Oklahoma tornadic mesoscale Convective system by assimilating WSR-88D and CASA radar data using 3DVAR.Mon. Wea.Rev.,139,224—246.
Schenkman,A.D.,M.Xue,A.Shapiro,K.Brewster,and J.D. Gao,2011b:Impact of CASA radar and Oklahoma mesonet data assimilation on the analysis and prediction of tornadic mesovortices in an MCS.Mon.Wea.Rev.,139,3422—3445.
Snook,N.,M.Xue,and Y.Jung,2015:Multiscale EnKF assimilation of radar and conventional observations and ensemble forecasting for a tornadic mesoscale convective system.Mon. Wea.Rev.,143,1035—1057.
Sobash,R.A.,and D.J.Stensrud,2015:Assimilating surface mesonet observations with the EnKF to improve ensemble forecasts of convection initiation on 29 May 2012.Mon.Wea. Rev.,143,3700—3725.
Sun,J.Z.,and N.A.Crook,1997:Dynamical and microphysical retrievalfromDopplerradarobservationsusingacloudmodel and its adjoint.Part I:Model development and simulated data experiments.J.Atmos.Sci.,54,1642—1661.
Sun,J.Z.,and N.A.Crook,1998:Dynamical and microphysical retrievalfromDopplerradarobservationsusingacloudmodel and its adjoint.Part II:Retrieval experiments of an observed Florida convective storm.J.Atmos.Sci.,55,835—852.
Sun,J.Z.,and N.A.Crook,2001:Real-time low-level wind andtemperature analysis using single WSR-88D data.Wea.Forecasting,16,117—132.
Sun,J.Z.,and Y.Zhang,2008:Analysis and prediction of a squall line observed during IHOP using multiple WSR-88D observations.Mon.Wea.Rev.,136,2364—2388.
Sun,J.Z.,D.W.Flicker,and D.K.Lilly,1991:Recovery of three-dimensional wind and temperature fi elds from simulated single-Doppler radar data.J.Atmos.Sci.,48,876—890.
Sun,J.Z.,M.X.Chen,andY.C.Wang,2010:Afrequent-updating analysis system based on radar,surface,and mesoscale model data for the Beijing 2008 forecast demonstration project.Wea. Forecasting,25,1715—1735.
Tai,S.-L.,Y.-C.Liou,J.-Z.Sun,S.-F.Chang,and M.-C.Kuo,2011:Precipitation forecasting using Doppler radar data,a cloud model with adjoint,and the weather research and forecasting model:Real case studies during SoWMEX in Taiwan.Wea.Forecasting,26,975—992.
Tompkins,A.M.,2001:Organization of tropical convection in low verticalwindshears:Theroleofcoldpools.J.Atmos.Sci.,58,1650—1672.
Weisman,M.L.,J.B.Klemp,and R.Rotunno,1988:Structure and evolution of numerically simulated squall lines.J.Atmos. Sci.,45,1990—2013.
Weygandt,S.S.,A.Shapiro,and K.K.Droegemeier,2002a:Retrieval of model initial fi elds from single-Doppler observations of a supercell thunderstorm.Part II:Thermodynamic retrieval and numerical prediction.Mon.Wea.Rev.,130,454—476.
Weygandt,S.S.,A.Shapiro,and K.K.Droegemeier,2002b:Retrieval of model initial fi elds from single-Doppler observations of a supercell thunderstorm.Part I:Single-Doppler velocity retrieval.Mon.Wea.Rev.,130,433—453.
Yussouf,N.,Dowell,D.C.,Wicker,L.J.,Knopfmeier,K.H.,& Wheatley,D.M.,2015:Storm-scale data assimilation and ensemble forecasts for the 27 April 2011 severe weather outbreak in Alabama.Mon.Wea.Rev.,143(8),3044—3066.
Zhang,F.Q.,C.Snyder,and J.Z.Sun,2004:Impacts of initial estimate and observation availability on convective-scale data assimilation with an ensemble Kalman fi lter.Mon.Wea.Rev.,132,1238—1253.
:Chen,X.C.,K.Zhao,J.Z.Sun,B.W.Zhou,and W.-C.Lee,2016:Assimilating surface observations in a fourdimensional variational Doppler radar data assimilation system to improve the analysis and forecast of a squall line case.Adv. Atmos.Sci.,33(10),1106—1119,
10.1007/s00376-016-5290-0.
*Corresponding author:Kun ZHAO
Email:zhaokun@nju.edu.cn
杂志排行

Advances in Atmospheric Sciences的其它文章
- Parameterization of Sheared Entrainment in a Well-Developed CBL.Part I: Evaluation of the Scheme through Large-Eddy Simulations
- Convective Initiation by Topographically Induced Convergence Forcing over the Dabie Mountains on 24 June 2010
- Precipitation Responses to Radiative E ff ects of Ice Clouds:A Cloud-Resolving Modeling Study of a Pre-Summer Torrential Precipitation Event
- Evaluation of Two Momentum Control Variable Schemes and Their Impact on the Variational Assimilation of Radar Wind Data: Case Study of a Squall Line
- Variational Assimilation of Satellite Cloud Water/Ice Path and Microphysics Scheme Sensitivity to the Assimilation of a Rainfall Case
- The E ff ects of Land Surface Process Perturbations in a Global Ensemble Forecast System