出口边界条件和壁厚对冠状动脉壁面剪切力和冯米塞斯应力的影响
2016-02-24徐创业刘修健吴广辉何玉娜舒丽霞蔺嫦燕
徐创业 刘修健 吴广辉 何玉娜 舒丽霞 蔺嫦燕#*
1(首都医科大学附属北京安贞医院,北京 100029)2(北京市心肺血管疾病研究所,北京 100029)
出口边界条件和壁厚对冠状动脉壁面剪切力和冯米塞斯应力的影响
徐创业1,2刘修健1,2吴广辉1,2何玉娜1,2舒丽霞1,2蔺嫦燕1,2#*
1(首都医科大学附属北京安贞医院,北京 100029)2(北京市心肺血管疾病研究所,北京 100029)
探讨基于个体化患者计算机断层血管造影(CTA)影像的冠状动脉流固耦合(FSI)数值分析中,不同出口边界条件和血管壁模型对时间平均壁面剪切力(TAWSS)和冯米塞斯应力(VMS)的影响。根据患者CTA影像重建右冠状动脉(RCA)管腔流域三维几何;将管腔流域表面向外扩张0.5 mm,形成均匀厚度血管壁;运用类似虚拟去除斑块的方法建立不均匀厚度血管壁模型。FSI分析时,分别给予zero和impedance两种出口边界条件;获得从舒张末期开始心动周期主要时间点TAWSS和VMS的分布,比较不同模型结果的差异。结果表明, 两种出口边界条件下,TAWSS空间分布基本一致,且血管狭窄段均高于其他部位;zero条件下峰值VMS出现在压强最大时刻点0.42 s,而impedance条件下峰值VMS出现在入口血流速度最大时刻点0.64 s,并且达到前者的20倍。同是impedance出口边界条件时,TAWSS分布基本一致,没有显著性差异;两种血管壁模型中,VMS的分布一致,血管狭窄段比其他部位低,但是不均匀厚度血管壁模型中局部位置VMS绝对值高于均匀壁厚血管壁模型。医学影像技术的发展可以提供更高精度的冠脉结构以及出入口速度和压强边界条件,不但对研究血流动力学以及结构力学因素与心血管疾病的关系具有重要意义,也可以更好的服务于患者个体化诊断与治疗。
冠状动脉;流固耦合;边界条件;时间平均壁面剪切力;冯米塞斯应力
引言
临床资料表明,冠状动脉粥样硬化斑块易发于血管的弯曲及分叉等部位[1]。这一现象提示,除系统性危险因素外,血管局部的生物力学环境对斑块的起始、发展甚至破裂都有重要影响,并且在多项研究[2-7]中得到了证实。因此,获取血管的生物力学参数并分析其与病变的相关性具有重要意义。医学影像能够提供个体化患者血管的体积信息,流固耦合(fluid structure interaction,FSI)仿真分析则可以提供血流动力学和结构力学参数的时间和空间上的三维描述,二者结合已经成为研究心血管生物力学以及对血管病生理影响的一种重要方法[8-9]。个体化建模与仿真则可以为心血管病个体化诊断与治疗服务。冠状动脉高分辨率三维几何结构、准确的计算离散域、血液和血管的生物流变特性[10-11]、合理的边界条件[12-13]等因素决定了仿真结果的准确性与可靠性。目前多数研究采用刚性壁模型,关注边界条件对WSS等流体力学参数的影响,涉及结构力学参数较少。本研究拟基于个体化患者计算机断层血管造影(computed tomography angiography,CTA)影像来建立真实血管FSI模型,探讨出口边界条件及壁厚对冠状动脉生物力学参数的影响。
1 方法
1.1 患者信息及CTA影像获取
选择1例49岁男性急性冠脉综合征患者,无植入支架及冠状动脉旁路移植术,无心律不齐、肾衰竭等症状。冠状动脉 CTA 检查采用东芝320 排 CT(Aquilion One,日本),扫描时相是舒张末期。CTA 影像显示RCA局部血管段中度狭窄。本研究通过了北京安贞医院伦理审批委员会的审批,患者签署了知情同意书。
1.2 均匀壁厚和非均匀壁厚血管壁模型3D重建
根据患者冠状动脉CTA影像,通过开源软件VMTK建立RCA管腔流域表面(见图1(a)),并适当延长各个开口,以保证血流充分发展。在管腔流域基础上向外扩张0.5 mm形成均匀壁厚血管壁模型。根据血管狭窄段近远端直径,采用手动虚拟去除斑块的方法[14],建立不均匀壁厚血管壁模型(见图1(b))。
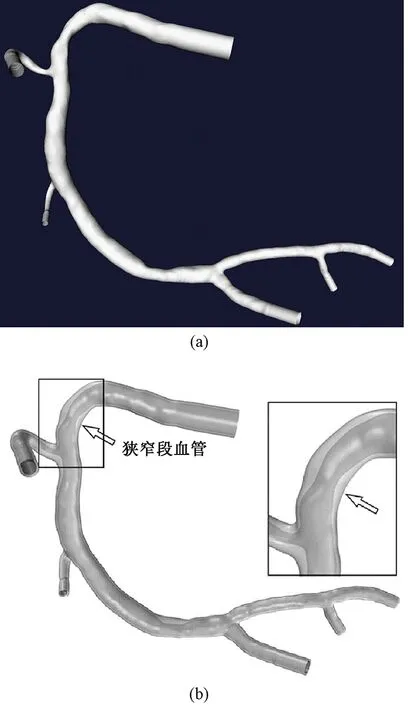
图1 模型三维几何结构。(a)RCA管腔流域表面;(b)非均匀壁厚血管壁(箭头指狭窄段血管)Fig.1 The 3D geometry of models. (a)RCA luminal surface; (b)Non-uniform vessel wall (Arrows indicate the vessel in stenosis)
1.3 血管壁和流体域网格划分
均匀壁厚和非均匀壁厚血管均采用不带中心节点的四面体网格,管腔流域采用带中心节点的四面体网格,网格化后的模型分别如图2(a)、图2(b)和图3所示。根据网格敏感性分析(粗糙和精细网格最大总位移差异<2%),不同计算域网格单元和节点数量如表1所示。
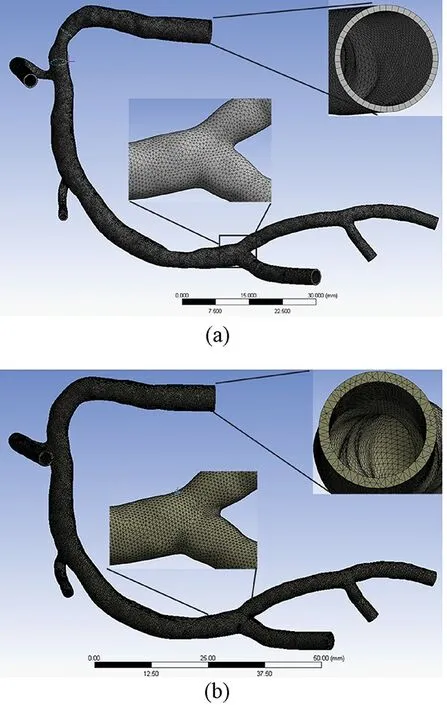
图2 血管壁网格划分。(a)均匀壁厚血管;(b)非均匀壁厚血管Fig.2 Mesh of vessel. (a)Uniform vessel; (b)Non-uniform vessel
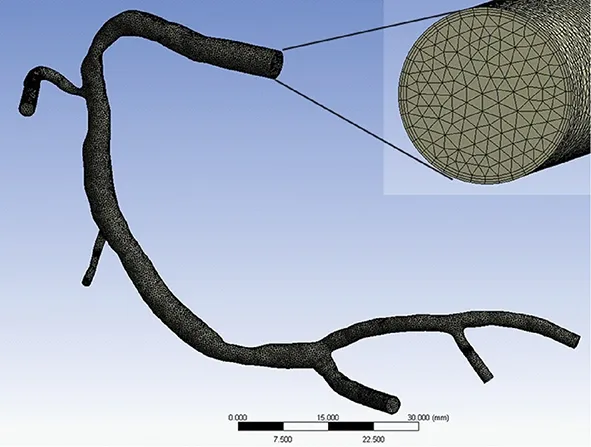
图3 管腔流域网格Fig.3 Mesh of luminal domain
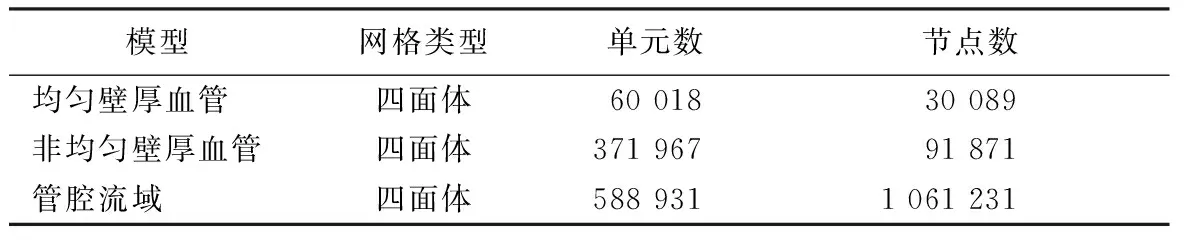
表1 不同计算域网格类型和数量
1.4 材料属性及边界条件
将血管壁假设为各向同性的线弹性材料,密度为1 150 kg/m3,弹性模量为5×105Pa,泊松比为0.45。对血管壁的入口和出口给予固定约束条件。
将血液假设为不可压缩的牛顿流体,密度为1 050 kg/m3,黏度为0.003 5 Pa·s。
采用文献 [15-16] 中的典型流量或压强曲线作为边界条件。将血管入口剖面的速度假设为均匀分布,入口速度随时间的变化曲线如图4(a)所示。Zero出口边界条件将RCA模型中各出口压强设置为0 Pa,而impedance出口边界条件则充分考虑计算域外循环系统对模型的影响,压强曲线随时间变化,如图4(b)所示。所有出口均赋予统一边界条件[17],并设置为Opening模式,允许计算时有返流存在。假设血液和血管壁面之间无相对滑移,不考虑重力和热量传输,外界参考压强设置为101.325 kPa。将稳态模拟结果作为瞬态分析的初始条件。
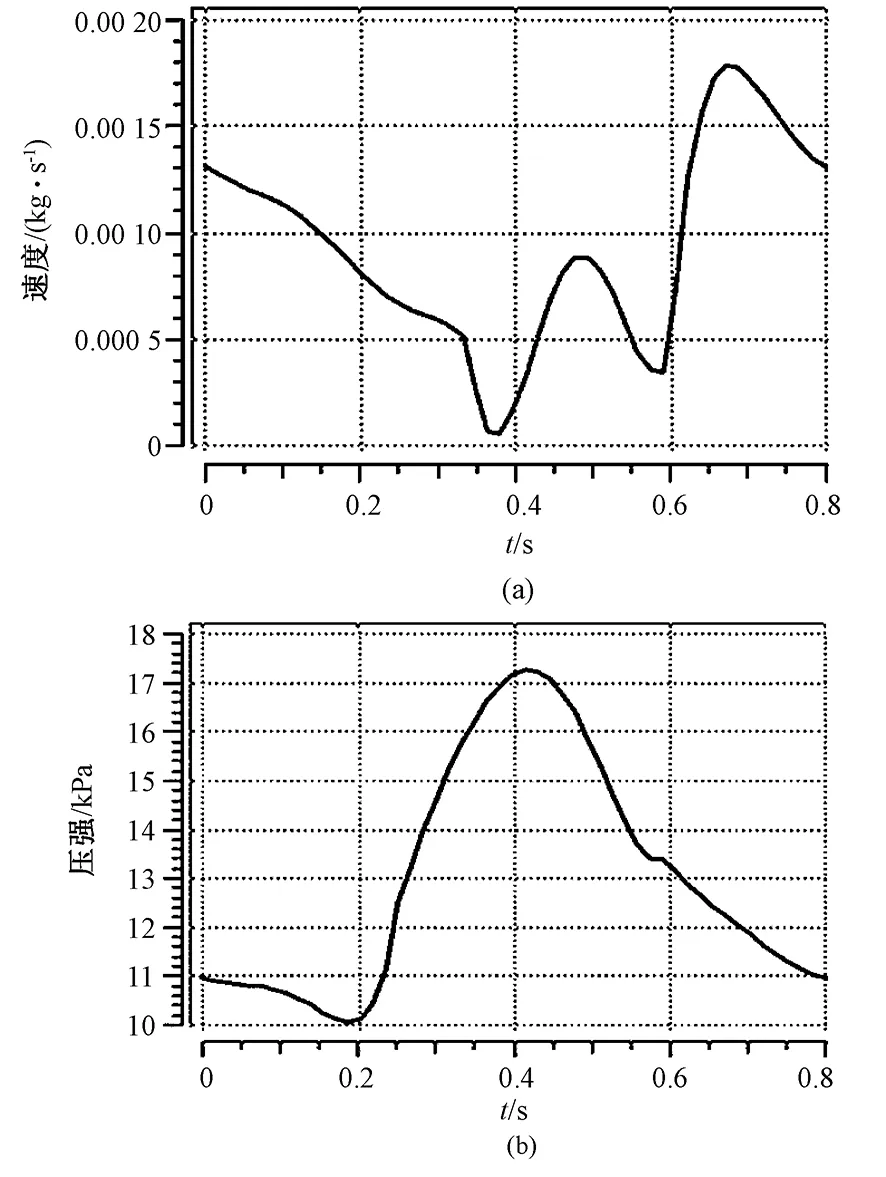
图4 模型出入口、出口边界条件。(a)入口速度曲线;(b)出口压强曲线Fig.4 Inlet and outlet boundary conditions. (a)Curve of inlet velocity; (b)Curve of outlet pressure
1.5 FSI求解及后处理
划分网格之后,将计算模型导入ANSYS 15.0。一个计算周期为0.8 s,时间步长设置为0.02 s。耦合计算时结构和流体部分的最大迭代次数均设置为50,耦合计算传递物理量收敛目标为最大残差值10-4。为得到稳定的收敛解,所有分析均进行两个周期的迭代运算。根据第2个心动周期得到的计算结果来分析冠状动脉内的血流动力学和结构力学参数分布状况。时间平均壁面剪切力(time-averaged wall shear stress,TAWSS)用来表征一个心脏周期内血流施加在血管壁面上的总的剪切力,相对于具体时刻的个值来说,更能反应剪切力的累积效应,而冯米塞斯应力(von Mises stress,VMS)则代表感兴趣区域内部平均应力水平,在斑块发展和破裂过程中起到非常重要的作用。因此,将TAWSS和VMS作为主要的参数指标。
2 结果
2.1 出口边界条件对TAWSS和VMS的影响
在均匀厚度血管壁模型基础上讨论出口边界条件对冠状动脉内生物力学参数的影响。
一个心动周期内TAWSS的分布云图如图5所示,两种边界条件下TAWSS三维空间分布情况基本一致,并且在血管狭窄处TAWSS值明显高于其他血管段。
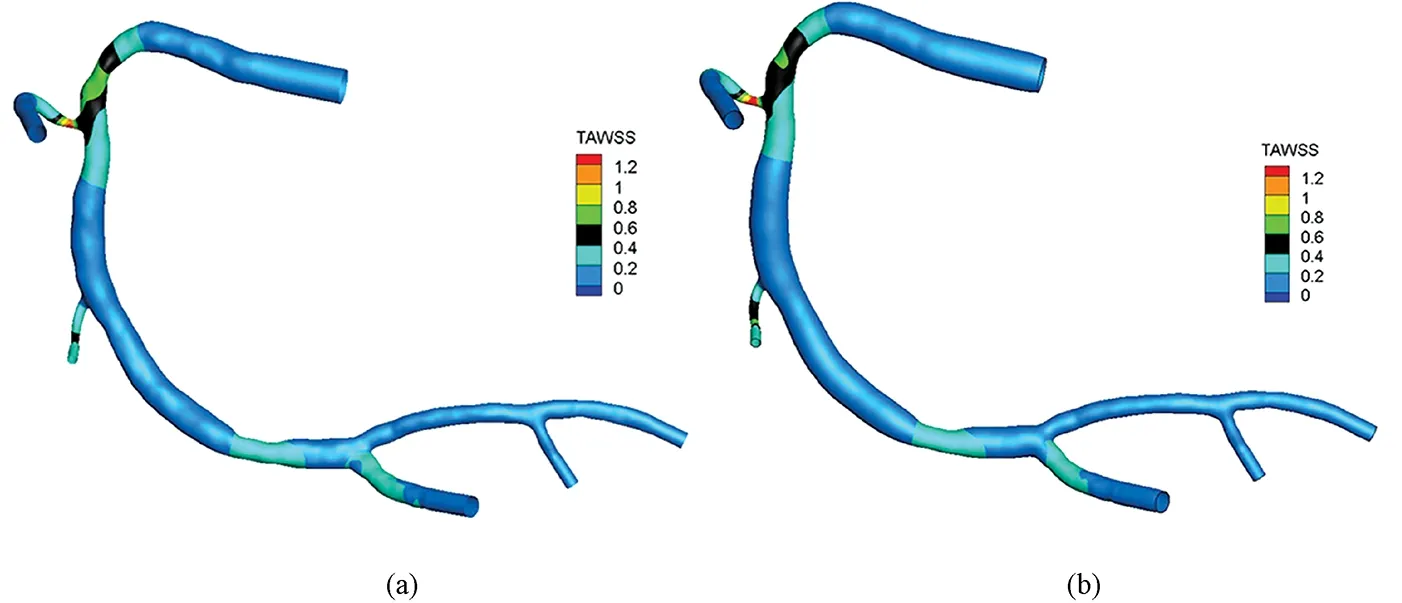
图5 不同出口边界条件下TAWSS分布云图。(a)Zero出口边界条件;(b)Impedance出口边界条件Fig.5 TAWSS distribution with different outlet boundary conditions. (a)Zero outlet boundary condition; (b)Impedance outlet boundary condition
一个心动周期内不同出口边界条件下冠状动脉FSI交界面上VMS的分布云图如图6所示。从图中看到不同出口边界条件对VMS的影响非常大:首先,当出口边界条件为zero时,峰值VMS出现在入口血流速度最大时刻点0.64 s,而当出口边界条件为impedance时,峰值VMS出现在压强最大时刻点0.42 s,并且是前者的20倍以上。
2.2 不同厚度血管壁模型对TAWSS和VMS的影响
在impedance出口边界条件下探讨不同厚度血管壁模型冠状动脉内各生物力学参数的影响。
两种壁厚模型中TAWSS的分布云图如图7所示,空间三维分布基本一致,受血管壁厚度影响较小,并且血管狭窄段的值明显高于其他血管段。
两种壁厚模型时VMS的分布云图如图8所示。选择0.10、0.42、0.64 s这3个时刻点进行分析。首先,两种壁厚模型中峰值VMS均出现在在出口压强最大0.42 s时刻;其次,在两种壁厚模型中,VMS的分布云图整体表现基本一致,血管狭窄部位的VMS值稍低;最后,在血管的局部位置,特别是血管狭窄部位,均匀壁厚模型VMS值相对更低,不均匀壁厚模型(狭窄部位壁厚大于血管其他部位)的VMS值则略高。
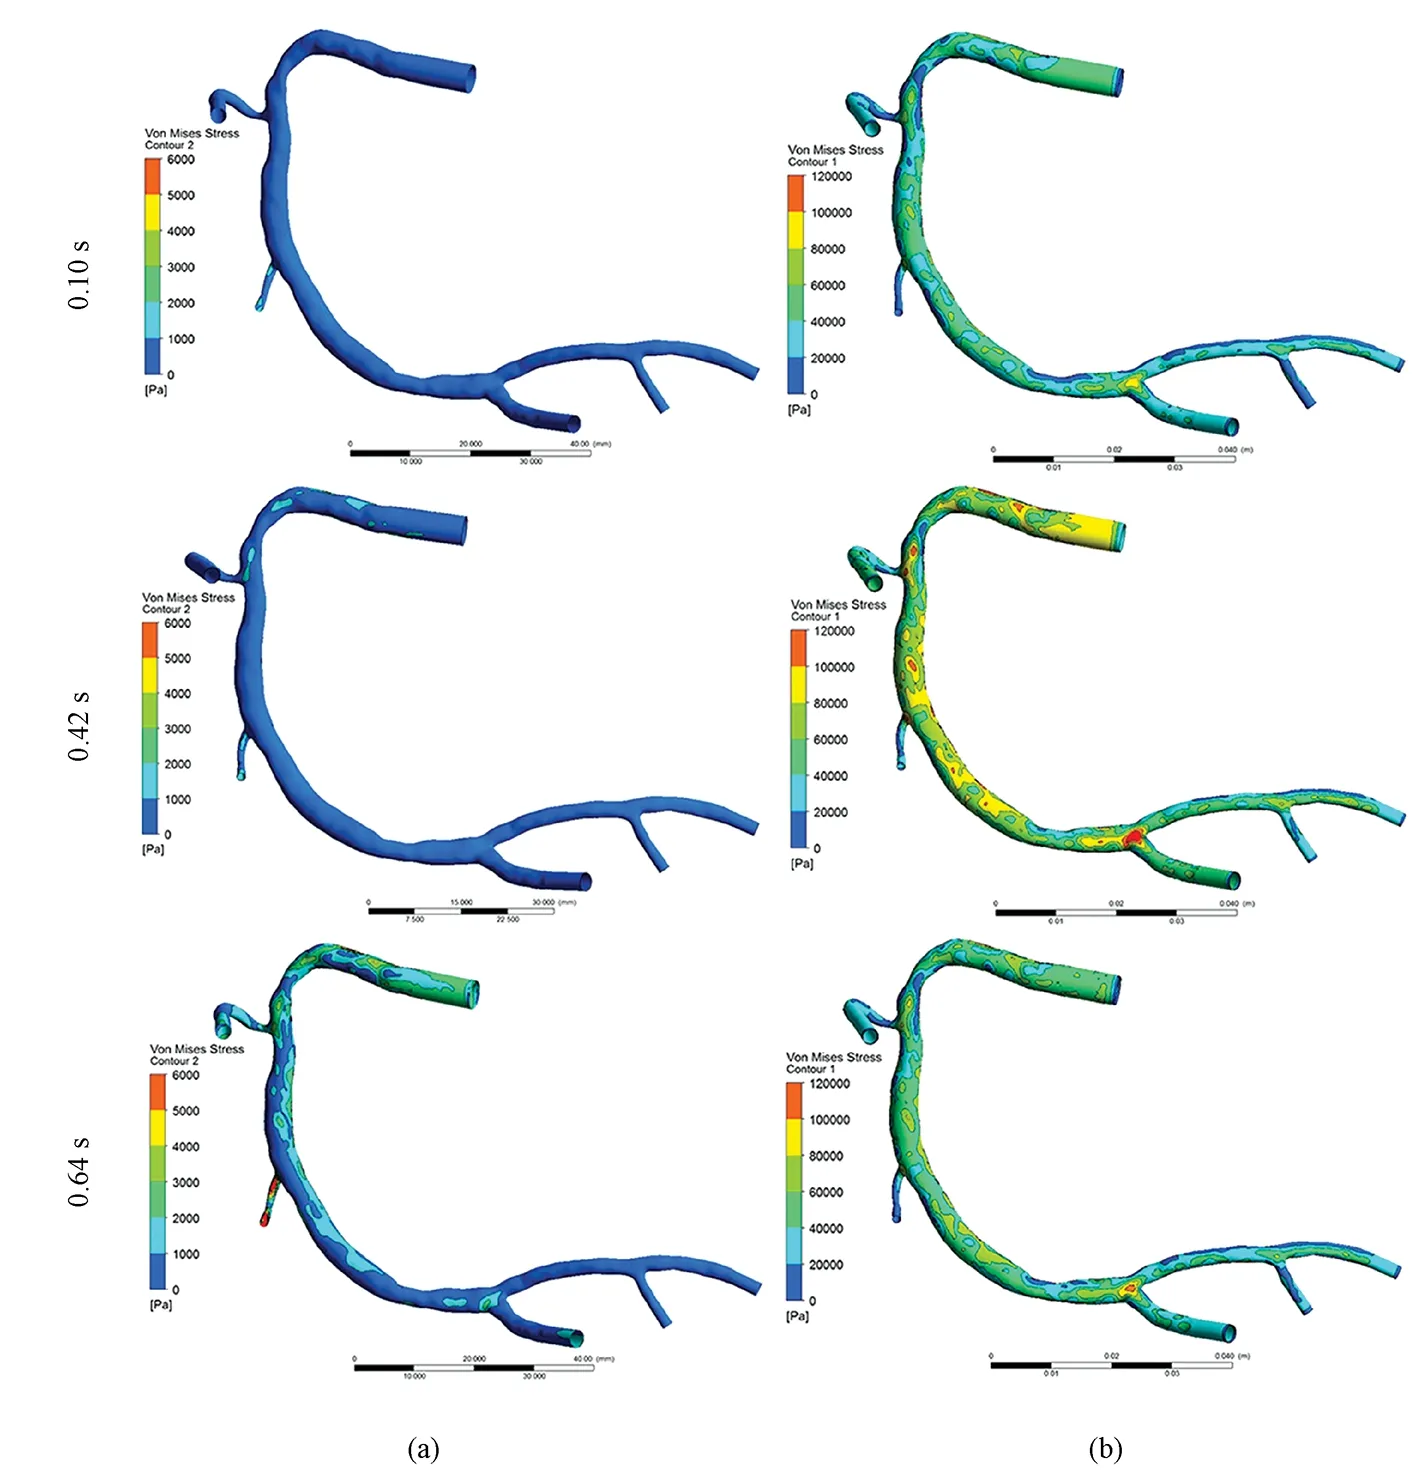
图6 不同出口边界条件下VMS分布云图。(a)Zero出口边界条件;(b)Impedance出口边界条件Fig.6 VMS distribution with different outlet boundary conditions. (a)Zero outlet boundary condition; (b)Impedance outlet boundary condition
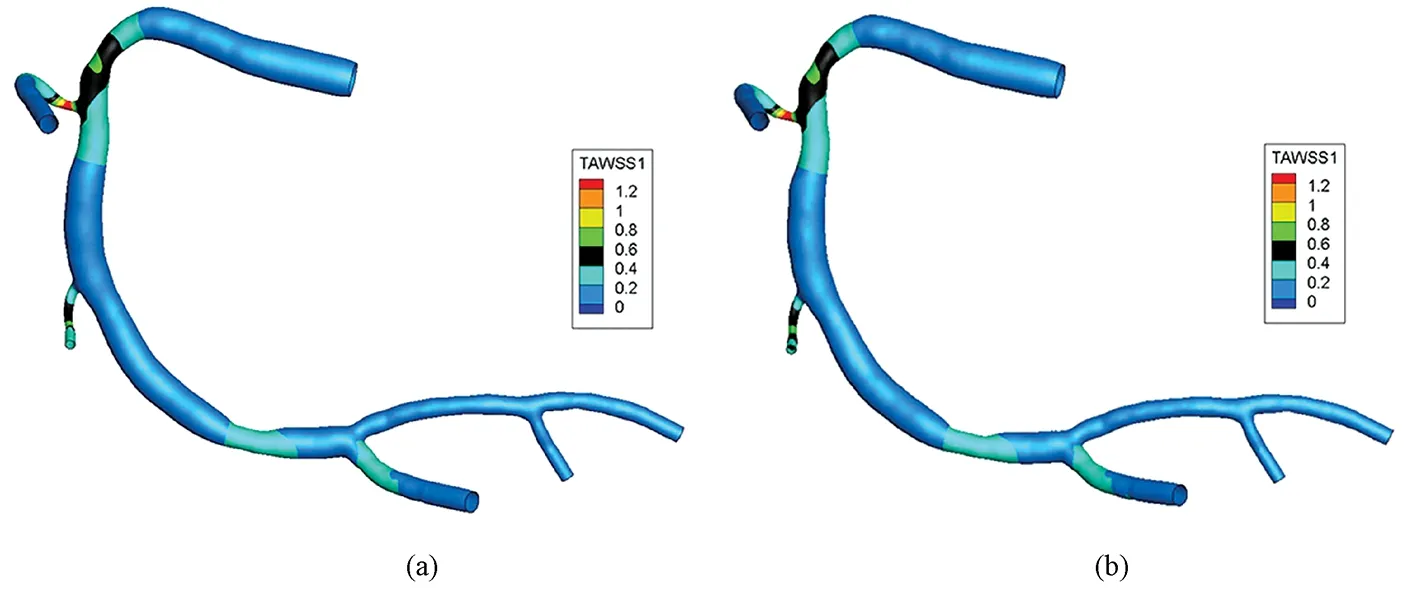
图7 不同壁厚模型TAWSS分布云图。(a)均匀壁厚血管;(b)非均匀壁厚血管Fig.7 TAWSS distribution of different thickness vessels. (a)Uniform thickness vessel; (b)Non-uniform vessel
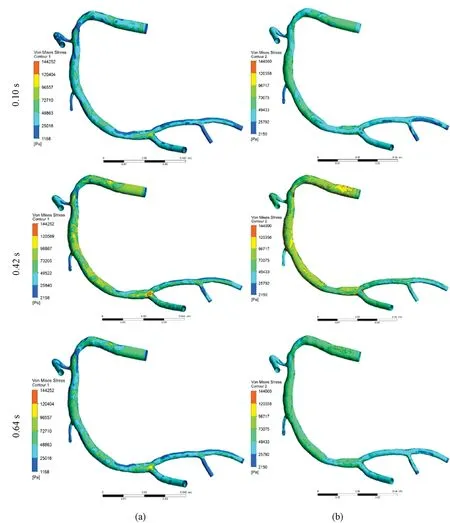
图8 不同壁厚模型VMS分布云图。(a)均匀壁厚血管;(b)非均匀壁厚血管Fig.8 VMS distribution of different thickness vessels. (a)Uniform thickness vessel; (b)Non-uniform vessel
3 讨论
医学影像技术的发展可以提供更精细的血管三维结构,而仿真技术的改进优化能够促进向临床研究的转化,二者融合为研究冠状动脉狭窄提供了一种新的方法,并在一定程度上揭示了狭窄病变的发病机理。
边界条件指计算域的边界,也代表计算域外部系统的性质,是影响FSI仿真精确性的最重要因素之一。Zero出口边界条件就像将血管切开直接暴露于大气环境中一样,由于其简单性,在多项研究中被广泛采用[13, 18],但忽略了下游血管的波反射现象引起的血液压力和流速的变化。为了描述由血流脉动性和血管弹性引发的波反射现象,引入impedance出口边界条件,这种条件包含了波反射的幅度以及到达的时间,能够很好地描述真实血流的脉动性质[19-20]。本研究的结果表明,就患者个体而言,一个完整心动周期中,VMS空间三维分布具有较大差异,并且impedance出口边界条件下峰值VMS显著高于zero下峰值VMS。
随后,分析了在impedance出口边界条件下不同壁厚模型(0.5 mm均匀壁厚和非均匀壁厚)对冠脉FSI仿真结果的影响。TAWSS是血流施加在血管内壁上的一种摩擦力,主要受到血管几何结构、血液黏性、边界条件等因素的影响。而VMS则是血管壁内部结构之间的应力,遵循形状改变比能理论,管壁厚度、有无斑块、斑块成分等都会影响其值的分布情况,而且与薄层纤维帽肩部更倾向于破裂有一定关系[7, 21]。研究结果表明,血管壁厚度对TAWSS的分布影响甚微,但是对冠状动脉血管局部VMS分布有一定影响。
如图6和图8所示,VMS应力集中(stress concentrated)主要出现在狭窄段血管以及分叉和弯曲处,而这些位置正是斑块发生和破裂的多发部位。狭窄区域斑块成分并不均一,斑块内脂质池呈现偏性心特征,而纤维帽浅表存在钙化结节。这些特征导致了应力分布的不均匀,出现应力集中现象。临床上,应力集中区位于纤维帽与正常组织交界处,也就是斑块的肩部,而“肩部”是斑块破裂的好发区域。因此,斑块所受应力在斑块发展和破裂中起着非常重要的作用。
在对结果进行解释时需要考虑到本研究的一些不足之处。首先,鉴于冠脉CTA影像不能获取斑块成分以及性质,本研究中假设粥样斑块的弹性模量、密度等和血管壁一样,并且没有考虑斑块的纤维帽、脂质池、钙化点等多种成分对计算结果的影响,这也是以后建模待优化之处。其次,血液被简化为不可压缩的牛顿流体,但是本质上,血流速度增加时,血液黏度降低,而剪切力增加,这种典型的非牛顿流体的剪切稀释性,可能会对仿真结果造成一定的影响。另外,研究仅分析了FSI交界面上VMS的分布,血管横截面上VMS分布的异同尚没有考虑,而横截面VMS的偏心性、集中性对预测斑块破裂可能具有重要意义。
4 结论
FSI仿真技术可以同时提供血液的流体动力学参数和血管壁的结构应力参数,是以后冠脉仿真分析的主要方向。随着医学影像技术的发展,未来可以获得更高精度的冠脉结构以及出入口速度和压强边界条件,这不但对研究血流动力学以及结构力学因素与心血管疾病的关系具有重要意义,也可以更好的服务于患者个体化诊断与治疗。
[1] Eshtehardi P, McDaniel MC, Suo J, et al. Association of coronary wall shear stress with atherosclerotic plaque burden, composition, and distribution in patients with coronary artery disease [J]. Journal of the American Heart Association, 2012, 1(4): e002543.
[2] Samady H, Eshtehardi P, McDaniel MC, et al. Coronary artery wall shear stress is associated with progression and transformation of atherosclerotic plaque and arterial remodeling in patients with coronary artery disease [J]. Circulation, 2011, 124(7): 779-788.
[3] Timmins LH, Molony DS, Eshtehardi P, et al. Focal association between wall shear stress and clinical coronary artery disease progression [J]. Annals of Biomedical Engineering, 2015, 43(1): 94-106.
[4] Koskinas KC, Chatzizisis YS, Papafaklis MI, et al. Synergistic effect of local endothelial shear stress and systemic hypercholesterolemia on coronary atherosclerotic plaque progression and composition in pigs [J]. International Journal of Cardiology, 2013, 169(6): 394-401.
[5] Chatzizisis YS, Jonas M, Coskun AU, et al. Prediction of the localization of high-risk coronary atherosclerotic plaques on the basis of low endothelial shear stress an intravascular ultrasound and histopathology natural history study [J]. Circulation, 2008, 117(8): 993-1002.
[6] Stone PH, Coskun AU, Kinlay S, et al. Regions of low endothelial shear stress are the sites where coronary plaque progresses and vascular remodeling occurs in humans: an in vivo serial study. European Heart Journal, 2007, 28(6): 705-710.
[7] Teng Zhongzhao, Brown AJ, Calvert PA, et al. Coronary plaque structural stress is associated with plaque composition and subtype and higher in acute coronary syndrome: the BEACON I (Biomechanical Evaluation of Atheromatous Coronary Arteries) study [J]. Circulation Cardiovascular Imaging, 2014, 7(3): 461-470.
[8] Sun Zhonghua, Xu Lei. Coronary CT angiography in the quantitative assessment of coronary plaques [J]. BioMed Research International, 2014, 2014:346380.
[9] Maurovich-Horvat P, Ferencik M, Voros S, et al. Comprehensive plaque assessment by coronary CT angiography [J]. Nature Reviews Cardiology, 2014, 11(7): 390-402.
[10] Yang Chun, Canton G, Yuan Chun, et al. Advanced human carotid plaque progression correlates positively with flow shear stress using follow-up scan data: an in vivo MRI multi-patient 3D FSI study [J]. Journal of Biomechanics, 2010, 43(13): 2530-2538.
[11] Fan Rui, Tang Dalin, Yang Chun, et al. Human coronary plaque wall thickness correlated positively with flow shear stress and negatively with plaque wall stress: an IVUS-based fluid-structure interaction multi-patient study [J]. Biomedical Engineering Online, 2014, 13(1): 32.
[12] Tang Dalin, Li Zhiyong, Gijsen F, et al. Cardiovascular diseases and vulnerable plaques: data, modeling, predictions and clinical applications [J]. Biomedical Engineering Online, 2015, 14 Suppl 1(S1).
[13] Zhang Junmei, Zhong Liang, Su Baoyang, et al. Perspective on CFD studies of coronary artery disease lesions and hemodynamics: a review [J]. International Journal for Numerical Methods in Biomedical Engineering, 2014, 30(6): 659-680.
[14] Torii R, Wood NB, Hadjiloizou N, et al. Fluid-structure interaction analysis of a patient-specific right coronary artery with physiological velocity and pressure waveforms [J]. Communications in Numerical Methods in Engineering, 2009, 25(5): 565-580.
[15] Feldman CL, Ilegbusi OJ, Hu Zhenjun, et al. Determination of in vivo velocity and endothelial shear stress patterns with phasic flow in human coronary arteries: a methodology to predict progression of coronary atherosclerosis [J]. American Heart Journal, 2002, 143(6): 931-939.
[16] Chaniotis AK, Kaiktsis L, Katritsis D, et al. Computational study of pulsatile blood flow in prototype vessel geometries of coronary segments [J]. Physica Medica, 2010, 26(3): 140-156.
[17] Siogkas P, Sakellarios A, Exarchos T, et al. Blood flow in arterial segments: Rigid vs. deformable walls simulations [J]. Journal of the Serbian Society for Computational Mechanics, 2011, 5(1): 69-77.
[18] Peiffer V, Sherwin SJ, Weinberg PD. Does low and oscillatory wall shear stress correlate spatially with early atherosclerosis? A systematic review [J]. Cardiovascular Research, 2013, 99(2): 242-250.
[19] Moon JY, Suh DC, Lee YS, et al. Considerations of blood properties, outlet boundary conditions and energy loss approaches in computational fluid dynamics modeling [J]. Neurointervention, 2014, 9(1): 1-8.
[20] Vignon-Clementel IE, Figueroa CA, Jansen KE, et al. Outflow boundary conditions for 3D simulations of non-periodic blood flow and pressure fields in deformable arteries [J]. Computer Methods in Biomechanics and Biomedical Engineering, 2010, 13(5): 625-640.
[21] Sadat U, Teng Zhongzhao, Gillard JH. Biomechanical structural stresses of atherosclerotic plaques [J]. Expert Review of Cardiovascular Therapy, 2010, 8(10): 1469-1481.
Effects of Outlet Boundary Condition and Wall Thickness on Wall Shear Stress and von Mises Stress in Coronary Artery
Xu Chuangye1,2Liu Xiujian1,2Wu Guanghui1,2He Yuna1,2Shu Lixia1,2Lin Changyan1,2#*
1(BeijingAnZhenHospital,CapitalMedicalUniversity,Beijing100029,China)2(BeijingInstituteofHeartLung&BloodVesselDiseases,Beijing100029,China)
This study is aimed to investigate the effects of different outlet boundary conditions and vessel wall thickness on time-averaged wall shear stress (TAWSS) and von Mises stress (VMS) in the coronary artery fluid structure interaction (FSI) analysis based on patient-specific computed tomography angiography(CTA)images. Firstly, 3D geometry of right coronary artery (RCA) lumen was reconstructed from CTA images. Then, lumen surface was expanded outward by 0.5 mm to establish uniform thickness vessel model. Finally, non-uniform thickness vessel was built by manually removing plaques. Zero and impedance boundary conditions were applied to the computational domains during FSI analysis. Distribution of TAWSS and VMS in a cardiac cycle from end diastolic phase were obtained and analyzed. TAWSS at stenosed sites were both significantly higher than other segments, and there was no significant difference with two outlet boundary conditions. Peak VMS appeared at 0.42 s (maximum pressure) with zero condition, while it appeared at 0.64 s (maximum flow velocity) with impedance condition and was 20 times higher. With impedance outlet boundary condition, the TAWSS in stenosed sites were both significantly higher than other segments, but had a similar distribution without statistical difference in different vessel models; the VMS distribution were both lower in stenosed sites and the absolute value of local VMS was higher in non-uniform thickness model than in uniform model. More accurate coronary structures and personalized flow and pressure boundary conditions were described based on the medical image, which is not only of great significance to studying relationship between hemodynamic, mechanical factors and cardiovascular disease, but also to serving patient-specific diagnosis and treatment.
coronary; fluid structure interaction; boundary condition; time-averaged wall shear stress; von Mises stress
10.3969/j.issn.0258-8021. 2016. 03.006
2015-09-10, 录用日期:2015-12-22
首都医学发展科研基金(2011-1005-02)
R318
A
0258-8021(2016) 03-0428-07
# 中国生物医学工程学会会员(Member, Chinese Society of Biomedical Engineering)
*通信作者(Corresponding author), E-mail: llbl@sina.com
