毛细管电泳-压力辅助电动进样技术对药物西酞普兰的高灵敏检测及手性拆分
2015-12-26徐中其王永乐李爱梅
徐中其 , 叶 峰, 王永乐, 李爱梅
(1. 东华大学化学化工与生物工程学院,上海201620;2. 生态纺织教育部重点实验室,东华大学,上海201620)
As a highly selective serotonin reuptake inhibitor (SSRI),the new antidepressant citalopram(CIT)owns two enantiomers of (S)-CIT and(R)-CIT (chemical structures displayed in Fig.1). The (R)-CIT is considered to be pharmacologically inactive and could inhibit the activity of the (S)-CIT. The pharmacological effect of CIT is mainly due to the isomer of (S)-CIT,which is over 100 folds than (R)-CIT for serotonin reuptake that has been proved by in vitro studies on rat brain[1-3]. Hence,less toxicity,higher activity and lower doses would be achieved by only administration of pure (S)-CIT (commercialized drug of Escitalopram)than racemic CIT form. So a highly sensitive method for enantioseparation of CIT is significant to pharmacodynamic studies as well as to the qualification of the commercial pharmaceutical formulations. Several methods including high performance liquid chromatography(HPLC)and capillary electrophoresis (CE)have been proposed to the assay of CIT isomers. The chiral separation via HPLC is known to use chiral column or add chiral selector into mobile phase.Kosel et al. [4]developed an HPLC method to separate the enantiomers of CIT and their two Ndemethylated metabolites,which were succeeded on a Chirobiotic V column and the obtained limit of quantification (LOQ)was 5.0 ng/mL for each enantiomer of CIT and the demethylated CIT.When HPLC coupled with MS detector,the sensitivity could be improved but facing cumbersome procedure and high cost. Rocha et al. [5]analyzed CIT in human and rat serum by LC-MS/MS on a Chiralcel OD-R chiral column,and the LOQ of each isomer approached 0.1 ng/mL. In addition,the pseudo-solid phase could be constructed by the addition of chiral selector (β-cyclodextrin,β-CD)in mobile phase for HPLC enantioseparation of CIT,as validated by El-Gingy et al. [6].They used conventional UV detection method that offered poor LOQs of 18.4 and 14.5 μg/mL respectively for (S)-CIT and (R)-CIT.
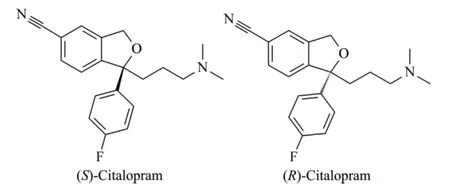
Fig.1 Structures of two CIT enantiomers
As an alternative tool of HPLC,CE recently has obtained more acceptances,and sometimes is superior to HPLC subjected to the domain of pharmaceutical and biological analysis. Currently,CE is an established method that is applied to assay the active pharmaceutical ingredients,drug impurity testing and chiral drug separation,and is recommended in several pharmacopeias. Especially,capillary electrochromatography (CEC)combines the advantages of HPLC and CE,and is regarded as a promising tool in pharmaceutical analysis.Enantioseparation in CE is the hotspot in drug discovery and pharmaceutical industry due to its high resolution and simplicity,since chiral CE can be easily performed by adding chiral selectors into background electrolyte (BGE). For CIT,Chi et al. [7]probed the enantioseparation of racemic CIT by CEC on a protein modified monolithic column. Mandrioli et al. [8]applied sulfated-β-cyclodextrin (S-β-CD)and β-CD as chiral selectors,and a rapid baseline separation was achieved within 6 min with the LOD of 0.15 μg/mL. Xiao et al. [9]used dextrin as chiral additive,and the LODs of (R)-CIT and (S)-CIT were 25.3 and 27.3 μg/mL,respectively. In general,the mass concentration of CIT in blood was less than 100 ng/mL that already validated by the pharmacokinetic studies. As the trial conducted by Chen et al. [10],the maximum mass concentrations of escitalopram in blood were respectively (5.5 ±1.0),(8.8±1.3)and (21.0±6.0)ng/mL after single oral dose of 5,10 and 20 mg for health volunteers. In the study that performed by Ji et al.[11],the mean mass concentration of (S)-CIT drug was 24.3 ng/mL found in the plasma of 300 major depressive disorder patients,who were treated by 10 mg of (S)-CIT for four weeks.These results indicated that CIT and its metabolites were always at several ng/mL (ppb)levels,which were lower than the LOD obtained by CE if only with normal UV detection. Obviously,to improve the sensitivity of CE is critical to match the requirements of CIT analysis in human body biofluids. In CE,the injection amount of the analytes is a significant contributor to high sensitivity. The more sample injected,the higher sensitivity can be expected if the sample is inline preconcentrated by stacking techniques.
Pressure-assisted electrokinetic injection (PAEKI)is a stacking approach comprised two key points. (1)The sample is introduced and enriched by electrokinetic injection (EKI)and with much long injection time. (2)The motionless of stacked boundary (between sample and BGE)is created by a constant reverse pressure to counterbalance the electroosmotic flow (EOF). The mechanism of sample enrichment is similar as field-amplified sample injection (FASI). Furthermore,the enriched sample will stop near inlet because of the balance of pressure and EOF. Therefore,the capillary space is saved for the final separation without degradation of resolution. The application of PAEKI was first conducted by Hissner et al. [12]to determine the flotation reagents used in tin-mining by CE,and the LOD was decreased to 10-40 ng/mL (ppb). Feng’s group[13]developed PAEKI for CE analysis of nucleotides in 2006. Since then,his group systematically studied the mechanism of PAEKI,and applied this method for the online enrichment of DNA oligonucleotides[14],monophthalates[15],halogenated phenols [16],toxic inorganic anions in drinking water[17],haloacetic acids[18],and perchlorate in water and soil samples [19]. In these reports,the limit of detection was dramatically improved due to MS detector and long injection time (even to 300 s). Except external pressure applied on capillary,Fukushi’s group[20]used vacuum in combination with EKI to enhance CZE sensitivity,and named the method hybrid sample injection mode (HSIM). Oukacine et al.[21]developed hydrodynamic injection with EKI that resulting in sample overloading for isotachophoretic preconcentration of bacteria. In principle,these procedures are similar to PAEKI. In these PAEKI studies,few were related to pharmaceutical analysis. Our group [22] first applied PAEKI for inline stacking and enantioseparation of negatively charged verteporfin drugs,and the sensitivity was improved to 116-fold in comparison with hydrodynamic injection (HDI). In the present study,we developed PAEKI stacking for positively charged CIT enantiomers,and aimed to meet the needs of CIT determination at ng/mL(ppb)level. The optimization of sample introduction and the balance between EOF and pressure were detailed. The protocol and obtained LOD would be hopeful to provide strong support to pharmacokinetic study of CIT.
1 Experimental
1.1 Instrumental and reagents
All experiments were conducted on a P/ACETMMDQ capillary system (Beckman Coulter,CA,USA)equipped with a photo-diode array (PDA)detector,with which we can measure the samples at different wavelengths ranging from 190 to 600 nm. The data treatment was achieved with the included 32 Karat Software. The separation was performed using polyimide-coated fused-silica capillary of 50 cm×75 μm i. d. (effective length 40.0 cm)purchased from Ruifeng Co.,Ltd. (Hebei,China). The capillary temperature was controlled with an inert liquid that circulated through the cartridge at (25±0.1)℃. Purified water used to prepare all solutions was delivered by a Milli-Q Labsystem (Millipore,Germany). Racemic CIT was purchased from Maicang Biological Technology Co.,Ltd. (Shanghai,China). The CIT stock solution was prepared at 0.20 g/L,which was diluted in water to a certain concentration prior to CE analysis. The chiral selector S-β-CD was provided by Sigma-Aldrich (MO,USA),and other chemicals as citric acid and NaOH were all analytical grade and from Sinopharm Group Co.,Ltd.The investigation of BGE was reported in detail by us[23],and the final optimized BGE consisted of 20 mmol/L citric acid,0.04% (w/v)S-β-CD at pH of 5.50 (adjusted by 1.0 mol/L NaOH).
1.2 Electrophoretic conditions
The new capillary was preconditioned with methanol (10 min),1.0 mol/L NaOH (20 min),water (5 min),1.0 mol/L HCl (10 min)and water (5 min). Prior to each run,the capillary was sequentially flushed with water (3 min)and BGE(3 min). After sample injection,the separation was achieved by applying a constant voltage of+20.0 kV,and the enantioseparation of CIT was achieved within 10 min. The PDA wavelength was set at 205 nm for the detection of CIT.
2 Results and discussion
2.1 EKI bias of CIT enantiomers
Herein,Fig.2 depicts three injection modes.Fig.2a and b are traditional CE injection modes of HDI and EKI,which are well known. For HDI,the injected sample volume is limited by the dimensions of the capillary because a part of the capillary has to be left free of sample solution for the subsequent separation. In our study,the obtained LOD of CIT is around 90 μg/L under UV detection when HDI adopted[23]. For positively charged CIT,EKI at positive polarity is displayed in Fig.2b. The ion migration is in the same direction as the EOF that resulting in rapid migration of analytes and the wide sample zone broadening,which limits the enrichment effect evoked by field-amplified stacking. So it seems difficult to obtain satisfactory enrichment via HDI or EKI individually.
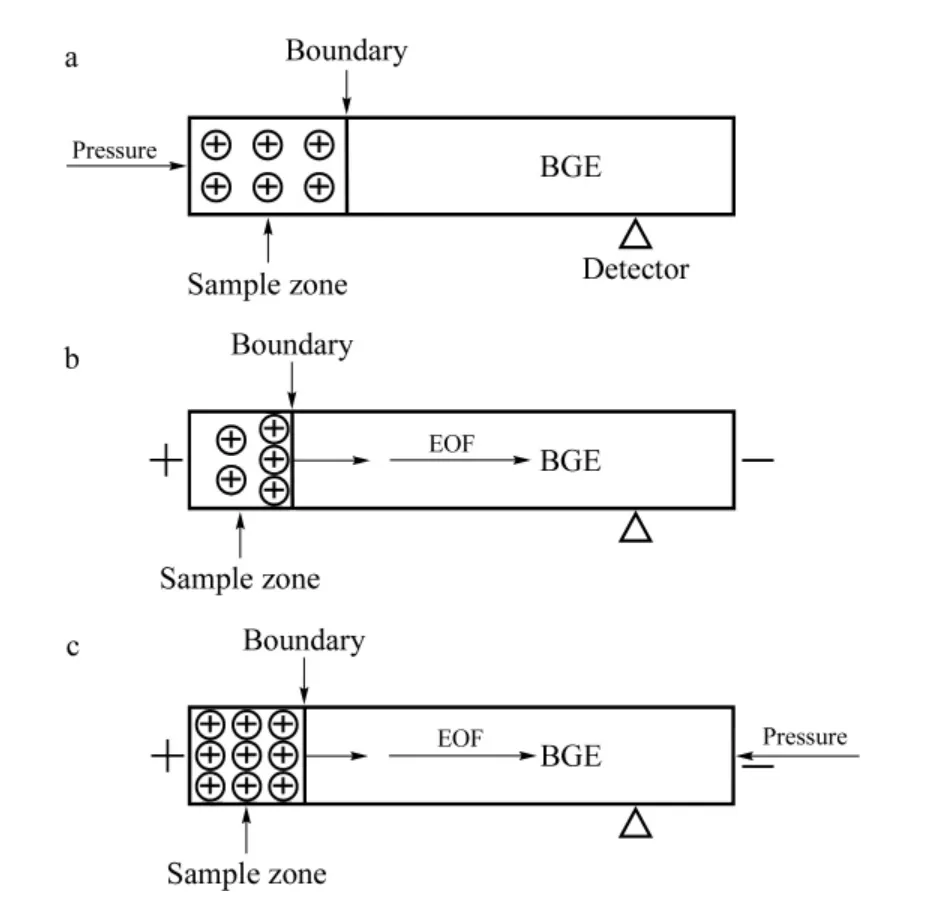
Fig.2 Schematic diagram of three sample injection modes prior to CE separation
Another important phenomenon that validated during EKI was injection bias between (S)-CIT and (R)-CIT,because of their different dynamic equilibrium constants when combining with chiral selector. As shown in Fig.3,the racemic CIT was introduced into capillary at different EKI times that resulted in different peak ratios between two isomers. In Fig.3a,it was found that the peak area ratio of (S)-CIT to (R)-CIT was around 1.0 at EKI time of 5.0 s. By increasing EKI time to 20 s,the peak of isomer (R)-CIT almost disappeared. Based on these results,such EKI process is described in Fig.3b,where three steps respectively depicts BGE introduction,sample injection and separation. The capillary was first filled with BGE (consisting of S-β-CD)before sample introduction. During EKI step,two free isomers migrated towards cathode in the same direction as EOF,but also,the negatively charged chiral selector (S-β-CD)migrated in the opposite direction. When the isomer combined with S-β-CD, the transient diastereomeric complexes would migrate to anode,which possibly leads to sample deletion. The longer EKI time was,the smaller (R)-CIT peak was found in Fig.3a. The transient complex of chiral selector with (R)-CIT would flow out in resulting of the disappearing of(R)-CIT. The result also implied that the thermodynamic equilibrium constant between S-β-CD and(R)-CIT was higher than that with (S)-CIT,i. e.(R)-CIT combined with S-β-CD is more stable.

Fig.3 Injection bias due to different dynamic equilibrium constants between chiral selector(S-β-CD)and two isomers of CIT
2.2 Strategy to eliminate injection bias for PAEKI stacking
The mechanism of PAEKI for CIT is to apply a constant pressure at the capillary outlet during EKI to counterbalance the EOF force. In this way,the cationic sample is stacked by EKI at the boundary between sample zone and BGE (Fig.2c). Obviously,it is difficult to achieve PAEKI by following three steps in Fig.3b,since the EKI discrimination of CIT enantiomers would cause(R)-CIT not to be injected. To address this issue,a smart strategy was done as displayed in Fig.4b. Here,the first step in Fig.4b is that the capillary was filled with a special BGE only without S-β-CD,thus two enantiomers were equally electrokinetically introduced into capillary due to the same mobility in BGE absent of chiral selector. The obtained results of new EKI protocol are shown in Fig.4a. The peak area ratio of (S)-CIT to (R)-CIT was kept at 1.0 when EKI time was 5.0 s or 20 s which means the injection bias was suppressed. So the protocol in Fig.4b could offer long EKI time for PAEKI by the following steps.(1)The capillary was filled with the BGE without S-β-CD. (2)The inlet and outlet vials were replaced with sample solution and normal BGE with S-β-CD,respectively. The voltage and pressure(optimization as the next section)were applied to PAEKI as shown in Fig.2c. In this step,the injection bias was avoided. The stacked boundary between sample and BGE was constructed for possible long time injection. (3)The inlet and outlet vials were normal BGE for the final separation step.
2.3 Optimization for PAEKI conditions
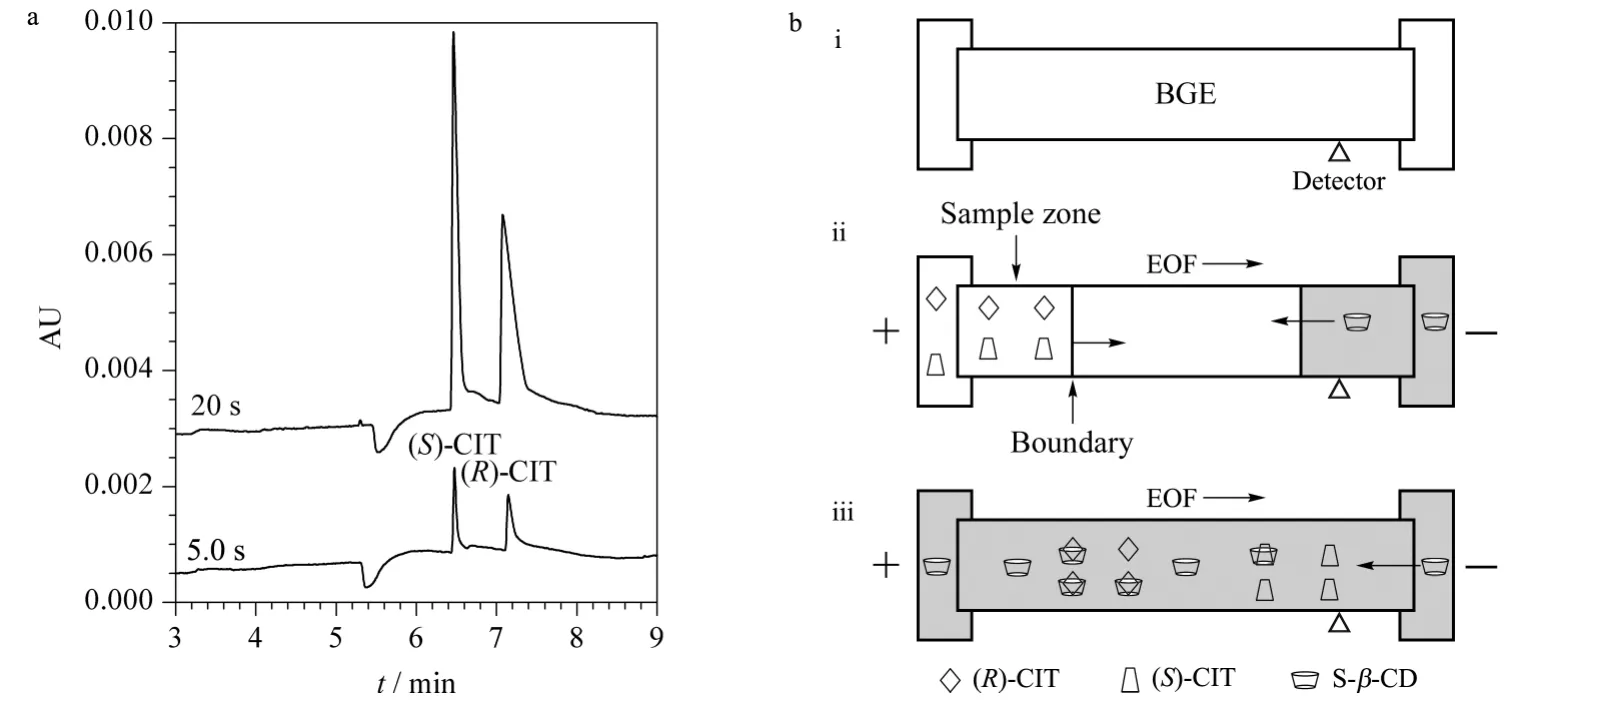
Fig.4 Obtained results and applied protocol of elimination of the injection bias during EKI
The balance condition of pressure vs. voltage(the parameter determines EOF force)is essential to PAEKI. The detailed optimization process was carried out by setting the applied voltage from 9.0 to 11.0 kV in PAEKI. The constant pressure was set at 0.3 psi (ca. 2.1 kPa)to observe the peak intensity and zone width. The PAEKI process was sustained 2.0 min as the electropherograms shown in Fig.5a. At 9.0 kV,the CIT peaks were not detected since the EOF force is smaller than 0.3 psi (ca. 2.1 kPa). By increasing the voltage to 11.0 kV,the high intensity and broad peaks of two isomers were observed,which indicated the EOF force evoked at 11.0 kV was greater than 0.3 psi (ca. 2.1 kPa). In practice,the CE injection voltage is always around ±10.0 kV,to avoid long ramp time and high Joule heat. Based on such consideration,the injection voltage was set at 10.0 kV for seeking suitable pressure. As shown in Fig.5b,the pressure was increased from 0.2 to 0.4 psi at the interval of 0.1 psi (minimum adjustable pressure of the apparatus)for observation of the peak intensities. At 0.2 psi,the maximum peak intensity was achieved. The pressure of 0.3 or 0.4 psi was stronger than the EOF force induced at 10.0 kV,so the bulk flow in the capillary was pushed out of the inlet resulted in sample deletion. So in Fig.5b,the peaks got smaller at 0.3 psi or even disappeared at 0.4 psi. Thus,the injection voltage of 10 kV and reverse pressure of 0.2 psi were regarded as most suitable for the balancing of EOF and pressure to achieve high sensitivity. The PAEKI process was sustained 2.0 min under such PAEKI conditions. The achieved LODs of (S)-CIT and(R)-CIT were 1.1 and 2.2 ng/mL at low ppb levels,which were improved more than 62-fold (averaged)than traditional HDI for CIT analysis.Such LODs might meet some clinical request when the concentration of CIT is low. The RSDs of peak migration time and area were averaged 2.1% and 2.9% (n =5),respectively. The repeatability could match the demand of qualitative and quantitative analysis of CIT. Table 1 is the data list of LODs,LOQs and RSDs.
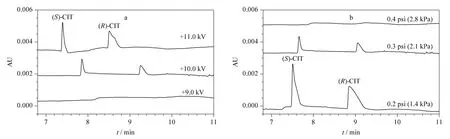
Fig.5 Optimization of PAEKI balance conditions
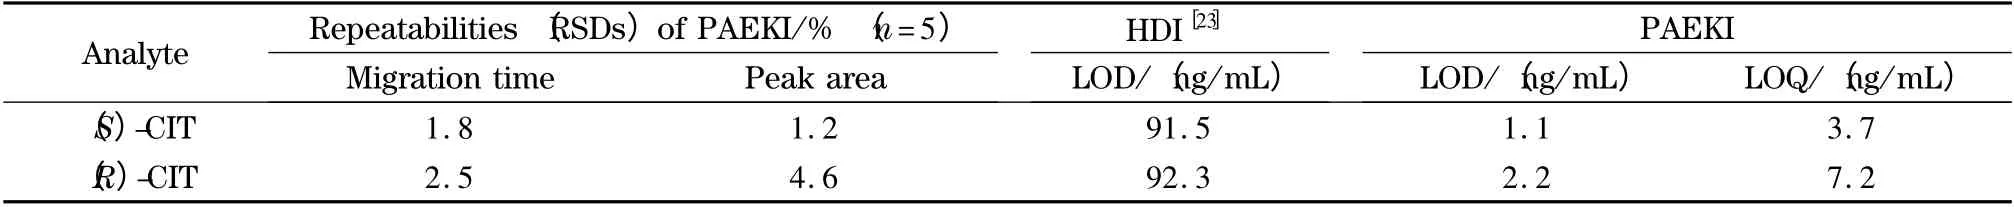
Table 1 Parameters for enantioseparation of CIT analyzed by HDI and PAEKI
3 Conclusions
In this work,a highly sensitive CE method for enantioseparation of CIT by PAEKI has been developed. With an elaborate investigation of the balance between EOF and pressure,the constant pressure and applied voltage were determined in PAEKI process. Herein,the reverse pressure of 0.2 psi (ca. 1.4 kPa)would balance the EOF induced at 10.0 kV. Under such conditions,the injection time was 2.0 min for 0.20 μg/mL sample dissolved in water,which would be stacked at the almost motionless boundary of the sample zone and BGE. This resulted in the LODs at ng/mL(ppb)level,which was averaged 62-fold improved in comparison with normal HDI. The RSDs of the migration time and peak area of the two isomers were about 2.1% and 2.9%,respectively. PAEKI was proved to be an effective preconcentration method to improve the detection sensitivity in enantioseparation study. Further advancements are expected in order to enable a determination of the trace CIT drug in real human biofluids,where the complex matrix influences the sample via electrokinetic injection.
[1] Hyttel J,Bogeso K P,Perregaard J,et al. J Neural Transm,1992,88(2):157
[2] Mork A,Kreilgaard M,Sanchez C. Neuropharmacology,2003,45(2):167
[3] Wu L H,Wu S,Lu J X,et al. Chinese Journal of Pharmaceutical Analysis,2012,32(1):71
[4] Kosel M,Eap C B,Amey M,et al. J Chromatogr B,1998,719(1/2):234
[5] Rocha A,Marques M P,Coelho E B,et al. Chirality,2007,19(10):793
[6] El-Gindy A,Emara S,Mesbah M K,et al. J AOAC Int,2006,89(1):65
[7] Chi C J,Wang W,Ji Y B. Chinese Journal of Chromatography,2014,32(8):791
[8] Mandrioli R,Fanali S,Pucci V,et al. Electrophoresis,2003,24(15):2608
[9] Xiao S Y,Xu H M,Tang S Y,et al. Chinese Journal of Analytical Chemistry,2005,33(11):1527
[10] Chen J,Song M,Hang T J,et al. Chinese Journal of New Drugs and Clinical Remedies,2007,26(12):912
[11] Ji Y,Schaid D J,Desta Z,et al. Br J Clin Pharmacol,2014,78(2):373
[12] Hissner F,Daus B,Mattusch J,et al. J Chromatogr A,1999,853(1/2):497
[13] Feng Y L,Zhu J P. Anal Chem,2006,78(18):6608
[14] Feng Y L,Lian H Z,Zhu J P. J Chromatogr A,2007,1148(2):244
[15] Feng Y L,Zhu J P. Electrophoresis,2008,29(10):1965
[16] Zhang H J,Zhu J P,Feng Y L. Anal Sci,2010,26(11):1157
[17] Zhang H J,Gavina J,Feng Y L. J Chromatogr A,2011,1218(20):3095
[18] Zhang H J,Zhu J P,Aranda-Rodriguez R,et al. Anal Chim Acta,2011,706(1):176
[19] Aranda-Rodriguez R,Jin Z Y,Zhu J P,et al. Anal Sci,2012,28(3):231
[20] Kaewchuay N,Yakushiji Y,Fukushi K,et al. Electrophoresis,2011,32(12):1486
[21] Oukacine F,Quirino J P,Garrelly L,et al. Anal Chem,2011,83(12):4949
[22] Xu Z Q,Li A M,Wang Y L,et al. J Chromatogr A,2014,1355:284
[23] Liu H Q,Li A M,Xu Z Q. Study on Chiral Separation of Citalopram by Capillary Electrophoresis. J Anal Sci,in press
