Simultaneous determination of four Sudan dyes in rat blood by UFLC-MS/MS and its application to a pharmacokinetic study in rats☆
2015-11-17HoZhuYijunChenChngshunHungYngyngHnYiweiZhngShucnXieXiohongChenMicongJin
Ho Zhu,Yijun Chen,Chngshun Hung,*,Yngyng Hn,Yiwei Zhng,Shucn Xie,Xiohong Chen,Micong Jin
aDepartment of Anesthesia,the First Hospital of Ningbo City,Ningbo 315010,China
bZhejiang Provincial Key Laboratory of Health Risk Appraisal for Trace Toxic Chemicals,Ningbo Municipal Center for Disease Control and Prevention,Ningbo 315010,China
cNingbo Key Laboratory of Poison Research and Control,Ningbo Municipal Center for Disease Control and Prevention,Ningbo 315010,China
Original Article
Simultaneous determination of four Sudan dyes in rat blood by UFLC-MS/MS and its application to a pharmacokinetic study in rats☆
Hao Zhua,Yijun Chena,Changshun Huanga,*,Yangyang Hana,Yiwei Zhanga,Shucan Xiea,Xiaohong Chenb,c,Micong Jinb,c
aDepartment of Anesthesia,the First Hospital of Ningbo City,Ningbo 315010,China
bZhejiang Provincial Key Laboratory of Health Risk Appraisal for Trace Toxic Chemicals,Ningbo Municipal Center for Disease Control and Prevention,Ningbo 315010,China
cNingbo Key Laboratory of Poison Research and Control,Ningbo Municipal Center for Disease Control and Prevention,Ningbo 315010,China
A R T I C L E I N F O
Article history:
1 March 2015
Accepted 2 March 2015
Available online 18 March 2015
Multiple reaction monitoring
Pharmacokinetics
Rat whole blood
Sudan dye
UFLC-MS/MS
A rapid and sensitive method based on ultrafast liquid chromatography-tandem mass spectrometry was developed and validated for simultaneous determination of Sudan I,Sudan II,Sudan III,and Sudan IV levels in rat whole blood.Cleanert C18 mixed-mode polymeric sorbent was used for effective solid-phase extraction cleanup.Separation was carried out on a reversed-phase C18column(100 mm×2.1 mm,1.8 μm)using 0.1%(v/v)formic acid in water/0.1%(v/v)formic acid in acetonitrile as the mobile phase in gradient elution.Quantification was performed by an electrospray ionization source in the positive multiple reaction monitoring mode using D5-Sudan I as the internal standard.Calibration curves showed good linearity between 0.2 and 20.0 μg/L,with correlation coefficients higher than 0.9990.The average recovery rates were between 93.05%and 114.98%.The intra-and inter-day relative standard deviations were within 6.2%.The lower limit of quantification was 0.2 μg/L.All the analytes were found to be stable in a series of stability studies.The proposed method was successfully applied to a pharmacokinetic study of four Sudan dyes after oral administration to rats.
©2015 Xi'an Jiaotong University.Production and hosting by Elsevier B.V.All rights reserved.This is an open access article under the CC BY-NC-ND license(http://creativecommons.org/licenses/by-nc-nd/4.0/).
1.Introduction
Sudan dyes(Sudan I,Sudan II,Sudan III,and Sudan IV;Fig.1),a group of synthetic fat-soluble colorants that contain an azo group(-N=N-)as part of the structure,are mainly used in textile,rubber,plastic,paint,and other coloring applications.Sudan dyes are frequently used as a food-coloring agent by unscrupulous merchants because of their bright red color,colorfastness,and low price.However,these synthetic colorants have been classified as possible human carcinogens[1-4],and pose a potential risk to consumer health if their daily intake exceeds the maximally permitted levels established by the World Health Organization[5]. Thus,their extensive use in food products has been prohibited by the European Commission[6].
Several analytical methods have been used to determine the presence of Sudan dyes in food products.These methods mainly involve liquid chromatography(LC)[7-11],flow injection chemiluminescence[12],enzyme-linked immunosorbent assays[13-15],capillary electrophoresis[16],electrochemical methods[17,18],LC-mass spectrometry(MS)[10,19-21],and electrospray tandem quadrupole orthogonal-acceleration time-of-flight MS[22-25].LC separation,most commonly used method,has been coupled with different spectrophotometric detection methods to determine the Sudan dye levels.These detections include MS[10,19-25],ultraviolet/visible detection[7,8,10,11],diode array detection[9],and electrochemical detection[12].However,relatively few studies have analyzed azo dye residues in whole blood samples[26].With the development of electrospray ionization(ESI),MS has become a powerful analytical tool in pharmaceutical analysis because of its high sensitivity,selectivity,and short run time[27-31].In combination with LC,tandem MS(MS/MS)is a superior alternative for drug residue analysis in biological samples.The aim of this study was to develop a sensitive,robust,and fast method for the analysis of low-level concentrations of four azo dyes(Sudan I,Sudan II,Sudan III,and Sudan IV)in whole blood samples using ultrafast LC with MS/MS(UFLC-MS/MS).The proposed method can achieve rapid separation of dyes in gradient elution within 6.5 min.The validated method was applied to determine the levels of the four Sudan analytes in rat whole blood samples obtained from healthy Sprague-Dawley(SD)rats used in pharmacokinetic studies.
2.Experimental
2.1.Chemicals and materials
Sudan I(>95.0%),Sudan II(>99.0%),Sudan III(>98.0%),and Sudan IV(>98.0%)were purchased from Dr.Ehrenstorfer GmbH(Augsburg,Germany)and used without further purification.D5-Sudan I(purity>99.4%)was purchased from Witega Laboratories Berlin-Aldershof GmbH(Berlin,Germany).High-performance LC(HPLC)-grade acetonitrile and n-hexane were purchased from Merck(Darmstadt,Germany).HPLC-grade formic acid was obtained from Sigma-Aldrich(St.Louis,MO,USA).The solid-phase extraction(SPE)Cleanert C18 cartridges(500 mg/6 mL)used for sample preparation were procured from AgelaTechnologies(Tianjin,China).HPLC-grade water was generated using a Milli-Q integral water purification system (Millipore,Molsheim,France). Edible oil was obtained from the local market(Ningbo,China). Blank blood was obtained from untreated animals and frozen at-20°C until analysis.
2.2.Animals
Certified commercial SD rats,weighing 240±20 g,were purchased from the Experimental Animal Center of the Zhejiang Academy of Medical Sciences(Hangzhou,Zhejiang,China).Thirty healthy and drug-free SD rats(15 males and 15 females)were acclimatized in 10 rat cages in a unidirectional airflow room with controlled temperature(22-25°C),relative humidity(45%-55%),and a 12 h light/dark cycle for one week before the start of the experiments.The rats were given free access to filtered tap water and commercial rat food.
2.3.Apparatus and conditions
UFLC-MS/MS was performed using a Shimadzu Prominence UFLC XR system coupled with an Applied Biosystems SCIEX Triple Quad 5500 mass spectrometer and ESI source.The UFLC-MS/MS system was controlled,and data were analyzed on a computer equipped with Analyst 1.5.1(Applied Biosystems,MA,USA). Chromatographic separation was performed on an Agilent Eclipse Plus C18column(column size:2.1 mm×100 mm,particle size: 1.8 μm)using solution A(water with 0.1%(v/v)formic acid)and solution B(acetonitrile with 0.1%(v/v)formic acid)as the mobile phase.The flow rate was 0.45 mL/min.The gradient program used for elution was as follows:initial conditions with solvent B were increased from 10%B to 95%B in 2.0 min,held constant at 95%B for 2.5 min,returned to initial conditions,and maintained for 2.0 min for equilibration.The total run time was 6.5 min.The column temperature was set at 40°C.A total of 5 μL of the solution was injected into the UFLC-MS/MS system for analysis.
MMSS wwaass ppeerrffoorrmmeedd uussiinngg tthhee ppoossiittiivvee EESSII mmooddee aanndd mmuullttiippllee reaction monitoring(MRM)mode for quantification.The optimized instrument operating parameters for mass spectral acquisition were as follows:ion spray voltage,5500 V;curtain gas,40 psi;interface heater,on;nebulizer gas(gas 1)and heater gas(gas 2),30 psi each;turbo spray temperature,500°C;entrance potential,10 V;and collision cell exit potential,10 V.Nitrogen was used in all cases.Retention times,precursor ions(Q1),product ions(Q3),declustering potential(DP),and collision energies(CEs)of each Sudan dye are shown in Table 1.The dwell time was set at 0.05 s for all the compounds.
2.4.Standard stock solution preparation
Individual stock solutions of four Sudan dyes and D5-Sudan I as an internal standard(IS)at 1000.0 mg/L were prepared in acetonitrile.The standard solution was stored at-20°C in tightly closed bottles in the dark.Mixed standard stock solution was prepared by diluting the standard stock solution of each dye with acetonitrile to a final concentration of 100.0 μg/L.The IS solution was subsequently diluted with acetonitrile to a final concentration of 100.0 μg/L.Working standard solutions at the concentrations of 0.2,0.5,1.0,2.0,5.0,10.0,and 20.0 μg/L were prepared daily by diluting the mixed standard stock solution with acetonitrile in appropriate proportions.
2.5.Calibration standards and quality control(QC)samples
Calibration standard solutions at the concentrations of 0.2,0.5,1.0,2.0,5.0,10.0,and 20.0 μg/L were freshly prepared by adding the appropriate mixed standard stock solution(100.0 μg/L)to 20.0 μL of blank rat whole blood,and stored at 4°C until the initiation of UFLC-MS/MS analysis(IS concentration:2.0 μg/L).The four concentration levels(0.2,0.5,5.0,and 16.0 μg/L)(lower limit of quantitation(LLOQ),low,medium,and high levels)in blank rat whole blood were considered as QC samples.These samples were stored in a freezer compartment at-20°C and brought to room temperature before use.
2.6.Sample preparation
Approximately 20.0 μL of whole blood sample and 10.0 μL of IS solution(100.0 μg/L)were mixed in a 2.0 mL Eppendorf tube,in which 0.5 mL of acetonitrile was added prior to extraction.The mixture was extracted by vortex-mixing for 3 min at ambient temperature.The extract was centrifuged at 20,000g for 5 min.The supernatant solution was then subjected to SPE for further purification.

Fig.1.Chemical structures of Sudan I,Sudan II,Sudan III,and Sudan IV.
The Cleanert C18 cartridges were preconditioned and equilibrated with 2 mL of methanol and 2 mL of water.Then,the aforementioned mixed solution was slowly loaded into thecolumn.Sampling was followed by a cleanup step.The cartridges were rinsed with 2 mL of acetonitrile/water(50:50,v/v)at a flow rate of 1 mL/min and pump-dried.Elution was performed with two aliquots of 3 mL of n-hexane.The eluate was evaporated to dryness by a gentle nitrogen flow and reconstituted with 0.5 mL of acetonitrile.Finally,the reconstituted eluate was filtered through a 0.2 μm polytetrafluoroethene(PTFE)microporous film,and 5.0 μL was injected into the UFLC-MS/MS system.
2.7.Selectivity
Six individual rat whole blood samples obtained from different sources were used to assess selectivity.Blood from each rat subject was extracted and checked for peaks that can interfere with the detection of the four Sudan dyes and IS in the rat whole blood samples.The chromatographic peaks were confirmed by comparing the retention times(tR)and mass fragment ions with those of reference standards.
2.8.Matrix effect(ME)
As suggested by Matuszewski et al.[26],a quantitative approach to assess absolute MEs was performed using a post-extraction addition study,in which percent ME(ME%)is calculated. In this study,the absolute ME was determined by comparing the mean peak areas of QC samples spiked post-extraction(B)with those of the standard solutions(A).ME%was determined using the following equation:absolute ME(ME%)=(B/A)×100.The absolute ME was evaluated at four concentration levels(LLOQ,0.2 μg/L;low,0.5 μg/L;medium,5.0 μg/L;and high,16.0 μg/L)and three parallels.
2.9.Precision and accuracy
The four QC samples(LLOQ,0.2 μg/L;low,0.5 μg/L;medium,5.0 μg/L;and high,16.0 μg/L)were used to assess interday precision and accuracy,which were analyzed on at least three separate runs.For intraday precision,six aliquots of each QC sample were thawed to room temperature and analyzed within a day.For interday precision,the tested experiments were done in triplicates for each QC sample on eight separate days within a two-week period.The relative standard deviations(RSD%)of the four Sudan dyes in each QC concentration were then calculated.
Accuracy was expressed by the recovery rates,which were assessed by comparing the mean peak area ratios from the rat blood samples for standards spiked before extraction(C)with those for standards spiked after extraction into the plasma extracts(B).The recovery rates were calculated using the following formula:recovery(%)=(C/B)×100[26].Experiments on the three QC samples were performed in five replicates.
2.10.Stability
Stability experiments were performed to evaluate analyte stability in rat whole blood extracted samples under different conditions.The LLOQ,low,medium,and high-concentration QC samples were analyzed in triplicates.Short-term stability was tested by placing the QC samples at room temperature in an autosampler for 2,4,8,and 12 h.Freeze-thaw stability was determined by analyzing the samples for three cycles(from-20°C to room temperature).Long-term stability of the QC samples stored at-20°C was tested for 30 days.The stability experiments were then evaluated by comparing the concentration obtained with the standard values(the quantitative data of the freshly prepared QC samples by used the instrument method),followed by calculation of the deviations.
2.11.Pharmacokinetic study
The study was conducted in accordance with the Ethical Guidelines for Investigations in Laboratory Animals and approved by the Ethics Review Committee for Animal Experimentation of the Ningbo University.Certified commercial SD rats were used after growth for one week.Before the day of administration,30 rats were randomly assigned to five groups(blank edible oil group,Sudan I group,Sudan II group,Sudan III group,and Sudan IV group).Each group comprised three males and three females.Rats fasted overnight but were allowed access to water ad libitum.Sudan dyes(Sudan I,Sudan II,Sudan III,and Sudan IV)were separately dissolved in 10 mg/mL of edible oil and administered via a single oral(p.o.)dose of 50 mg/kg of Sudan dyes.Approximately 20.0 μL of the whole blood sample(at 10.0,20.0,30.0,and 40.0 min and 1.0,1.5,2.0,3.0,5.0,7.0,10.0,15.0,and 24.0 h postdosing for Sudan I and Sudan II;whereas 1.0,2.0,3.0,4.0,5.0,6.0,7.0,9.0,11.0,15.0,20.0,32.0,and 48.0 h postdosing for Sudan III and Sudan IV)was collected from the rat tail vein,poured into a 2 mL of heparinized centrifuge tube containing 0.5 mL of acetonitrile,and immediately vortex-mixed for 3 min.These samples were immediately centrifuged and cleaned according to Section 2.6.The extracts were stored in the dark at 4°C prior to analysis.
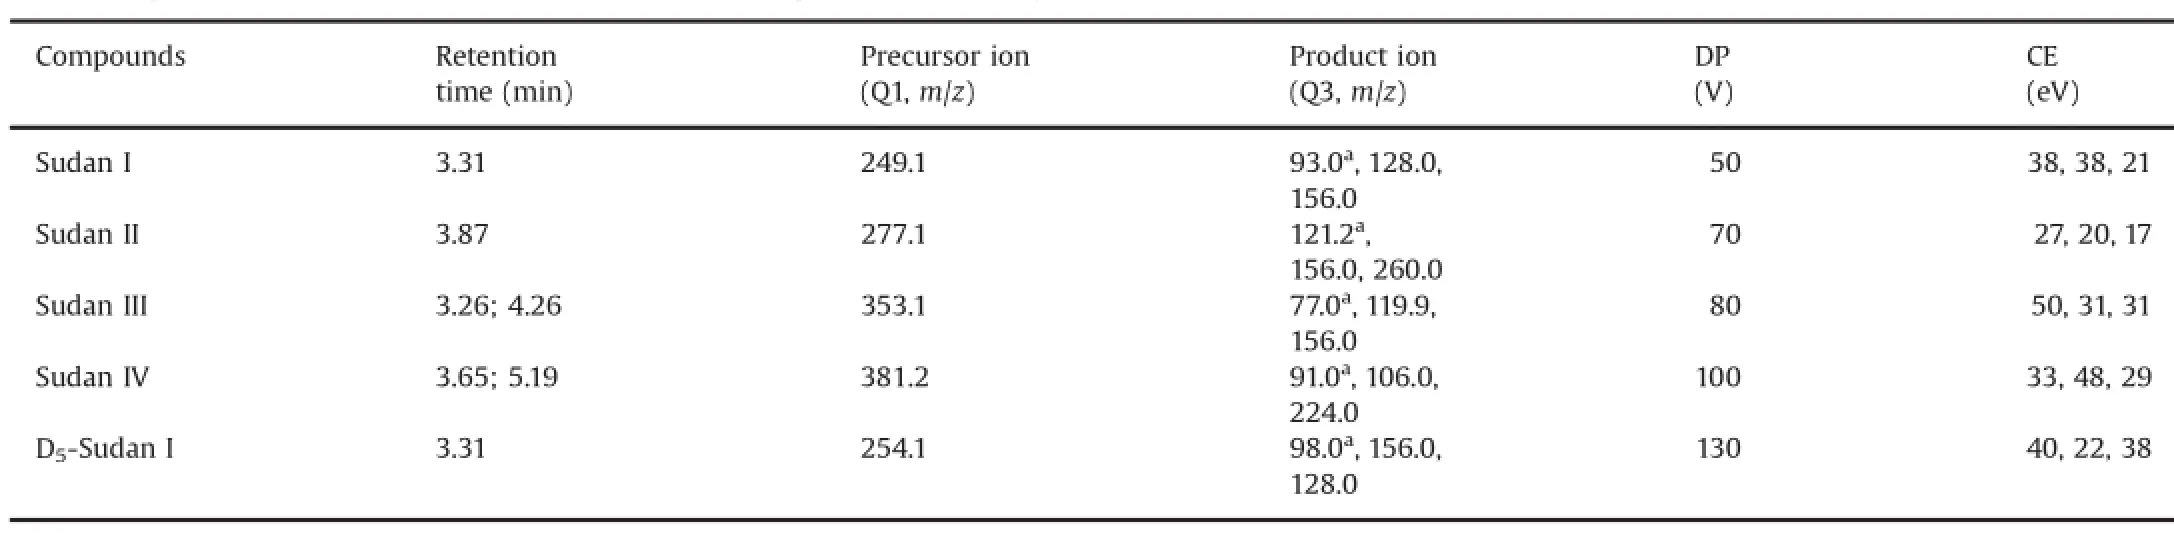
Table 1Q1/Q3 ion pairs,DP,CE of MRM,and retention time for the optimized UFLC-MS/MS method in MRM mode.
3.Results and discussion
3.1.Sample preparation
In this study,an efficient extraction solvent was selected using a recovery test(at 1.0 μg/L)in a rat whole blood sample.Based on their molecular structures and fat-soluble properties,various extraction solvents,such as methanol,acetonitrile,dichloromethane,and nhexane,were chosen.After the extraction and total processing time were comprehensively evaluated,a simple protein precipitation method was proposed for extraction.Acetonitrile was selected as the optimal protein precipitation solvent because of its good protein precipitation efficiency and good extraction efficiency.
Given that Sudan dyes are fat-soluble compounds,normal neutral alumina SPE cartridges are recommended for use in cleanup.The activity of alumina N was adjusted according to the recoveries of standard solutions through the column because of variations in the quality of different batches of alumina N.During SPE cleanup,trace water in blood extracts significantly affected the recovery and precision.Thus,extracts should be dried with anhydrous sodium sulfate prior to sample loading.However,the application of this step for water-enriched rat whole blood samples prior to preparation is highly difficult.Therefore,we selected a stable and simple C18 SPE cartridge for cleanup,and achieved good recovery rates with all four dyes,in which>95%were unaffected by trace water.Fig.2 shows the MRM chromatograms with and without SPE cleanup.Interference significantly decreased with the use of SPE cleanup compared with that without SPE cleanup.
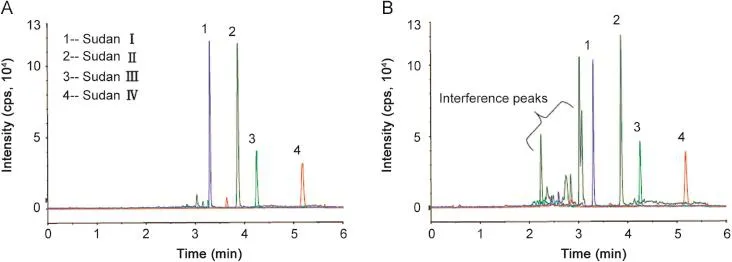
Fig.2.MRM chromatograms with SPE cleanup(A)and without SPE cleanup(B).
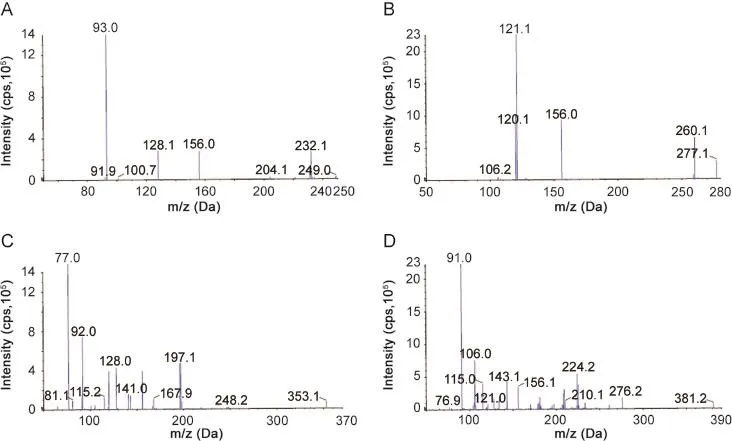
Fig.3.Representative MS/MS spectra obtained from Sudan I(A),Sudan II(B),Sudan III(C),and Sudan IV(D).
3.2.LC and MS
The analytes have hydrophobic and lipophilic characteristics. Thus,organic solvent-rich mobile phases are typically used for their rapid elution and strong retention in reversed-phase chromatography.C18columns from different manufacturers have been used in previous studies,in which the most common column length was 150 mm,but diameters and particles differed.In our preliminary experiments,mixtures of deionized water with two common HPLC organic modifiers(acetonitrile and methanol)were used as the mobile phases.The flow rate was 0.45 mL/min,and the sample injection volume was 5 μL.Acetonitrile offered better peaksymmetry and was selected for subsequent studies.The studied azo dyes were weak acids(pKa(SudanI&II)=11.65)because an intermolecular hydrogen bond could be formed with the phenolic hydroxyl groups.Thus,the effect of the mobile phase pH on the chromatographic behavior of analytes was investigated by acidifying the aqueous portion through the addition of different formicacid concentrations at 0%,0.05%,0.1%,0.2%,0.5%,and 1.0%(v/v). Significantly improved peak symmetry and signal response values were obtained at the formic acid concentration of≥0.1%.Thus,water with 0.1%(v/v)formic acid and acetonitrile with 0.1%(v/v)formic acid were finally selected as the mobile phase for gradient elution.
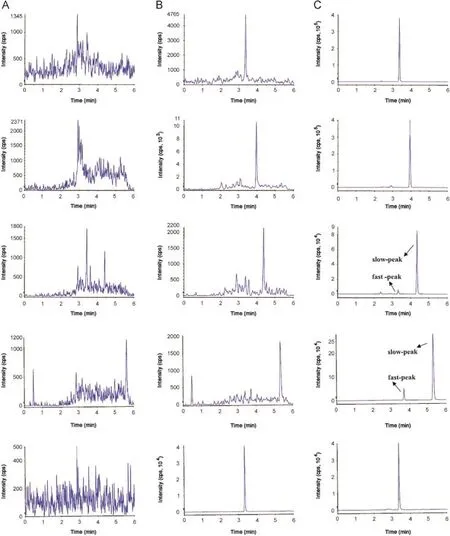
Fig.4.Typical chromatograms of(A)blank rat blood;(B)blank rat blood spiked with Sudan I,Sudan II,Sudan III,and Sudan IV at LLOQ of 0.2 μg/L and IS of 2.0 μg/L;(C)rat blood sample obtained at 40 min and 5 h after a single oral administration of 50 mg/kg of Sudan I,Sudan II,Sudan III,Sudan IV,and IS(2.0 μg/L).
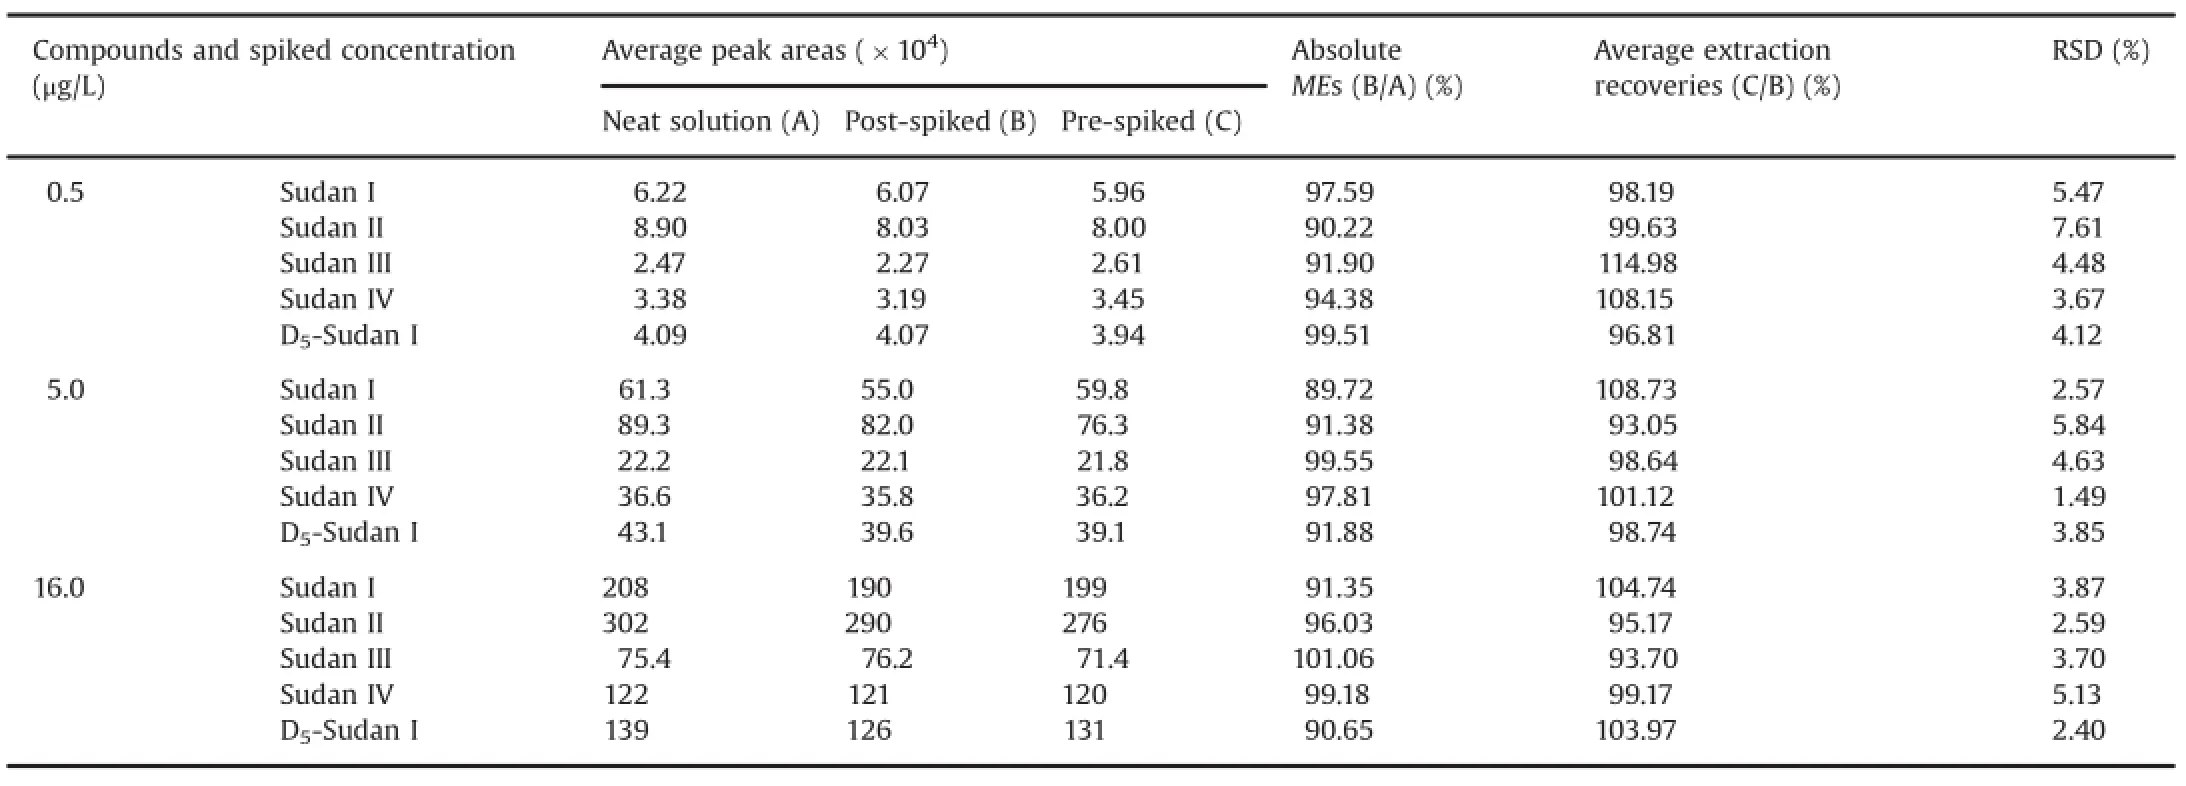
Table 2Mean extraction recoveries and MEs of Sudan I,Sudan II,Sudan III,Sudan IV,and IS in SD rat whole blood samples(n=6).

Table 3Intra-day and inter-day accuracy and precision values for the determination of the four analytes(n=3 days,six replicates per day).
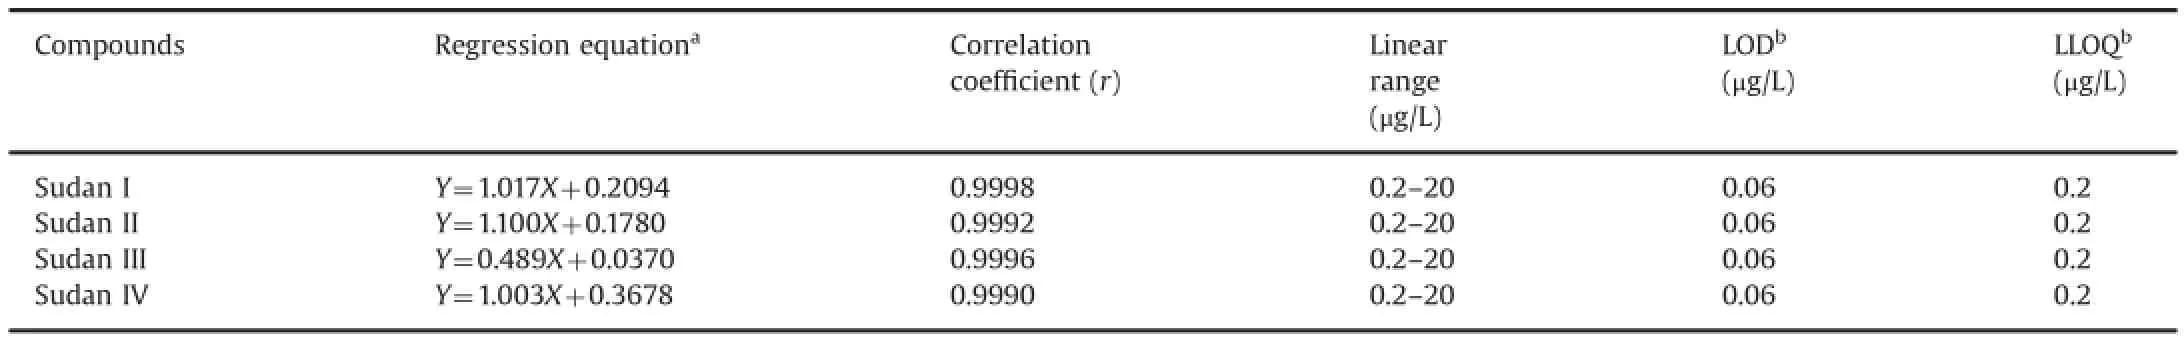
Table 4Regression equations,linear ranges,LODs,and LLOQs of the four analytes.
In this study,the ESI-MS/MS behavior of four Sudan dyes was investigated in MRM mode.At a cone voltage of 25 V,the full-scan ESI(+)-MS spectra of the analytes showed only the protonated molecule[M+H]+,thereby confirming the molecular mass.Under ESI-MS/MS conditions,the product-ion mass spectra of Sudan dyes showed a characteristic fragmentation pattern for all the analytes,as shown in Fig.3.The protonated form of each analyte and IS,[M+H]+ion,was the parent ion in the Q1 spectrum and was used as the precursor ion to obtain the Q3 product ion spectra. The most sensitive mass transition was monitored at m/z 249.1→93.0 for Sudan I,m/z 277.1→121.2 for Sudan II,m/z 353.1→77.0 for Sudan III,m/z 381.2→91.0 for Sudan IV,and m/z 254.1→98.0 for IS.
3.3.Photostability and“fast peaks”of Sudan III and Sudan IV
高度的近视,让我一生也没有接触过实实在在的东西。我只了解这个世界的一半。对亲人、同学和同事,我永远看不清他们实在的面孔和真实的灵魂。对世界的看法,我总有一种模糊的距离感。如此雾里看花,让我像一只迷途的羔羊。于是我成了一个自暴自弃的人。
Previous studies reported the appearance of“fast-eluting”peaks in the chromatograms of Sudan III and Sudan IV[10,11,19]. Given that these peaks eluted a few minutes before the main peak of the compounds,they were called“fast peaks”,which were proven by Mölder et al.[10]to be caused by photochemical isomers via MS.This phenomenon could lead to about 10%-35% quantitative errors for Sudan III and Sudan IV if lightning conditions were not controlled.However,photo-induced isomerization was reversible when the compounds were stored in the dark or wrapped in aluminum foil for a sufficient time.
A considerable increase in the peak area of isomers was observed upon standing on the tray of the autosampler without protection from light,which confirmed the findings of Mölder et al.(Fig.4).The nature of“fast peaks”could not be avoided in routine conditions.Thus,they were integrated together with the normal peaks for analysis.Our results(see Section 3.4)showed that the“fast peaks”did not affect the accuracy of the analysis when all the peaks of one compound were integrated together,and the RSD and accuracy were satisfactory.
3.4.Method validation
3.4.1.Selectivity
Selectivity is defined as the ability of the bioanalytical method to measure a substance unequivocally and to discriminate between the analyte(s)and other components that may be present[32].Under optimized UFLC-MS/MS conditions,the rapid method yielded excellent selectivity and sensitivity for the analysis of Sudan I,Sudan II,Sudan III,Sudan IV,and IS in the blank whole blood samples(Fig.4).To demonstrate the selectivity of the method and to screen for interfering substances,three replicate analyses of six blank whole blood samples and blood spiked with the LLOQ were extracted and injected for analysis using the developed UFLC-MS/ MS method.The representative chromatograms of a blank rat blood sample and a blank rat blood sample spiked with four Sudan dyes(0.2 μg/L)are shown in Fig.4.No significant interfering endogenous peaks were observed at the retention times of the four Sudan dyes.Thus,according to the guidelines for industrial bioanalytical method validation(2001)[33],the method that we developed was selective.
3.4.2.ME
The details of the performed ME experiment are summarized in Table 2.The absolute MEs of the four compounds and IS ranged from 89.72%to 101.06%.An absent or insignificant ME in thedifferent sources was confirmed by the results,which agreed with the requirement of the guidelines for industry and bioanalytical method validation by the Food and Drug Administration[33].

Table 5Stability assessment for Sudan I,Sudan II,Sudan III,and Sudan IV in SD rat whole blood samples(n=3).
3.4.3.Precision and accuracy
The accuracy and precision results are shown in Tables 2 and 3,respectively.The mean recovery rates for the four compounds(n=6)of the three concentrations ranged from 93.05%to 114.98%. The intra-day RSDs for 0.5,5.0,and 16.0 μg/L ranged from 1.6%to 6.2%,and their inter-day RSDs for 0.5,5.0,and 16.0 μg/L ranged from 1.3%to 4.8%.Thus,the repeatability and recovery of the assay were within the acceptance limits of±15%at the tested concentration levels.
3.4.4.Linearity,limit of detection(LOD),and LLOQ
The calibration model was selected based on the analysis of the data by linear regression with intercepts and 1/x2weighting factor by using the Least-Squares Refinement method.The linear calibration curves were plotted as the peak area ratio of the analyte to IS(Y)versus the target-compound mass-concentration ratios of the analyte to IS(X).Representative linear equations of the four compounds in rat whole blood are listed in Table 4.Each standard point in every calibration curve was back-calculated using its own equation.The linearities of the calibration curves were between 0.2 and 20.0 μg/L,and the correlation coefficients(r)of the four compounds were≥0.999.
LODs were established based on signal-to-noise(S/N)ratio of 3,whereas LLOQs were established based on an S/N ratio of 10.The LODs for the four compounds in the injection solutions were estimated to be 0.06 μg/L.Based on the acceptable precision and accuracy,the LLOQ was 0.2 μg/L in the injection solutions,as shown in Table 4.
3.4.5.Stability
The results for freeze-thaw cycle stability and short-term stability under room temperature at 0.2,0.5,5.0,and 16.0 μg/L levels of the four compounds in rat whole blood are shown in Table 5.No significant degradations(<14.5%for short-term stability under room temperature,<13.5%for freeze-thaw cycle stability,and<8.5%for long-term stability)were observed for the four compounds.Results show that the four compounds were stable under the investigated conditions because the measured concentrations werewithintheacceptablelimits(≤15%ofthenominal concentrations).
3.5.Pharmacokinetic study
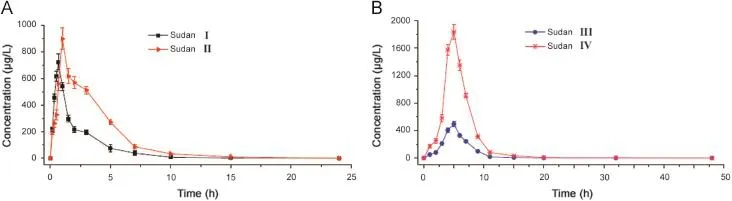
Fig.5.Mean blood concentration-time curves of Sudan I and Sudan II(A),and Sudan III and Sudan IV(B)in six SD rats after a single oral administration of 50 mg/kg of Sudan dyes.
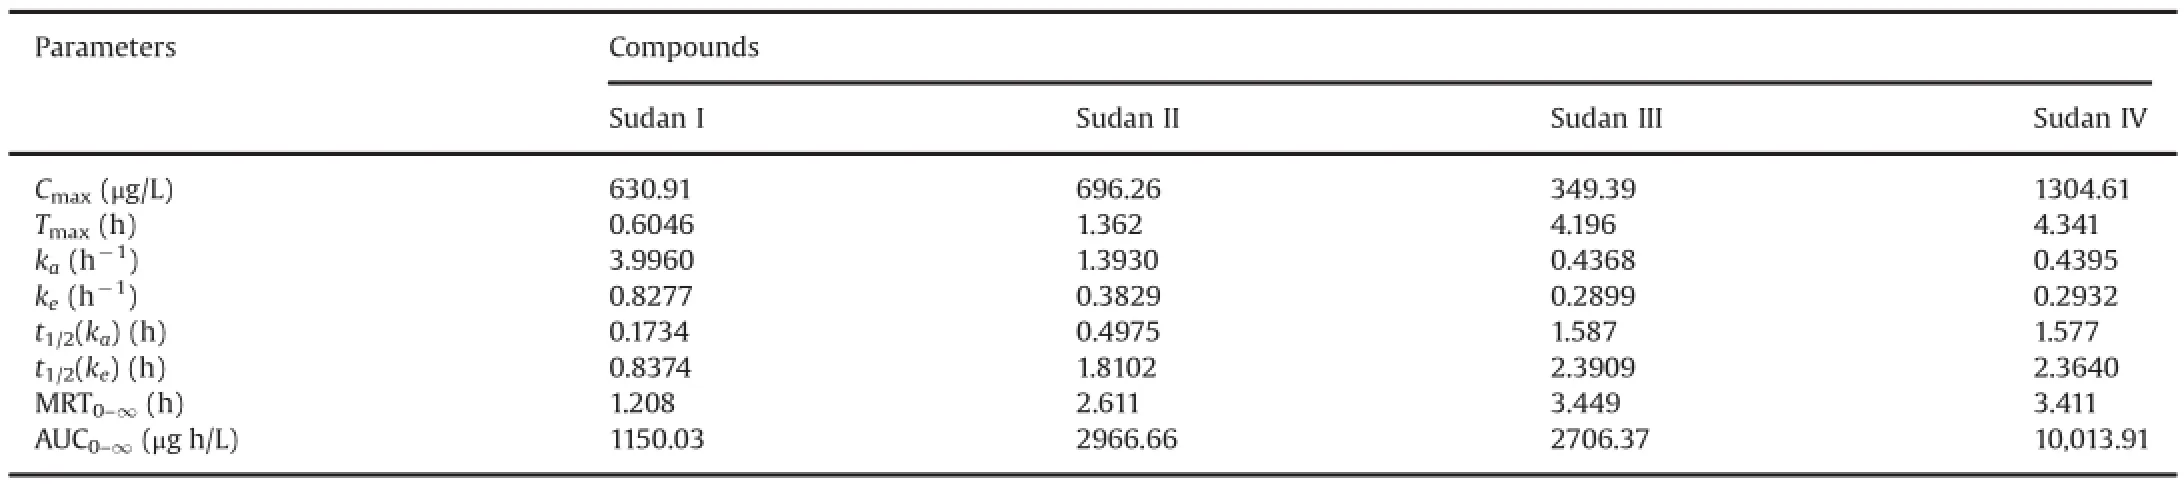
Table 6Pharmacokinetic parameters after oral administration of four Sudan dyes(50 mg/kg)to rats(n=6).
The method that we developed was successfully applied to the pharmacokinetic study after a single oral administration of 50 mg/ kg Sudan I,Sudan II,Sudan III,and Sudan IV to SD rats.Mean blood concentration-time profiles of Sudan I,Sudan II,Sudan III,and Sudan IV are shown in Fig.5.The major pharmacokinetic parameters of the four analytes were calculated using a non-compartment model using DAS 2.0 statistical software(Pharmacology Institute of China),and the results are shown in Table 6.These pharmacokinetic results demonstrated that Sudan I,Sudan II,Sudan III,and Sudan IV reached the maximum point in the whole blood drug concentration of rats at about 0.6046,1.362,4.196,and 4.341 h after oral administration,respectively.The whole blood concentration decreased gradually with an elimination half-life(t1/2)of 0.8374,1.8102,2.3909,and 2.364 h for Sudan I,Sudan II,Sudan III,and Sudan IV,respectively.The absorption rate constants(ka)of Sudan I,Sudan II,Sudan III,and Sudan IV were 3.996,1.393,0.4368,and 0.4395 h-1,which were significantly greater than their elimination rate constants(ke)of 0.8277,0.3829,0.2899,and 0.2932 h-1,respectively.The four Sudan dyes were easily absorbed and quickly accessible to the loop body of the SD rats.The phenomenon of rapid absorption possibly involves the specific and lipophilic chemical properties of the four Sudan dyes.Given the double phospholipid compositions of the cell membrane of the rat,the lipophilic Sudan dyes successfully and rapidly accessed the organic body.These results were in accordance with the maximum blood concentrations achieved at 630.91,696.26,349.39,and 1304.61 μg/L for Sudan I,Sudan II,Sudan III,and Sudan IV,respectively.Theareasundertheconcentration-timecurve(AUC0-∞)of Sudan I,Sudan II,Sudan III,and Sudan IV were 1150.03,2966.66,2706.37,and10,013.91 μg h/L,respectively,which indicated the high bioavailability of the four analytes.The successful application of the UFLC-MS/MS method to the pharmacokinetic study of four Sudan dyes suggested its suitability and sufficiency for use in pharmacokinetic studies.
4.Conclusions
In this study,a sensitive and rapid UFLC-MS/MS method was developed and validated for determination of Sudan I,Sudan II,Sudan III,and Sudan IV levels in rat whole blood.The established method was fast,precise,accurate,specific,reproducible,and suitable for the pharmacokinetic study of Sudan I,Sudan II,Sudan III,and Sudan IV.The validated method was sufficiently sensitive with an LLOQ of 0.2 μg/L.Thus,the method successfully determined the Sudan I,Sudan II,Sudan III,and Sudan IV levels,which ranged from 0.2 μg/L to 20.0 μg/L.UFLC-MS/MS is suitable for detailed assessment in pharmacokinetic,bioequivalence,and bioavailability studies.
Acknowledgments
We would like to thank the Zhejiang Provincial Natural Science Foundation(No.LY13B050003),the Zhejiang Provincial Analytical Foundation of China(No.2013C37089),the Zhejiang Province Medical Health Foundation,China(No.2013KYA187),the Ningbo Natural Science Foundation in Zhejiang(No.2011A610058),the Advanced Key Program of Agriculture and Social Development Funds of Ningbo,China(No.2011C11021),and the Zhejiang Provincial Program for the Cultivation of High-level Innovative Health Talents(No.2011H1132)for financial support of this research.
Appendix A.Supporting information
Supplementary data associated with this article can be found in the online version at http://dx.doi.org/10.1016/j.jpha.2015.03.001.
References
[1]M.Stiborová,V.Martínek,H.Rýdlová,et al.,Sudan I is a potential carcinogen for humans evidence for its metabolic activation and detoxication by human recombinant cytochrome P450 1A1 and liver microsomes,Cancer Res.62(2002)5678-5684.
[2]M.Coulet,J.C.Leblanc,R.Woodrow Setzer,Application of the margin of exposure(MoE)approach to substances in food that are genotoxic and carcinogenic:EXAMPLE 12:Sudan I(CAS No.842-07-9),Food Chem.Toxicol.48(2010)S106-S111.
[3]K.K.Mishra,S.Dixit,S.K.Purshottam,et al.,Exposure assessment to Sudan dyes through consumption of artificially coloured chilli powders in India,Int.J. Food Sci.Technol.42(2007)1363-1366.
[4]L.H.Ahlstrom,C.S.Eskilsson,E.Bjorklund,Determination of banned azo dyes in consumer goods,Trends Anal.Chem.24(2005)49-56.
[5]A.Downham,P.Collins,Colouring our foods in the last and next millennium,Int.J.Food Sci.Technol.35(2000)5-22.
[6]Commission Decision of 23 May 2005 on Emergency Measures Regarding Chilli Products,Curcuma and Palm Oil,(2005/402/EC)L135/34 Official Journal of the European Union.
[7]Y.Fan,M.Chen,C.Shentu,et al.,Ionic liquids extraction of Para Red and Sudan dyes from chilli powder,chilli oil and food additive combined with high performance liquid chromatography,Anal.Chim.Acta 650(2009)65-69.
[8]R.Noguerol-Cal,J.M.López-Vilariño,G.Fernández-Martínez,et al.,High-performance liquid chromatography analysis of ten dyes for control of safety of commercial articles,J.Chromatogr.A 1179(2008)152-160.
[9]P.Qi,T.Zeng,Z.Wen,et al.,Interference-free simultaneous determination of Sudan dyes in chili foods using solid phase extraction coupled with HPLCDAD,Food Chem.125(2011)1462-1467.
[10]K.Mölder,A.Künnapas,K.Herodes,et al.,“Fast peaks”in chromatograms of Sudan dyes,J.Chromatogr.A 1160(2007)227-234.
[11]C.K.Zacharis,F.S.Kika,P.D.Tzanavaras,et al.,Development and validation of a rapid HPLC method for the determination of five banned fat-soluble colorants in spices using a narrow-bore monolithic column,Talanta 84(2011)480-486.
[12]Y.Zhang,Z.Zhang,Y.Sun,Development and optimization of an analytical method for the determination of Sudan dyes in hot chilli pepper by highperformance liquid chromatography with on-line electrogenerated BrO-luminol chemiluminescence detection,J.Chromatogr.A 1129(2006)34-40.
[13]Y.H.Qi,W.C.Shan,Y.Z.Liu,et al.,Production of the polyclonal antibody against Sudan 3 and immunoassay of Sudan dyes in food samples,J.Agric.Food Chem. 60(2012)2116-2122.
[14]Y.Wang,D.Wei,H.Yang,et al.,Development of a highly sensitive and specific monoclonal antibody-based enzyme-linked immunosorbent assay(ELISA)for detection of Sudan I in food samples,Talanta 77(2009)1783-1789.
[15]D.Han,M.Yu,D.Knopp,et al.,Development of a highly sensitive and specific enzyme-linked immunosorbent assay for detection of Sudan I in food samples,J.Agric.Food Chem.55(2007)6424-6430.
[16]E.Mejia,Y.Ding,M.F.Mora,et al.,Determination of banned Sudan dyes in chili powder by capillary electrophoresis,Food Chem.102(2007)1027-1033.
[17]M.J.Du,X.G.Han,Z.H.Zhou,et al.,Determination of Sudan I in hot chili powder by using an activated glassy carbon electrode,Food Chem.105(2007)883-888.
[18]L.Ming,X.Xi,T.Chen,et al.,Electrochemical determination of trace Sudan I contamination in chili powder at carbon nanotube modified electrodes,Sensors 8(2008)1890-1900.
[19]C.Schummer,J.Sassel,P.Bonenberger,et al.,Low-level detections of Sudan I,II,III and IV in spices and chili-containing foodstuffs using UPLC-ESI-MS/MS,J. Agric.Food Chem.61(2013)2284-2289.
[20]F.Calbiani,M.Careri,L.Elviri,et al.,Development and in-house validation of a liquid chromatography-electrospray-tandem mass spectrometry method for the simultaneous determination of Sudan I,Sudan II,Sudan III and Sudan IV in hot chilli products,J.Chromatogr.A 1042(2004)123-130.
[21]F.Mazzotti,L.Di Donna,L.Maiuolo,et al.,Assay of the set of all Sudan azodye(I,II,III,IV,and Para-Red)contaminating agents by liquid chromatography-tandem mass spectrometry and isotope dilution methodology,J. Agric.Food Chem.56(2007)63-67.
[22]C.Ferrer,A.R.Fernández-Alba,I.Ferrer,Analysis of illegal dyes in food by LC/ TOF-MS,Int.J.Environ.Anal.Chem.87(2007)999-1012.
[23]J.Lau,C.K.Meng,J.Gushue,et al.,Analyzing Compounds of Environmental Interest Using an LC/Q-TOF—Part 1:Dyes and Pigments,Agilent Technologies Publication,5989-9336EN,August 2008.
[24]F.Calbiani,M.Careri,L.Elviri,et al.,Accurate mass measurements for the confirmation of Sudan azo-dyes in hot chilli products by capillary liquid chromatography-electrospray tandem quadrupole orthogonal-acceleration time of flight mass spectrometry,J.Chromatogr.A 1058(2004)127-135.
[25]Y.Fang,M.Zumwalt,Using TOF for Screening and Quantitation of Sudan Red Colorants in Food,Agilent application,Available from:〈http://www.agilent. com/〉.
[26]B.K.Matuszewski,M.L.Constanzer,C.M.Chavez-Eng,Strategies for the assessment of matrix effect in quantitative bioanalytical methods based on HPLC-MS/MS,Anal.Chem.75(2003)3019-3030.
[27]A.Lévèques,L.Actis-Goretta,M.J.Rein,et al.,UPLC-MS/MS quantification of total hesperetin and hesperetin enantiomers in biological matrices,J.Pharm. Biomed.Anal.57(2012)1-6.
[28]G.Lüthi,V.Blangy,C.B.Eap,et al.,Buprenorphine and norbuprenorphine quantification in human plasma by simple protein precipitation and ultra-high performance liquid chromatography tandem mass spectrometry,J.Pharm. Biomed.Anal.77(2013)1-8.
[29]Y.Ling,Z.Li,M.Chen,et al.,Analysis and detection of the chemical constituents of Radix Polygalae and their metabolites in rats after oral administration by ultra high-performance liquid chromatography coupled with electrospray ionization quadrupole time-of-flight tandem mass spectrometry,J. Pharm.Biomed.Anal.85(2013)1-13.
[30]E.Marchei,E.Papaseit,O.Q.Garcia-Algar,et al.,Determination of atomoxetine and its metabolites in conventional and non-conventional biological matricesby liquid chromatography-tandem mass spectrometry,J.Pharm.Biomed. Anal.60(2012)26-31.
[31]H.Wu,J.Guo,S.Chen,et al.,Recent developments in qualitative and quantitative analysis of phytochemical constituents and their metabolites using liquid chromatography-mass spectrometry,J.Pharm.Biomed.Anal.72(2013)267-291.
[32]F.T.Peters,H.H.Maurer,Bioanalytical method validation and its implications for forensic and clinical toxicology-a review,Accredit.Qual.Assur.7(2002)441-449.
[33]U.S.Department of Health and Human Services Food and Drug Administration,Center for Food Safety and Applied Nutrition,Guidance for Industry Bioanalytical Method Validation,2001.
17 April 2014
in revised form
http://dx.doi.org/10.1016/j.jpha.2015.03.001
2095-1779/©2015 Xi'an Jiaotong University.Production and hosting by Elsevier B.V.All rights reserved.This is an open access article under the CC BY-NC-ND license
(http://creativecommons.org/licenses/by-nc-nd/4.0/).
☆Peer review under responsibility of Xi'an Jiaotong University.
.Tel.:+86 574 87086437;fax:+86 574 87085078. E-mail address:nbhcs1967@163.com(C.Huang).
杂志排行

Journal of Pharmaceutical Analysis的其它文章
- Quantitative bioanalytical and analytical method development of dibenzazepine derivative,carbamazepine:A review☆
- Development and validation of a GC-FID method for quantitative analysis of oleic acid and related fatty acids☆
- Fabrication of multiwalled carbon nanotube-surfactant modified sensor for the direct determination of toxic drug 4-aminoantipyrine☆
- Multi-spectroscopic investigation of the binding interaction of fosfomycin with bovine serum albumin☆
- Identification,synthesis and characterization of process related impurities of benidipine hydrochloride,stress-testing/stability studies and HPLC/UPLC method validations☆
- Simultaneous quantitation of folic acid and 5-methyltetrahydrofolic acid in human plasma by HPLC-MS/MS and its application to a pharmacokinetic study☆