The characteristics of oasis urban expansion and drive mechanism analysis: a case study on Ganzhou District in Hexi Corridor, China
2015-10-28HuaLiTongPeiJiShiGuoFengZhuAprilPearsonQianGuoLiYuanFengLiuHaiLongLiu
HuaLi Tong, PeiJi Shi*, GuoFeng Zhu,2, April Pearson, QianGuo Li, YuanFeng Liu, HaiLong Liu
1. College of Geography and Environmental Science, Northwest Normal University, Lanzhou, Gansu 730070, China
2. State Key Laboratory of Cryosphere Sciences, Cold and Arid Regions Environmental and Engineering Research Institute, Chinese Academy of Sciences, Lanzhou, Gansu 730000, China
The characteristics of oasis urban expansion and drive mechanism analysis: a case study on Ganzhou District in Hexi Corridor, China
HuaLi Tong1, PeiJi Shi1*, GuoFeng Zhu1,2, April Pearson1, QianGuo Li1, YuanFeng Liu1, HaiLong Liu1
1. College of Geography and Environmental Science, Northwest Normal University, Lanzhou, Gansu 730070, China
2. State Key Laboratory of Cryosphere Sciences, Cold and Arid Regions Environmental and Engineering Research Institute, Chinese Academy of Sciences, Lanzhou, Gansu 730000, China
Ganzhou District is an oasis city in the Zhangye Municipality of Gansu Province, China. Based on multi-temporal TM and ETM satellite remote sensing data in 1985, 1996, 2000, and 2012, and by using corrected figures of land use status over the same periods, the spatial area of Ganzhou District since 1985 was extracted with statistical methods, and urban spatial expansion was measured by quantitative research methods. The characteristics of spatial expansion of Ganzhou District were analyzed by urban expansion rate, expansion intensity index, compactness, fractal dimension, and the city center shift method. The results showed that the built-up area of Ganzhou District increased by 3.46 times during 1985–2012. The expansion in 1985–1996 was slow, during 1996–2000 it was rapid, and during 2000–2012 it was at a high speed. This city mainly expanded to the northeast and northwest. Government decision making had a decisive influence on urban expansion. Initially the expansion was uniform, but later the local transportation, economy, resources, population, and national policies factors had an obvious influence on urban expansion.
oasis cities; Ganzhou District; urban expansion; GIS
1 Introduction
The progress and patterns of urban expansion are vital characteristics of regional urbanization and urban regionalization. They are a comprehensive reflection of urban mobility and urban system structure evolution (He and Cui, 2000). In recent years, with the rapid advance of China's urbanization, urban space expanded sharply. Under the influence of internal and external factors, various characteristics in the extension process warrant a scientific explanation.
Previously, foreign scholars studied urban spatial expansion from the perspectives of urban morphology and function (Camagni et al., 2002; Herold et al., 2003), humanistic care (Deakin et al., 2002), and spatial mechanisms (Angel et al., 2005; Batisani and Yarnal, 2009; Garcia-López and Muñiz, 2011), and these theories are becoming more complete. The research mainly focused on the scale, speed, and patterns of typical urban spatial expansions in different countries and regions, as well as the relationships between nature conservation, population change, and economic development. Regional differences, contexts, and reasons of those expansions have been ana-lyzed (Xu et al., 2007; Qiao et al., 2008; Wu et al., 2008; Xu et al., 2009; Garcia-López and Muñiz, 2011; Zhang et al., 2012), mainly through identification of spatial expansion driving forces, system dynamic analysis, and space models, combined with qualitative and quantitative analyses (Ma et al., 2000; Wu et al., 2005; Hu et al., 2006; Han, 2007). Simulation and prediction research on urban space growth has been carried out from the perspectives of people and the environment, agglomeration economy and economic growth, resource-intensive economic utilization, distribution of multiple perspectives, and the situation of natural enterprise growth, social and economic development, and regional characteristics (Chen and Liu, 2001; Wu and Zhu, 2001; Huang et al., 2008; Vaz et al., 2012). For our research methods, we used mathematical statistics, remote sensing, GIS, and computer simulation modules, combined with spot investigation and quantitative and qualitative analyses.
Domestic research on urban space started relatively late. In 1980, Soong Chiatai first addressed the concept of "urban area" and advocated research from the angle of regional urban development (Soong, 1980), which is significant for urban system planning and the scientific division of urban economic zones. After this, the urban system development process, organization structure, and function mechanism were studied in China (Zhang et al., 2000; Li et al., 2007). In the mid and late 1990s, with the application of remote sensing and GIS technology, geographers began using remote sensing data to monitor the urban expansion process (Fu, 1995; Chen and Xu, 2005; Fang et al., 2008). After 2000, the structure of Chinese urban regionalization emerged and urban areas expanded at an unprecedented rate. The population is increasing significantly and the urban spatial evolution is becoming a hot spot in research (Gong and Xia, 2008; Li et al., 2011). Che et al. (2011) discussed the characteristics and driving forces of the evolution of Yangtze River Delta metropolitan area towns, and Ma et al. (2008) quantitatively measured the evolution patterns of urban expansion.
In domestic and foreign research, the theory and practice of urban spatial expansion have evolved from static to dynamic, from small scale to large scale, and from structure analysis to discussion of the underlying mechanisms (Feng et al., 2010). With the acceleration of economic globalization and regional integration, urban communities emerged as the cores of cities. Urban space was restructured by the new theory of international labor division.
Presently, urban spatial expansion research in China is mainly focused on developed coastal cities, such as Beijing, Shanghai, Guangzhou, Xi'an, Nanjing, Chongqing, and Xiamen; there is little quantitative research on small urban spatial expansion, especially in the underdeveloped western area of China which has a fragile ecological environment. In arid areas, the oasis cities incur most of the human activities; they are the centers of population, resources, and economic activity in the northwest arid areas of China. Accordingly, these areas are the sites of the greatest conflict between human development and fragile ecological environments. Since the mid 1990s, with the rapid changes of soil and water resource utilization and urban spatial growth patterns, environmental problems have continuously emerged in the Hexi Corridor. In recent years, research on oasis city spatial expansion has mainly focused on the characteristics of typical urban land expansion, their mechanisms, and the evolution of distribution and extension patterns (Liu et al., 2003). With the rapid advance of urbanization and further implementation of the so-called westward development strategy (the establishment of a national spatial development pattern and economic belts), the Hexi Corridor and its towns will have new development opportunities, so it is urgent to study the structure of oasis towns, their characteristics and growth mechanisms, and the process of urban spatial expansion.
This paper investigates the expansion intensity, compactness index, fractal dimension index, and extension index of Ganzhou District in Zhangye City. Satellite remote sensing data, combined with socio-economic statistics and comprehensive analysis of the driving forces of urban expansion, were used in this study.
2 Study area
Ganzhou District is located in the middle of the Hexi Corridor in the Heihe River Basin, Gansu Province of China, which is between 100°06'E–100°52'E and 38°32'N–39°24'N. The area has a temperate continental climate, which is very dry. The territory is composed of the Qilian Mountains, Heli Mountain, and various hills and plains; the south and north are mountainous and the central area has vast plains. The Heihe River, Shandan River, Suyoukou River, Dayekou River, and others run through and form the Zhangye Oasis. It is 65 km from east to west, and 98 km from north to south, with a total area of 4,240 km2. The average annual rainfall is 113–120 mm, annual evaporation is 2,047 mm, and water is the main constraint on regional development. It is a major grain area in Northwest China (Figure 1) and is the largest commodity grain base in the Hexi Corridor.
Ganzhou District is an important city in the Xi-Long-Hai Lanxin Railway economic zone, and is one of the tourist cities on the Silk Road; it is designated as an official Chinese historical and cultural city. At the end of 2012 its total population was 517,000,189,500 (36.6%) of which was urban. The State Road 312 (511.14 km) and Line 227 of the Lan-Xin Railway (58.6 km) run in parallel across the region. Provincial roads, county roads, and township roads crisscross the region, making transportation very convenient. But as an oasis city in the arid inland area, Ganzhou District is facing a problem: the shortage of space for continued urban expansion, which is severely restricted by the industrial cluster and the population concentration.

Figure 1 The geographical location of Ganzhou District
3 Data and methodology
3.1Data
Remote sensing data were obtained from the USGS website (http://glovis.usgs/Imgviewer) and the International Science Data Services Platform of the Chinese Academy of Sciences Computer Network Information Center (http://datemirror.csdb.cn). This included 30m×30m Landsat TM (July in 1985 and July in 1996) and 15m×15m Landsat ETM (July in 2000 and May in 2012) satellite remote sensing images. By using a topographic map (1:100,000) of the study area as a benchmark, the images were obtained after geometric correction through a cubic polynomial model. The error was controlled within one pixel. Visual interpretation and supervised classification methods were used to extract the urban built-up areas and oasis areas in different years. The socio-economic data were obtained from the Gansu Statistics Yearbook (GSB, 2012) and Ganzhou District Statistic Bulletin in the corresponding years.
3.2Methodology
There are various measuring indicators of urban expansion. In this paper, the characteristics of urban spatial expansion in Ganzhou District are summarized by analyzing the expansion speed, expansion intensity index, compactness index, fractal dimension, the city center shift model, and the fan analysis method.
3.2.1The expansion rate and expansion intensity index
The expansion rate (AGA) and expansion intensity index (AGR) are the main indicators which describe the characteristics of urban expansion. AGA indicates the average expansion area of a city within a certain period, and has this absolute expansion:

The AGR indicates the annual growth rate of urban areas, which has this relative expansion (Chen and Liu, 2001):

In these equations, AGA is the urban expansion rate; AGR is the urban expansion intensity index;UAn+iand UAirepresent the built-up area in the year of n+i and n, respectively; and n is the time of year.
3.2.2Compactness index
The compactness index is a reflection of the shape of the feature parameters; the variation of compactness indicates the spatial characteristic of urban land expansion. Its equation is:

In this equation, BCI is the compactness index of urban land, A is the urban built-up area, and P is the perimeter outline of the urban districts. The BCI value is 0–1; the larger the value, the more compact the shape (Liu et al., 2003).
3.2.3Fractal dimension index
The fractal dimension index indicates the spatial occupation situation; the greater the dimensions, the greater the chance of containing fractal units in the regional space. Some frequently used fractal dimensions include the Hausdorff dimension, box dimension, similar dimension, information dimension, and correlation dimension. In the study of urban expansion, urban area and perimeter are the basic measurement features. Therefore, fractal characteristics of spatial expansion are obtained by calculating the perimeter and area (Fu, 1995):

For individual square plaques, the constant K=4; then P=4(AD/2), so that:
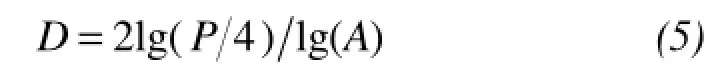
In this equation, D is the fractal dimension; P is the perimeter; and A is the area of the patch.
3.2.4Space center shift model
The space center is an important indicator describing the spatial distribution of geographic objects. It is commonly used in the study of the evolution of urban forms and changes in the land use type. Here, the space center and the city center shift distance formulas of Zhang et al. (2000) were used to analyze the urban expansion. The equations are:


In Equations (6) and (7), Qxis the integral of the x-axis; Qyis the integral of the y-axis; yi+1-yiis the difference between two adjacent point value in the y-axis; xi+1-xiis the difference between the two adjacent point value in the x-axis; X is the center of gravity abscissa of geographic units in a certain period, Y is the center of gravity ordinate of geographic units in a certain period, and Dt+1is the gravity transfer distance (OD) of geographic units from t to t+1.
3.2.5Fan analysis method
The fan analysis method is commonly used for urban expansion analysis. The center of the study area is selected, the radius is then divided into a number of fan-shaped areas, and then the areas are overlaid on the land pattern. Thus, the area of each sector in different time periods is obtained. We analyzed different time periods of each sector's expansion scale and intensity, enabling the quantitative analysis of differentiation of urban expansion rates in all the studied places at different times (Li et al., 2007).
4 Results
4.1Expansion process of built-up area in Ganzhou District
During 1985–2000, there was slow expansion of built-up areas in Ganzhou District. From 1985 to 1996, the city mainly expanded to the east and west; from 1996 to 2000, it continued to expand to the west, but not so much in the other directions (Figure 2). During the period of 2000–2012, there was a substantial built-up area expansion in all directions; the expansions to the northeast, east, south, and northwest were more obvious, and the expansion to the northeast was the most prominent. Scattered expansion emerged between 1996 and 2000; after 2000, the expansion extended toward the northeast, while the northwest had ribbon extensions. The city expanded along the highways and railways, showing significant traffic-oriented expansion. Overall, from 1985 to 2012, the morphology of Ganzhou District evolved from homogeneous expansion to a strip-shape expansion (Figure 3).
4.2Spatial analysis of the built-up area expansion in Ganzhou District
4.2.1Urban expansion speed and intensity index
According to the expansion rate (AGA) and ex-pansion intensity index (AGR) Equations (1) and (2), the relevant data of the built-up areas in Ganzhou District could be calculated (Table 1).
During 1985–1996, the built-up area in Ganzhou District was expanded to 894.1056 ha from 788.2816 ha (Table 1), the rate of expansion was 9.6203 ha/a, and the expansion intensity was 1.22% (Figure 4). During 1996–2000, the area increased to 941.8368 ha from 894.1056 ha, the expansion rate was 11.9328 ha/a, the expansion intensity was 1.335%; the expansion rate during these 8 years was faster than the prior 11 years. Then during 2000–2012, the expansion rate and the expansion intensity of the built-up area in Ganzhou District were more remarkable. The built-up area increased to 1,785.2544 ha, and the expansion rate of 162.2958 ha/a was 13 times the rate during 1996–2000 (Table 2). The expansion intensity, 17.2318%, was 17 times greater than in 1996–2000. During 2000–2012 the expansion rate accelerated and the growth intensity was enhanced.

Figure 2 The expansion diagram of built-up areas in Ganzhou District
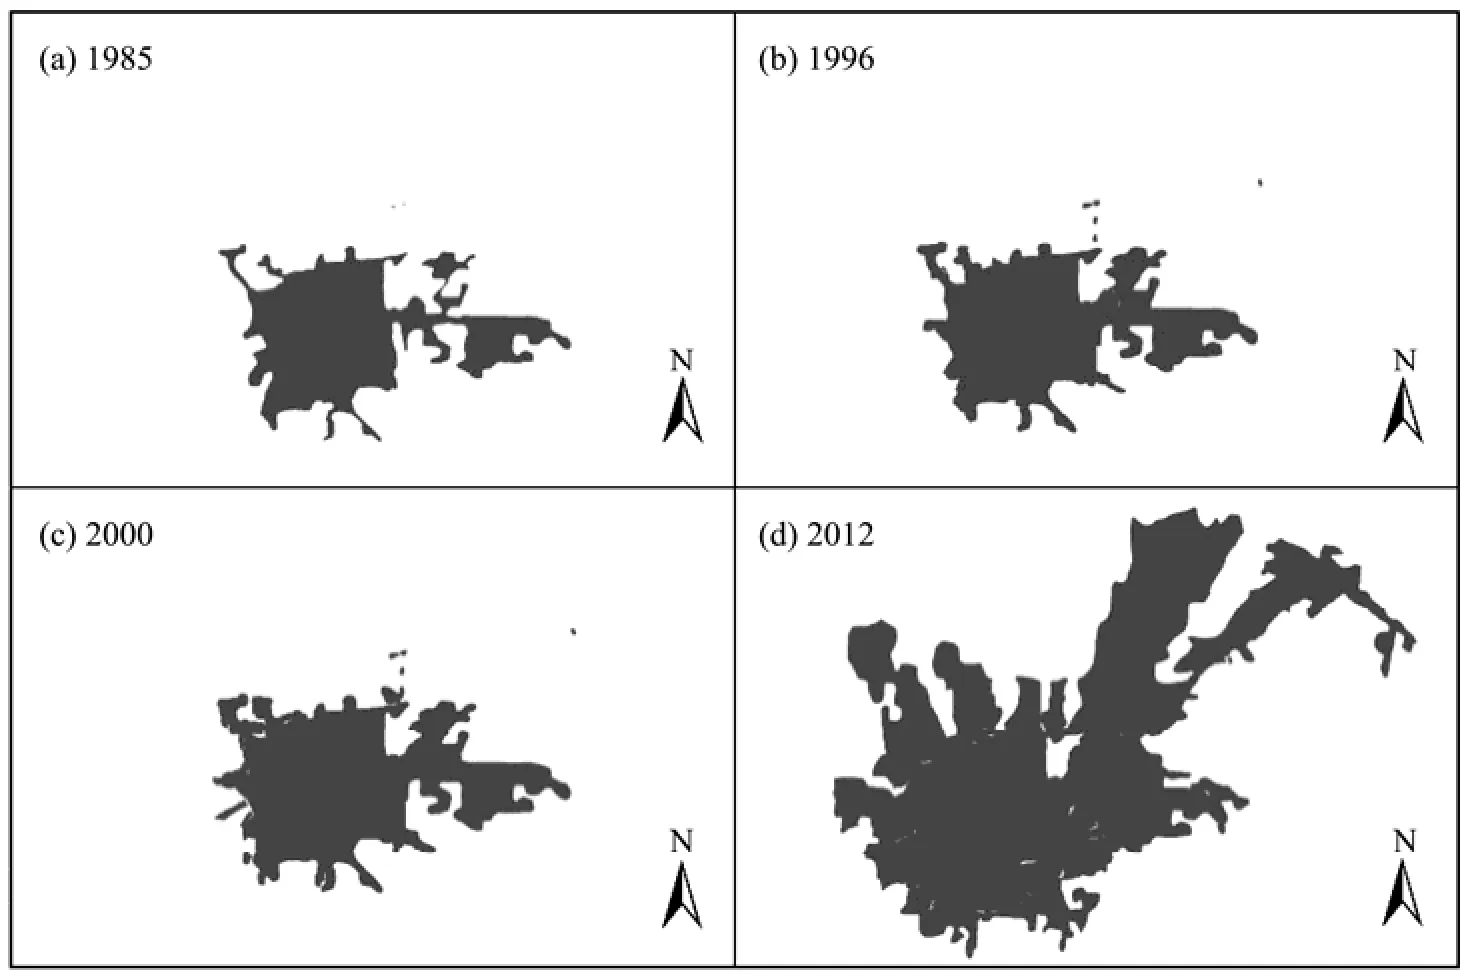
Figure 3 Urban morphology evolution trajectory diagram of built-up areas in Ganzhou District
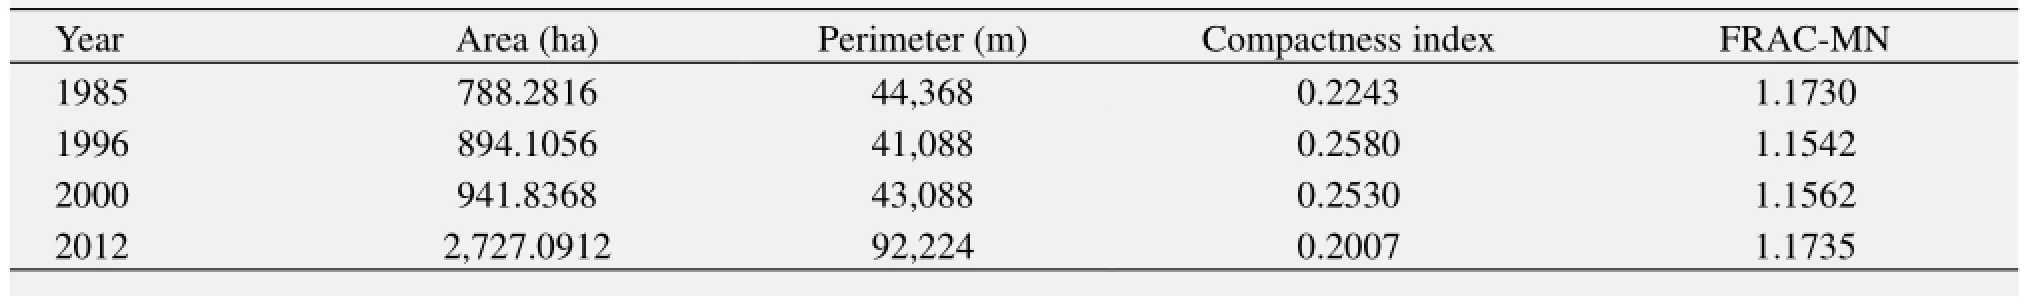
Table 1 The urban expansion during 1985–2012
4.2.2Compactness index and fractal dimension of urban expansion
Through quantitative research on compactness and fractal dimension of the Ganzhou District built-up area (Tables 1 and 2), it can be seen that the compactness index showed a slow decline trend after the previous growing trend (Figure 4). The compactness indices in 1985 and 1996 were similar to each other, being 0.2243 and 0.2580, respectively. The high compactness index resulted from the expansion of the city during 1985–1996. In 2000, the compactness index dropped to 0.2530; in 2012 it continued to decline to 0.2007. During this period, the expansion was influenced by government policies, economic development, and transportation factors, causing the built-up area of Ganzhou District to expand at a high speed in all directions.
The fractal dimension of the Ganzhou District built-up area showed an upward trend after an initial decline (Figure 4). The patch shape index was low in the built-up area and it expanded along with the old city. The fractal dimension in 2000 was 1.1562, and this rose to 1.1735 in 2012, indicating that the city shape became more complicated and irregular.
4.2.3The shift of the city center
To learn more about the spatial variation of the built-up area expansion in Ganzhou District, we analyzed the city center by using the space center Equation (6) and the city center shift distance Equation (7). The final result is shown in Figure 5.
During 1985–1996 and 1996–2000, the expansion of the city was mainly in the old town (Figure 5), so the center shift distance of the city center was small. By Equation (6), the distances were 324.74 m and 44.91 m, respectively. The city center mainly shifted to the northwest, and there was a small expansion to the north. In contrast, during 2000–2012 the city center shifted to the northeast and the shift distance was 2,258.97 m, showing that the city rapidly expanded to the northeast.
4.2.4Anisotropy of urban expansion
In order to accurately reveal the characteristics of the spatial expansion in Ganzhou District, we applied a fan analysis with a morphological evolution trajectory of the city. Ganzhou District can be described as a "bell tower" centered at 38°56'05"N, 100°27'32"E with an 8-km radius. The circle was divided into 16 equal fan-shaped areas, where the starting point was at 11.25° north by east, and then overlaid on the city shapes in 1985, 1996, 2000, and 2012. Then the areas of the urban expansion forms in each time period could be obtained by statistical analysis (Figure 6).
As Figure 6 shows, from 1985 to 1996 the urban expansion mainly focused in the W, NEE, and SE directions; during 1996–2000 the expansion was mainly in the SWW and NWW directions; and during 2000–2012 the expansion mainly occurred in the NE direction, followed by NNE, NEE, SSE, NNW, and NW. Obviously, during 2000–2012 the urban expansion expanded at a high speed in all directions, especially to the northeast, whereas in the past the expansion only occurred in a few directions.
We used Equation (2) to calculate the expansion intensity index of Ganzhou District during different periods, as shown in the radar chart in Figure 7. With the natural break method, the expansion intensity can be classified into three types: low-intensity, middle-intensity, and high-intensity (Figure 6). Expansion during the same period in the same type or close to a common direction constitutes the dominant urban expansion wing. Figure 7 shows the expansion characteristics of Ganzhou District in different directions during different periods.

Table 2 Expansion speed and expansion intensity in Ganzhou during 1985–2012
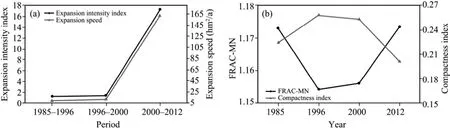
Figure 4 The expansion intensity speed, compactness index, and fractal dimension index variation in 1985–2012
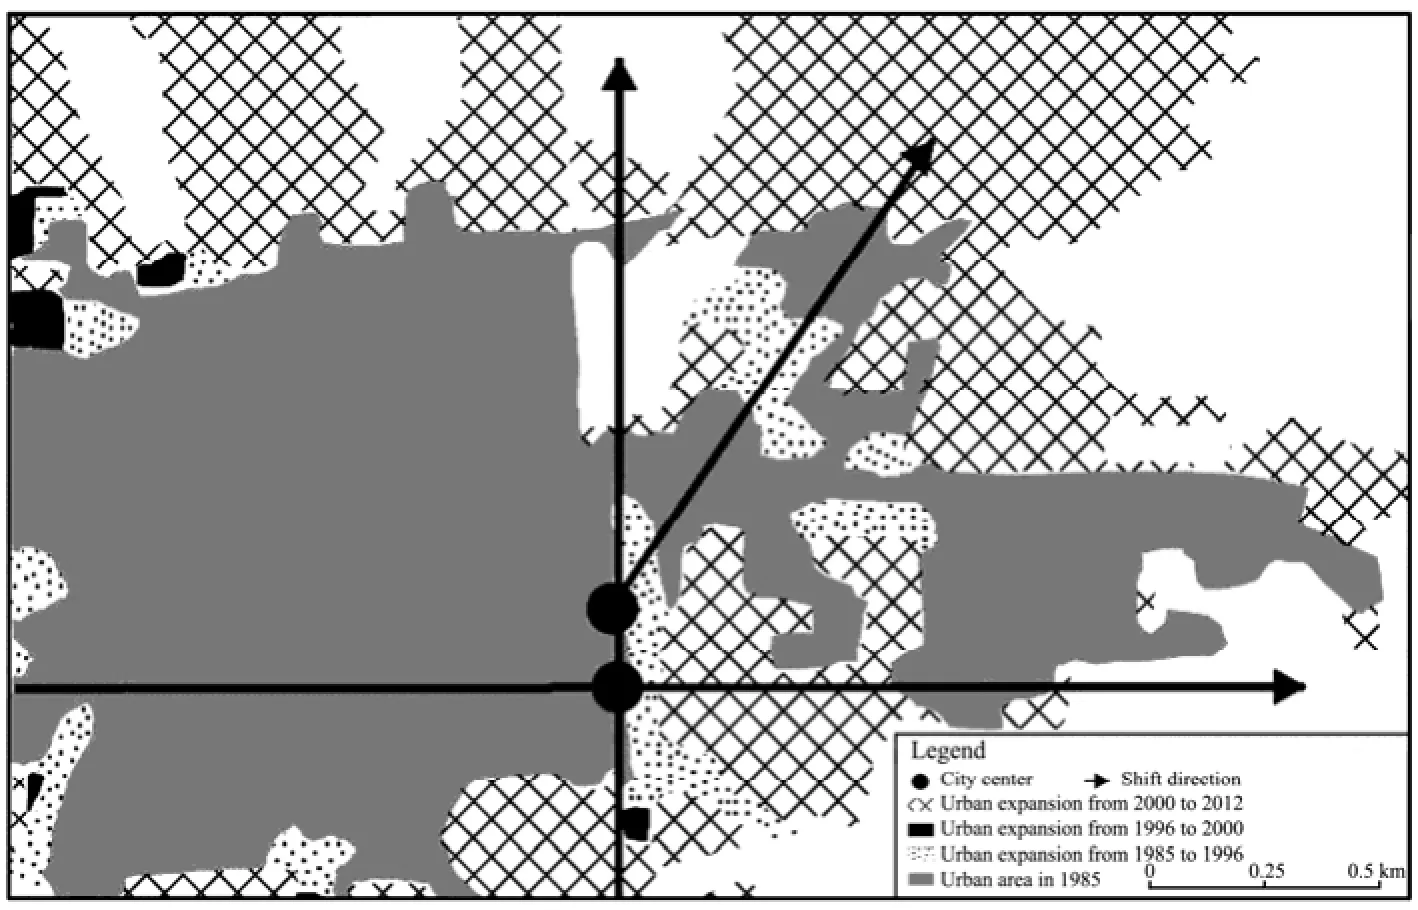
Figure 5 The shift of Ganzhou District's built-up area from the center (1985–2012)
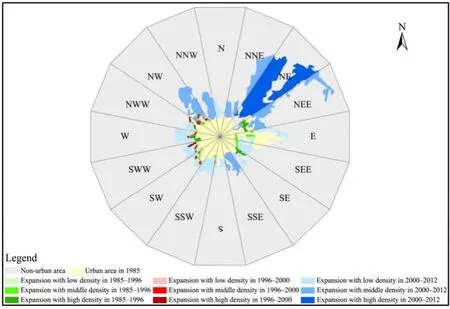
Figure 6 The sector division diagram of Ganzhou District from 1985–2012

Figure 7 Radar graphs of urban expansion intensity in different directions from 1985 to 2012
5 Discussion
5.1Socio-economic factors
To analyze the driving force factors of the spatial expansion of Ganzhou District, eight indicators closely linked with urban development were applied and statistical analysis software SPSS13.0 was used for the correlation analysis (Table 3). The specific indicators were GDP (RMB) (X1), the amount of capital investment (RMB) (X2), the GDP per capita (RMB) (X3), the primary industry to GDP (%) (X4), the secondary industry to GDP (%) (X5), the tertiary industry to GDP (%) (X6), the total population (X7), and the total retail sales of social consumption (RMB) (X8) (GSB, 2012).
5.1.1Economic factors
Gross domestic product (GDP) is an indicator to measure the economic development of a city. The correlation coefficient of GDP in Ganzhou District and its built-up area was 0.820 (0.05 confidence level) in 2012, a significantly positive correlation. In 1996 the GDP was 1.7177 billion Yuan, which rose to 11.55362 billion Yuan in 2012, which means it increased a total 572.62% (average annual growth rate of 38.2%). At the same time, the per capita GDP increased to 22,717 Yuan in 2012 from 3,802 Yuan in 1996; the growth rate in the 16 years was 497.50% (average annual growth rate of 33.17%), and the correlation coefficient with the built-up area was 0.814 (0.05 confidence level), another significantly positive correlation. GDP growth in Ganzhou District relied on a large number of capital investments. Such economic development not only provides sufficient capital for development and construction in the city, but also provides funding for the expansion of urban construction land.
The correlation coefficients of the primary, secondary, and tertiary industries with urban built-up area were -0.939 (0.01 confidence level), 0.983 (0.01 confidence level), and 0.719, respectively. This indicated that the correlation between the primary industry and the built-up area was significantly negative; that between the secondary industry and the built-up area was significantly positive; and that between the ter-tiary industry and the built-up area was insignificant. The GDP proportion of the primary industry showed a downward trend during 1996–2012, from 40.2% in 1996 to 25.5% in 2012. This indicated that the built-up area occupied a large amount of farmland and woodland during the expansion. The GDP of the secondary and tertiary industries showed an upward trend from 1996 to 2012, with growth rates of 8.7% and 6%, respectively. During the built-up area expansion, the secondary industry showed an upward trend which was consistent with its proportion change. There was a small increase in the tertiary industry but it was not significantly correlated with the expansion of the built-up area.

Table 3 Factor analysis of urban area expansion
5.1.2Population factor
Our analysis revealed that there was significant correlation, with correlation coefficient of 0.893 (0.05 confidence level), between the total population (X7) and the built-up area, which indicated that population growth was one of the main driving forces of urban expansion. Ganzhou District is located in the middle of the Heihe River Basin, with the moisture of the melt water and highly developed agriculture. As the population has grown, however, a large number of residents shifted from rural to urban areas. The total number of city residents increased from 461,800 in 1996 to 517,000 in 2012 (11.95% growth rate), and the residents of towns increased from 116,100 in 1996 to 189,500 in 2012 (63.22% growth rate). At the same time, the surrounding areas remained undeveloped and the education, employment, and medical care resources were not as good as in the city, so many residents of the Qilian Mountains or near the desert moved to the city. A reasonable population in a city is the fundamental indispensable element to guarantee normal production and consumption. On one hand, urban development requires a moderate amount of population, on the other hand it must avoid excessive population growth (Li, 1999). In Ganzhou District, the urban population, housing, industrial areas, and other developed land area increased, resulting in its expansion into suburbs surrounding the city.
5.1.3The basic construction investment factors
The statistics of Ganzhou District during 1996–2012 showed that capital investment increased from 20,870 Yuan to 443,100 Yuan, a growth rate of 21.2 times that of 1996. The correlation coefficient between the amount of capital investment and built-up area was 0.889 (0.05 confidence level), a significantly positive correlation. The rapid growth of infrastructure investment and authority investment promoted reconstruction, renovation, and expansion, resulting in the enlargement of the Ganzhou District area.
Because Ganzhou District is an oasis city with comparatively weak industry, it promotes its marketing economy and local benefits. The local government enlarged the built-up area and sold the land to the developers to attract foreign investment. As Table 1 shows, the built-up area increased from 941.8368 ha in 2000 to 2,727.0912 ha in 2012, and the direction was outward, not inward. Since 2000, with the strategy of westward development, both state and local investments were improved.
5.2The specificity of urban expansion in oasis towns
Natural geographical conditions are the basis of urban expansion. Southwest of Ganzhou District are the Qilian Mountains, east are Heli and Longshou Mountains, and in the center is a sloping plain forming a north-south parallel with the central Zhangye Basin sloping from south to north. Therefore, expansion to due north and south was not feasible. The expansion before 1996 was mainly in the central plains and basins, but with the growth of the city the central area was not large enough. Because the government had to protect the arable land, it developed the neglected land. Compared to the other directions, the northeast had open terrains and abundant water, allowing for the greater expansion of urban space in that direction.
Overall, urban spatial expansion in Ganzhou District has shown an upward trend, compared with the expansion in the eastearn China where the rate of urban expansion has been lower. The Ganzhou District expansion intensity also had a significant rising trend. The overall size of the city was small and the layout of urban space was generally loose, so the compact-ness was gradually increased; its urban spatial form tended to be simple and its urban land evolved in one intensive direction. The urban space experienced the expansion phases of "internal padding→external expansion→internal padding" because urban space expansion was not reasonable but there was external land available for urbanization.
Ganzhou District is a traditional agricultural town, and its development has been driven directly by agricultural development. Therefore, available water resources, which have a decisive impact on agriculture in arid areas, also affect urban spatial expansion. The city is an independent, complete system, and self-organization plays an important role in its development process. While the city location, topography and transportation are affecting the expansion of urban space, there are complex interactions between the various elements. Citizen preferences and desires regarding urban expansion and spatial layout are becoming more influential, and attention should be paid to elicit the intentions of citizens by various interviews and social survey methods.
5.3Influence of government planning and policy
Governmental actions and intentions that regarding urban expansion also have decisive influences on the socio-economic development, so it is worthwhile to study their impact on the processes and mechanisms of urban spatial expansion based on all levels of planning.
Since 2000, the extension of the northeast railway line and the establishment of industrial parks resulted in large-scale urban expansion in the northeast. In the Master Plan (2004–2020), the expansion of Zhangye City's built-up area primarily involved the main city area, the northeast industrial park, and a newly developed area to the west. The Heihe River Basin is west of Ganzhou District, causing the Binhe New Area to be developed there. In west of the Heihe River the land is desert and gobi, low mountains, and hills; with the launch of arable land protection policies, urban areas cannot occupy arable land. Therefore, the government planned expansion to the west.
Considering the urban morphology of Zhangye City, the government also made plans to expand to the south and southwest in order to reduce costs. As the Lanxin New Railway opened in the south, the expansion to the south and southwest was promoted. Ganzhou District is the economic, political, and cultural center of Zhangye City, so with the implementation of the arable land use reform, the westward development strategy, and extension of certain highways, the State Road Urban Road Network become more complete. The Lianhuo Highway, the G312 and G227 National Highways, the Lan-Xin Railway, the Lan-Xin High-Speed Railway, and the Lanzhou-Zhangye Intercity Railway all meet in Ganzhou District. These excellent transportation conditions have promoted its rapid development.
Overall, these factors are not isolated but they are major factors, and the interaction between them is one of mutual restraint. Since 1985 the expansion of the Hexi Corridor was not mainly driven by the availability of urban water resources or the scale of the oasis which carried the production or activity of that arid area. Rather, it has been the combination of factors such as the economy, transportation, resources, population, and national policies.
6 Conclusions
1) The urban growth of Ganzhou District is constrained by the land use spatial structure and the environment. The expansion of built-up areas in the oasis city has been mainly external.
2) The oasis city of Ganzhou District is relatively concentrated. Large numbers of the local populations near the mountains and deserts have moved to the urban area, attracted by the education, employment, health care, transportation, and other public resources available in the city center.
3) Extended oasis cities such as Ganzhou District also have the common characteristics of urban expansion in other cities. Subject to government benefits, GDP growth has a decisive role in the management of urban land to attract foreign investment.
4) Urban planning and policies have a direct influence on urban expansion, so the planning and policies must be based on the ecological, environmental, economic, and population factors in order to guarantee sustainable development.
Acknowledgments:
We greatly appreciate the editor for the improvement of this paper. We also appreciate the manuscript improvement suggestions from reviewers. This study was supported by a project of the National Natural Science Foundation of China (Grant No. 41271133) and the improvement plan of scientific research ability in Northwest Normal University (NWNU-LKQN-13-10), Open-ended fund of State Key Laboratory of Cryosphere Sciences, Chinese Academy of Sciences (SKLCS-OP-2014-11).
Angel S, Sheppard S, Civco DL, et al., 2005. The Dynamics of Global Urban Expansion. Washington D.C.: Transport and Urban Development Department, The World Bank.
Batisani N, Yarnal B, 2009. Urban expansion in Centre County, Pennsylvania: Spatial dynamics and landscape transformations.Applied Geography, 29(2): 235–249. DOI: 10.1016/j.apgeog. 2008.08.007.
Camagni R, Gibelli MC, Rigamonti P, 2002. Urban mobility and urban form: The social and environmental costs of different patterns of urban expansion. Ecological Economics, 40(2): 199–216. DOI: 10.1016/S0921-8009(01)00254-3.
Che QJ, Duan XJ, Guo Y, et al., 2011. Urban spatial expansion process, pattern and mechanism in Yangtze River Delta. Journal of Geographica Science, 66(4): 446–456.
Chen BQ, Xu HQ, 2005. Urban expansion and the driving force of remote sensing analysis: A case study in Xiamen city. Journal of Economic Geography, 25(1): 79–83.
Chen YG, Liu MH, 2001. Experimental methods of geographical researches from modeling material objects to computer simulation. Journal of Xinyang Teachers College (Natural Science Edition), 14(2): 209–214. DOI: 10.3969/j.issn.1003-0972. 2001.02.027.
Deakin M, Curwell S, Lombardi P, 2002. Sustainable urban development: The framework and directory of assessment methods. Journal of Environment Assessment Policy and Management, 4(2): 171–197.
Fang CL, Bao C, Qiao B, 2008. The Urbanization Process and Ecological Environment Effect. Beijing: Science Press, pp. 110–159.
Feng XG, Li R, Mo HW, 2010. Study of urban expansion and driving forces using GIS and RS–– A case study of Xi'an city. Remote Sensing Technology and Application, 25(2): 202–208.
Fu BJ, 1995. Landscape diversity analysis and mapping study. Acta Ecologica Sinica, 15(4): 347–352.
Gansu Statistics Bureau (GSB), 2012. Gansu Statistics Yearbook (1996–2011). Beijing: China Statistics Press, pp. 2–5.
Garcia-López M, Muñiz I, 2011. Urban spatial structure, agglomeration economies, and economic growth in Barcelona: An intra-metropolitan perspective. Papers in Regional Science, 92(3): 515–534. DOI: 10.1111/j.1435-5957.2011.00409.x.
Gong JZ, Xia BC, 2008. Urban Landscape Ecology and Ecological Security. Beijing: Science Press, pp. 256–339.
Han C, 2007. The study on the expanding of urban space about Xi'an city based on Geo-Informatic TuPu. Master's thesis of Shaanxi Normal University, pp. 31–47.
He L, Cui GH, 2000. Study about Nanjing urban expansion. Urban Planning Forum, 6: 56–60, 80.
Herold M, Goldstein NC, Clarke KC, 2003. The spatiotemporal form of urban growth: Measurement, analysis and modeling. Remote Sensing of Environment, 86(3): 286–302. DOI: 10.1016/S0034-4257(03)00075-0.
Hu DY, Li J, Chen YH, et al., 2006. Phase analysis of urban expansion and the driving force based on the Landsat data. Remote Sensing for Land & Resources, 18(4): 46–49, 54.
Huang SL, Wang SH, William WB, 2008. Sprawl in Taipei's peri urban zone: Responses to spatial planning and implications for adapting global environmental change. Landscape and Urban Planning, 90(1–2): 20–32. DOI: 10.1016/j.landurbplan.2008. 10.010.
Li HX, Song JZ, Xie YW, et al., 2011. Analysis of the urban expansion in Ganzhou District from 1959 to 2009. Remote Sensing Technology and Application, 26(5): 584–589.
Li QL, Ma XD, Zhu CG, et al., 2007. Analysis on evolution of urban spatial structure based on GIS in Yancheng. Geography and Geo-Information Science, 23(3): 69–73, 86.
Li XJ, 1999. Economic Geography. Beijing: Higher Education Press, pp. 181–222.
Liu JY, Wang XS, Zhuang DF, et al., 2003. Application of Convex hull in identifyting the types of urban land expansion. Acta Geographic Sinica, 58(6): 885–892.
Ma RH, Chen W, Chen XH, et al., 2000. Town and construction land growth of Changshu City. Acta Geographica Sinica, 59(3): 418–426.
Ma XD, Zhu CG, Ma RH, et al., 2008. Urban spatial growth pattern and its evolution in Suzhou, Jiangsu Province, China. Acta Geographica Sinica, 63(4): 405–416.
Qiao LH, Yang YC, Xiang FM, et al., 2008. The research on Lanzhou city spatial expansion since 1990. Human Geography, (3): 59–63, 96.
Vaz EN, Nijkamp P, Painho M, et al., 2012. A multi-scenario forecast of urban change: A study on urban growth in the Algarve. Landscape and Urban Planning, 104(2): 201–211. DOI: 10.1016/j.landurbplan.2011.10.007.
Soong CT, 1980. Research method on regional economic-geographic foundation of city development. Acta Geographica Sinica, 35(4): 277–287.
Wu HA, Jiang JJ, Zhou J, et al., 2005. Xi'an urban expansion and analysis of its driving force. Acta Geographica Sinica, 60(1): 143–150.
Wu QY, Zhu XG, 2001. Retrospect and prospect of the research on urban spatial structure. Geography and Territorial Research, 17(2): 46–50.
Wu ZZ, Song JP, Wang XX, et al., 2008. Beijing urbanization process and the edge area of city spatial expansion: A case study in Daxing district. Geographical Research, 27(3): 285–294.
Xu DY, Zhang L, Lan RJ, 2009. Urban spatial extension theory review. Productivity Research, 6: 168–170.
Xu YX, Chen F, Pu LJ, 2007. A retrospect and prospect on research of urban spatial and land use expansion. Economic Geography, 27(2): 296–301.
Zhang JQ, Deng NR, Wei SQ, et al., 2012. Comparative study of urban spatial expansion between regions with different economic development phases: A case study of Fuzhou and Taipei. Journal of Natural Resources, 27(2): 177–186.
Zhang SQ, Zhang JY, Li F, 2000. Vector analysis theory on landscape pattern in Sanjiang Plain Marsh. Wetland Science, 9(3): 161–170. DOI: 10.13248/j.cnki.wetlandsci.2004.03.001.
Tong HL, Shi PJ, Zhu GF, et al., 2015. The characteristics of oasis urban expansion and drive mechanism analysis: a case study on Ganzhou District in Hexi Corridor, China. Sciences in Cold and Arid Regions, 7(3): 0282-0292. DOI: 10.3724/SP.J.1226.2015.00282.
*Correspondence to: PeiJi Shi, College of Geography and Environmental Science, Northwest Normal University, Lanzhou, Gansu 730070, China. E-mail: shipj@nwnu.edu.cn
July 11, 2014 Accepted: December 5, 2014
杂志排行

Sciences in Cold and Arid Regions的其它文章
- Comparing the seasonal variation of parameter estimation of ecosystem carbon exchange between alpine meadow and cropland in Heihe River Basin, northwestern China
- Comparative studies on leaf epidermal micromorphology and mesophyll structure of Elaeagnus angustifolia L. in two different regions of desert habitat
- Biomass and water partitioning in two age-related Caragana korshinskii plantations in desert steppe, northern China
- Elemental composition and its environmental significance for the varicolored hills in the northern foothills of the Qilian Mountains of Sunan Yugur Autonomous County, China