Underground vibration signal detection and processing system based on LabWindows/CVI
2015-07-06LIUPeizhenXIAHupeiYAOJinjie
LIU Pei-zhen, XIA Hu-pei, YAO Jin-jie
(Shanxi Key Laboratory of Signal Capturing & Processing, North University of China, Taiyuan 030051, China)
Underground vibration signal detection and processing system based on LabWindows/CVI
LIU Pei-zhen, XIA Hu-pei, YAO Jin-jie
(ShanxiKeyLaboratoryofSignalCapturing&Processing,NorthUniversityofChina,Taiyuan030051,China)
In order to detect and process underground vibration signal, this paper presents a system with the combination of software and hardware. The hardware part consists of sensor, memory chips, USB, etc., which is responsible for capturing original signals from sensors. The software part is a virtual oscilloscope based on LabWindows/CVI (C vitual instrument), which not only has the functions of traditional oscilloscope but also can analyze and process vibration signals in special ways. The experimental results show that the designed system is stable, reliable and easy to be operated, which can meet practical requirements.
virtual instrument; data processing and detection; vibration signal; LabWindows/CVI
At present, vibration signal is detected often using an acquisition card to capture signals from sensors and the software from a computer to display and analyze the obtained data[1]. When the detected vibration signal is instantaneous and mutative, the acquisition card should have a sufficiently high sampling rate and transmission rate. At the same time, the instantaneousness of vibration signal reduces the requirement of real-time signal analysis.
According to the characteristics of underground vibration signals, this paper presents a new detection and processing system with the combination of software and hardware. The hardware system is controlled by a microcomputer to obtain the acceleration signal detected by sensors. The software system is used to display and analyze the data based on LabWindows/CVI (C vitual instrument)[2].
1 Overall design of system
The working process of the system is as follows: firstly, underground excitation source is taken as the center of a circle; secondly, it is dispersed on a circular arrangement of five detection nodes, which is aimed to obtain each detection node’s vibration signal; finally, the signal is processed by the virtual software to extract the features of the vibration data.
1.1 Design of hardware system
The block diagram of hardware system is shown in Fig.1.
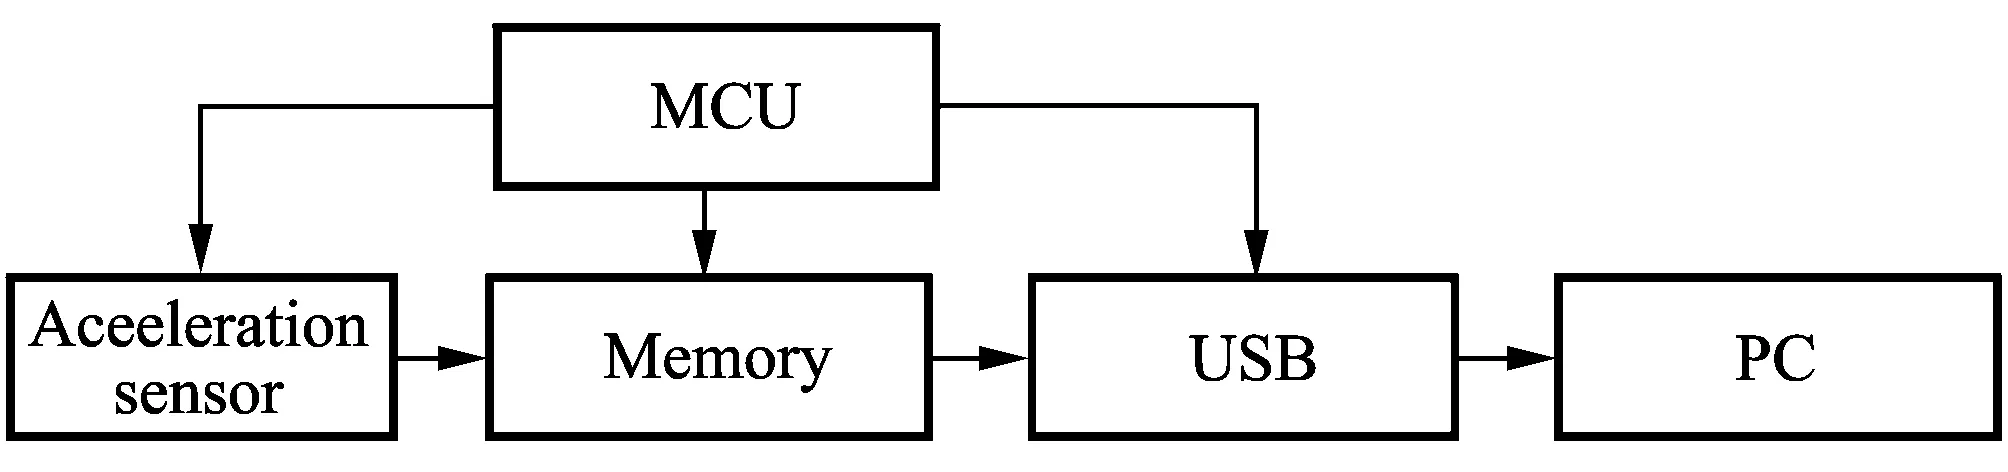
Fig.1 Block diagram of hardware system
Firstly, the acceleration sensor can convert vibration signals into electrical signals. Through an internal analog-to-digital converter (ADC), the electrical signals are converted into the digital signals and then are stored in memory chip controlled by microprogrammed control unit (MCU). Finally, the digital signals are transmitted to the computer.
1.2 Design of software system
The block diagram of software system is shown in Fig.2. Firstly, the data is read in the format of TXT file through universal serial bus (USB). Afterwards, the following functions are performed: signal synthesis, signal filtering, the extraction of the first arrival time and data display, of which the signal synthesis is mainly responsible for the data synthesis from three axes and the extraction of the first arrival time is to determinate the first arrival time of the initial data. Finally, the results are sent to display module.

Fig.2 Block diagram of software system
2 Implementation of hardware system
As shown in Fig.1, MSP430 from TI company is chosen as MCU and it is the core of hardware syste-
m. It is a mixed signal processor with abundant resources (universal asynchronous receiver/transmitter (UART), serial peripheral interface (SPI), inter-integrated circuit (I2C)), powerful processing capacity and ultra-low power consumption.
2.1 Data detection
Acceleration sensor is an inertial sensor and can capture the acceleration values of moving objects fromXaxis (left and right),Yaxis (front and back) andZaxis(top and bottom). ADXL345[3]is adopted in the system. It is from ADI company and integrates the acceleration sensor with programmable amplifier, filter, ADC, etc. The sampling rate of underground vibration signal is set at 100 kHz.
2.2 Data storage and transmission
Memory chip is M25P128 from STMicroelectronics company with capacity of 128 Mb and read/write frequency of 50 MHz. The SPI in M25P128 is convenient to communication with MCU. The resolution of ADXL345 is 13 bits, which needs to be written twice to memory chip, first low 8 bits, then high 5 bits; likewise it is read. The sampling rate is 100 kHz, then continuous sampling time is
128×106/(100×103×16×3)=26.6 s.
Thecapacitycanmeettheinstantaneousvibrationsignaldetection.TheprogramflowchartofM25P128isshowninFig.3.

Fig.3 Program flow chart of M25P128
FT245RLisadoptedasUSBchipanditsreadingspeedcanreach1Mb/s.FT245RLhaseight8-bitparalleldataports(D[0:7])andfourstatecontrolports(RXF,TXE,RDandWR)connectedwithMSP430[4].ItisusedtocommunicatebetweenPCandthetestinstrument.TheschematicdiagramofFT245RLisshowninFig.4.TheprogramflowchartofhardwaresystemisshowninFig.5.

Fig.4 Schematic diagram of FT245RL

Fig.5 Program flow chart of hardware system
ThedataofX,YandZaxes from the sensors are transmitted sequentially into flash memory chips, and then are saved in the computer. At the first time of sampling, the time node should be written into M25P128 first. Because time interval of each data is 0.01 ms (sampling rate is 100 kHz), the time of every node can be calculated.
3 Implementation of software system
3.1 Monitoring interface
LabWindows/CVI is a graphical software based on language C and it offers an ideal software development environment. The data of each detection node is captured by hardware system, and the original data from acceleration sensors are stored in three files in TXT format. Each file contains 500 000 rows and 2 columns. The first column shows the time of sampling points and the second one shows the corresponding sampling data.
3.2 Signal synthesis module

3.3 Signal filtering module
Signal filtering module is responsible for removing the noise of synthetic data. Because wavelet theory has good characteristics in time and frequency domain, wavelet filtering is used for filtering algorithm. In the field of measurement and control, there are no libraries available in LabWindows, such as neural network, fuzzy theory and genetic algorithm, and wavelet and chaos theory. But there are corresponding function libraries in Matlab[5]. Therefore, the combination between Matlab and CVI needs to be established. The ActiveX service control in CVI is used to implement the soft interfacely by calling subroutine in Matlab and returned data.
The following shows the communication method between Matlab and LabWindows/CVI2010. Firstly, it establishes “create ActiveX automation controller” development guide and then selects “Matlab application type library” in the dialog box. After configuration, it will automatically generate ActiveX driver file, .c, .h, .obj and .sub files. Finally, it adds these files to the project and generates relevant calling functions[6].
After establishing the development platform, it will generate some MLApp functions. Thus Matlab in CVI can be used. Moreover, this module selects m file and starts Matlab program, and thus data filtering can be realized.
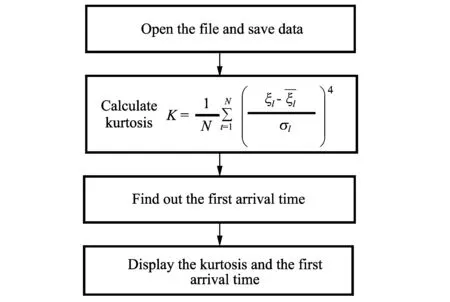
Fig.6 Process of finding the first arrival time
3.4 Finding primary wave time module
The first arrival time is the most important characteristic in recognizing a vibration signal[7]. The respective time and sampling value must be put into different arrays. The fourth-order statistics kurtosis is calculated. At the same time, the first arrival time is the time of minimum value. The process of finding the first arrival time is shown in Fig.6.
3.5 Data display module
1) Data display in graph
Data display methods are divided into two kinds. One is single channel display that corresponds to a single file and can be realized directly by calling function PlotY; the other is multi-channel display that corresponds to multiple files. According to different offsets, it can be realized by calling PlotWaveform. The following shows the calculation process of offset.
//Obtain the value y of ‘Ring’ on the right side of graph
GetCtrlVal(TabPanelHandle, TABPANEL_RINGSLIDE, &y);
//Get the value of v/cell controls
GetCtrlVal(TabPanelHandle, TABPANEL_RING_3, &channel);
//Calculating the offset tmp_v
tmp_v=voltage[channel]*y;
2) Segmented signal display
Segmented signal display is realized through scroll bar and NUMERIC controls. The following focuses on the use of scroll bar.
Before programming, virtual instrument driver is loaded. select ‘Instrument Load’ in the menu first, and then select the path in the pop-up dialog box: National Instrument CVI2010 toolslib custctrl scroll.fp, especially, the file named ‘scroll.fp’ must be added into the current project[8].
A graph control is realized for the operation of scroll. With ScrollBar_ConvertFromGraph, charting control can be turned into scroll bar[9]. Thus the various properties of scroll bar can be set by ScrollBar_SetAttribute, such as roll size, scroll bar size, etc.
4 Results of detection processing
4.1 Multi-channel data display
The three Tab controls are used in the interface to process different data files. The first Tab control contains file open, data display, etc.; the second one is to combine the data; and the third is to extract the first arrival time. Multi-channel display is shown in Fig.7. The text data can be intercepted at an arbitrary length in an arbitrary position.
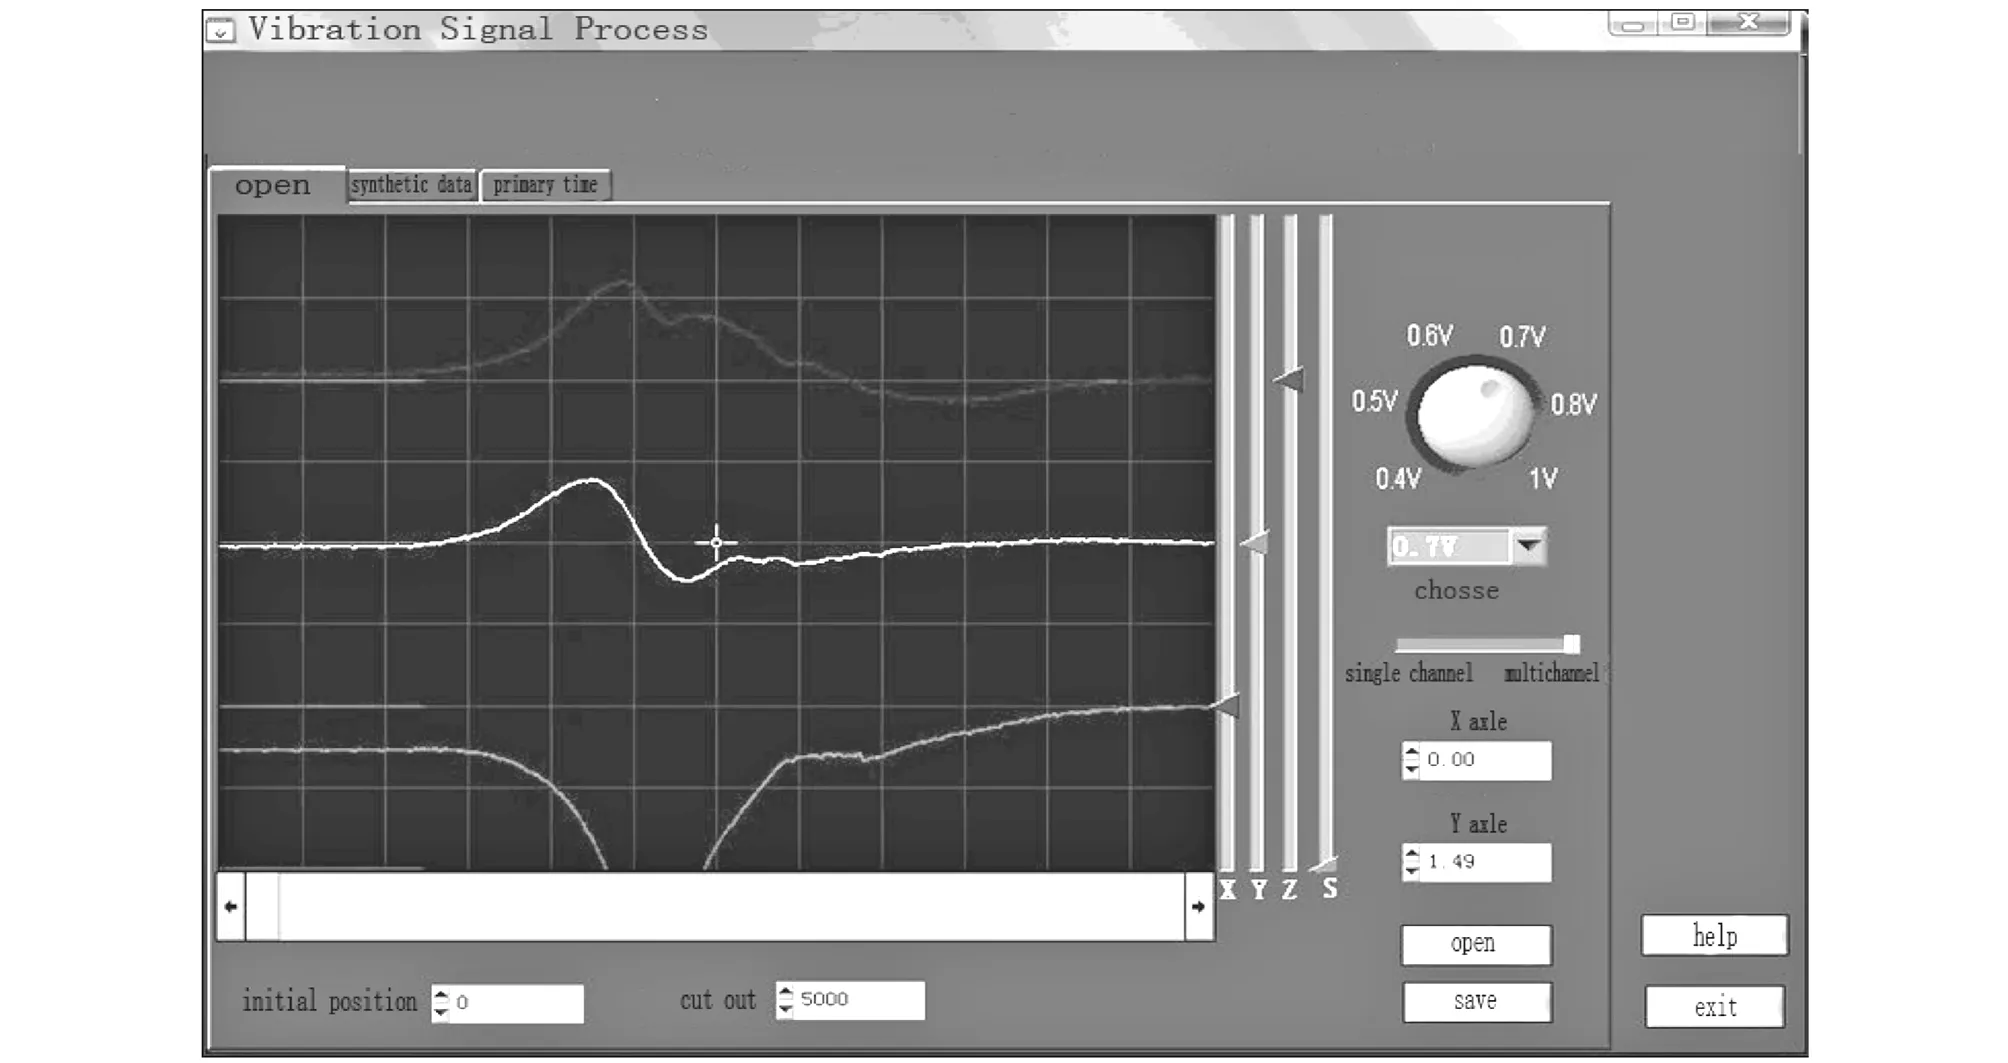
Fig.7 Multi-channel data display
4.2 Result of signal synthesis
The result of data synthesis is shown in Fig.8. The synthetic data can be saved and also be intercepted in an arbitrary starting position.

Fig.8 Data synthesis of three axes
4.3 Result of signal filtering
The signal filtering result is shown in Fig.9.


Fig.9 Results of signal filtering
Fig.9(a) shows the original signal and Fig.9(b) is the reconstructed signal. It can be seen that the filtered signal has little noise compared with the original signal.
4.4 Result of extracting the first arrival time
The result of extracting the first arrival time is shown in Fig.10. The result is got by contrasting different time between two nodes. Fig.10 shows the fourth-order statistics of data synthesis as 1.86 s, therefore, the corresponding time is 69.38 s and the arrival time of node 4 is 0.81 s.

Fig.10 Extracting of the first break time
5 Conclusion
After actual tests, it can be seen that the hardware system for underground vibration detection can completely capture the vibration data, and the software system based on LabWindows/CVI can process the vibration data such as data synthesis, filtering and extraction of the first arrival time, etc. Futhermore, the designed system is stable, accurate and easy to be operated. Therefore, it can be widely applied to vibration signal detection.
[1] Hannan M A, Hussain A, Samad S A. System interface for an integrated intelligent sagety system(ISS) for vehicle applications. Senors, 2010, 10(7): 1141-1153.
[2] XI Yuan, DONG Chen, XIANG Tian. Digital three-axis accelerometer ADXL345 and its application in the strapdown inertial navigation. Electronic Design Engineering, 2010, 18(5): 138-140.
[3] PEI Xiang-dong, CHEN Xiao, TAN Qiu-lin. FPGA and PC communication design and implementation based on USB - FIFO. The Computer Measurement and Control, 2012, 14(4): 1073-1075.
[4] LIU Hong-chang, LI Hong-ru. The design and implementation of wavelet de-noising instrument based on LabWindows/CVI and Matlab. Instrument Technique, 2009, 1(3): 10-12.
[5] Simbeye D S, ZHAO Ji-min, YANG Shi-feng. Design and deployment of wireless sensor networks for aquaculture monitoring and control based on virtual instruments. Computer and Electronics in Agriculture , 2014, 10(2): 31-42.
[6] GUAN Ping-ping, ZHAI Zheng-jun. A measurement and control system for the design and implementation of general statements based on LabWindows/CVI. Computer Engineering and Design, 2010, 1(5): 203-205.
[7] YANG Jun-feng, ZHANG Pi-zhuang. Based on DTOA/DOA and newton's iteration method source locating method research. The Seismology Research, 2013, 3(7): 159-162.
[8] WANG Jian-xin, YANG Shi-feng, SUI Mei. LabWindows/CVI testing technology and engineering application. Beijing: Chemical Industry Press, 2010, 17-20.
[9] WANG Yu-hang. Vehicle detection data acquisition system based on Labwindows/CVI. Instrument Technique and Sensor, 2009, 1(4): 48-49.
基于LabWindows/CVI的地下震动信号检测与处理系统
刘培珍, 夏湖培, 姚金杰
(中北大学 信息探测与处理重点实验室, 山西 太原 030051)
基于软硬件技术, 设计了一种用于地下爆破震动信号检测及处理的系统。 系统硬件部分由传感器、 存储器、 USB等部件组成, 负责采集原始震动信号。 软件部分设计了以LabWindows/CVI为平台的虚拟示波器, 不仅具有传统示波器的功能, 还可实现对震动信号不同方向轴分量的合成、 滤波和提取震动信号初至波时间等。 实验结果表明, 该系统工作稳定可靠、 操作简单, 能够对震动信号进行检测、 处理和显示。
虚拟仪器; 数据检测处理; 震动信号; LabWindows/CVI
LIU Pei-zhen, XIA Hu-pei, YAO Jin-jie. Underground vibration signal detection and processing system based on LabWindows/CVI. Journal of Measurement Science and Instrumentation, 2015, 6(1): 57-62.
10.3969/j.issn.1674-8042.2015.01.011
s: National Natural Science Foundation of China (No.61302159, 61227003, 61301259); Natural Science Foundation of Shanxi Province (No.2012021011-2); The Project Sponsored by Scientific Research for the Returned Overseas Chinese Scholars, Shanxi Province (No.2013-083)
LIU Pei-zhen(try0422@163.com)
1674-8042(2015)01-0057-06 doi: 10.3969/j.issn.1674-8042.2015.01.011
Received date: 2014-10-09
CLD number: TN911.7 Document code: A
猜你喜欢
杂志排行

Journal of Measurement Science and Instrumentation的其它文章
- Approach for epileptic EEG detection based on gradient boosting
- A method based on vector type for sparse storage and quick access to projection matrix
- Usage of global navigation systems for detection of dangerous meteorological phenomena
- A spectrum measurement system for arc plasma with time and spatial indentification
- Design of IP core for IIC bus controller based on FPGA
- Test system for miniature pulse-powered photoelectric invert switch based on CPLD