Spatial heterodyne spectroscopy for space-based measurements of atmospheric CO2
2015-04-22YEHanhan叶函函WANGXianhua王先华LIZhiwei李志伟WEIQiuye韦秋叶SHIHailiang施海亮XIONGWei熊伟
YE Han-han(叶函函), WANG Xian-hua(王先华), LI Zhi-wei(李志伟),WEI Qiu-ye(韦秋叶), SHI Hai-liang(施海亮), XIONG Wei(熊伟)
(Key Laboratory of Optical Calibration and Characterization, Anhui Institute of Optics and Fine Mechanics, Chinese Academy of Sciences, Hefei 230031, China)
Spatial heterodyne spectroscopy for space-based measurements of atmospheric CO2
YE Han-han(叶函函), WANG Xian-hua(王先华), LI Zhi-wei(李志伟),WEI Qiu-ye(韦秋叶), SHI Hai-liang(施海亮), XIONG Wei(熊伟)
(Key Laboratory of Optical Calibration and Characterization, Anhui Institute of Optics and Fine Mechanics, Chinese Academy of Sciences, Hefei 230031, China)
To reduce the error from measurement and retrieval process, a new technology of spatial heterodyne spectroscopy is proposed. The principle of this technology and the instrument spatial heterodyne spectrometer (SHS) are introduced. The first application of this technology will be for CO2measurements from space on a high spectral observation satellite. The outstanding measurement principle and the priority of combination of retrieval algorithm and three channels (O2A-band, CO21.58 μm and 2.06 μm bands) are theoretically analyzed and numerically simulated. Experiments using SHS prototype with low spectral resolution of 0.4 cm-1are carried out for preliminary validation. The measurements show clear CO2absorption lines and follow the expected signature with theory spectrum, and the retrievals agreed well with GOSAT CO2products, except a small bias of about 4×10⁻⁶. The results show that the ability of spatial heterodyne spectroscopy for CO2detecting is obvious, and SHS is a competent sensor.
spatial heterodyne spectrometer; atmospheric CO2; retrieval algorithm; error
Increasing carbon dioxide (CO2) in the atmospheric is widely accepted as the largest anthropogenic greenhouse gas[1]. In order to study the relation between CO2and climate change, nadir view observation from satellite should promise 1% precision of monthly mean column-averaged CO2volume mixing ratio (XCO2)[2].
Currently, global observation of CO2from space is being carried out only with scanning imaging absorption spectrometer atmospheric chartography (SCIAMACHY)[3]and greenhouse gases observation satellite (GOSAT)[4]. Due to higher spatial and spectral resolution, thermal and infrared sensor for observing SATellite (TANSO) aboard on GOSAT is more preferable. Furthermore, TANSO was designed with more appropriate absorption bands at around 0.76 μm, 1.6 μm, and 2.0 μm[4]to help achieve the expected precision.
Spatial heterodyne spectrometer (SHS) aboard on a high spectral observation satellite can measure CO2and CH4from space. Its principle and data processing method was proposed, and a SHS prototype was used to experimentally validate the technique as a tool for CO2monitoring with high precision.
1 Spatial heterodyne spectrometer technique and CO2 retrieve method
1.1 Properties of spatial heterodyne spectroscopy instrument
Spatial heterodyne spectroscopy (SHS) is a technique that produces a Fizeau fringe of wavenumber-dependent spatial frequencies by a two-beam dispersive interferometer. The basic SHS configuration is illustrated in Fig. 1, which is similar to a Michelson interferometer but with the return mirrors replaced by fixed diffraction gratingsG1andG2. Incident wavefront shown as dashed lineL1enters the interferometer and is split into two wavefronts by a beam splitter. After the two wavefronts diffract separately by gratingsG1andG2, they are tilted with respect to each other with a wavenumber-dependent tilt angle (dashed line 1 and 2 in Fig.1) and produce Fizeau fringes which are effectively recorded by a position sensitive array detector without scanning. A detailed description of the SHS technique can be found in Ref.[5].
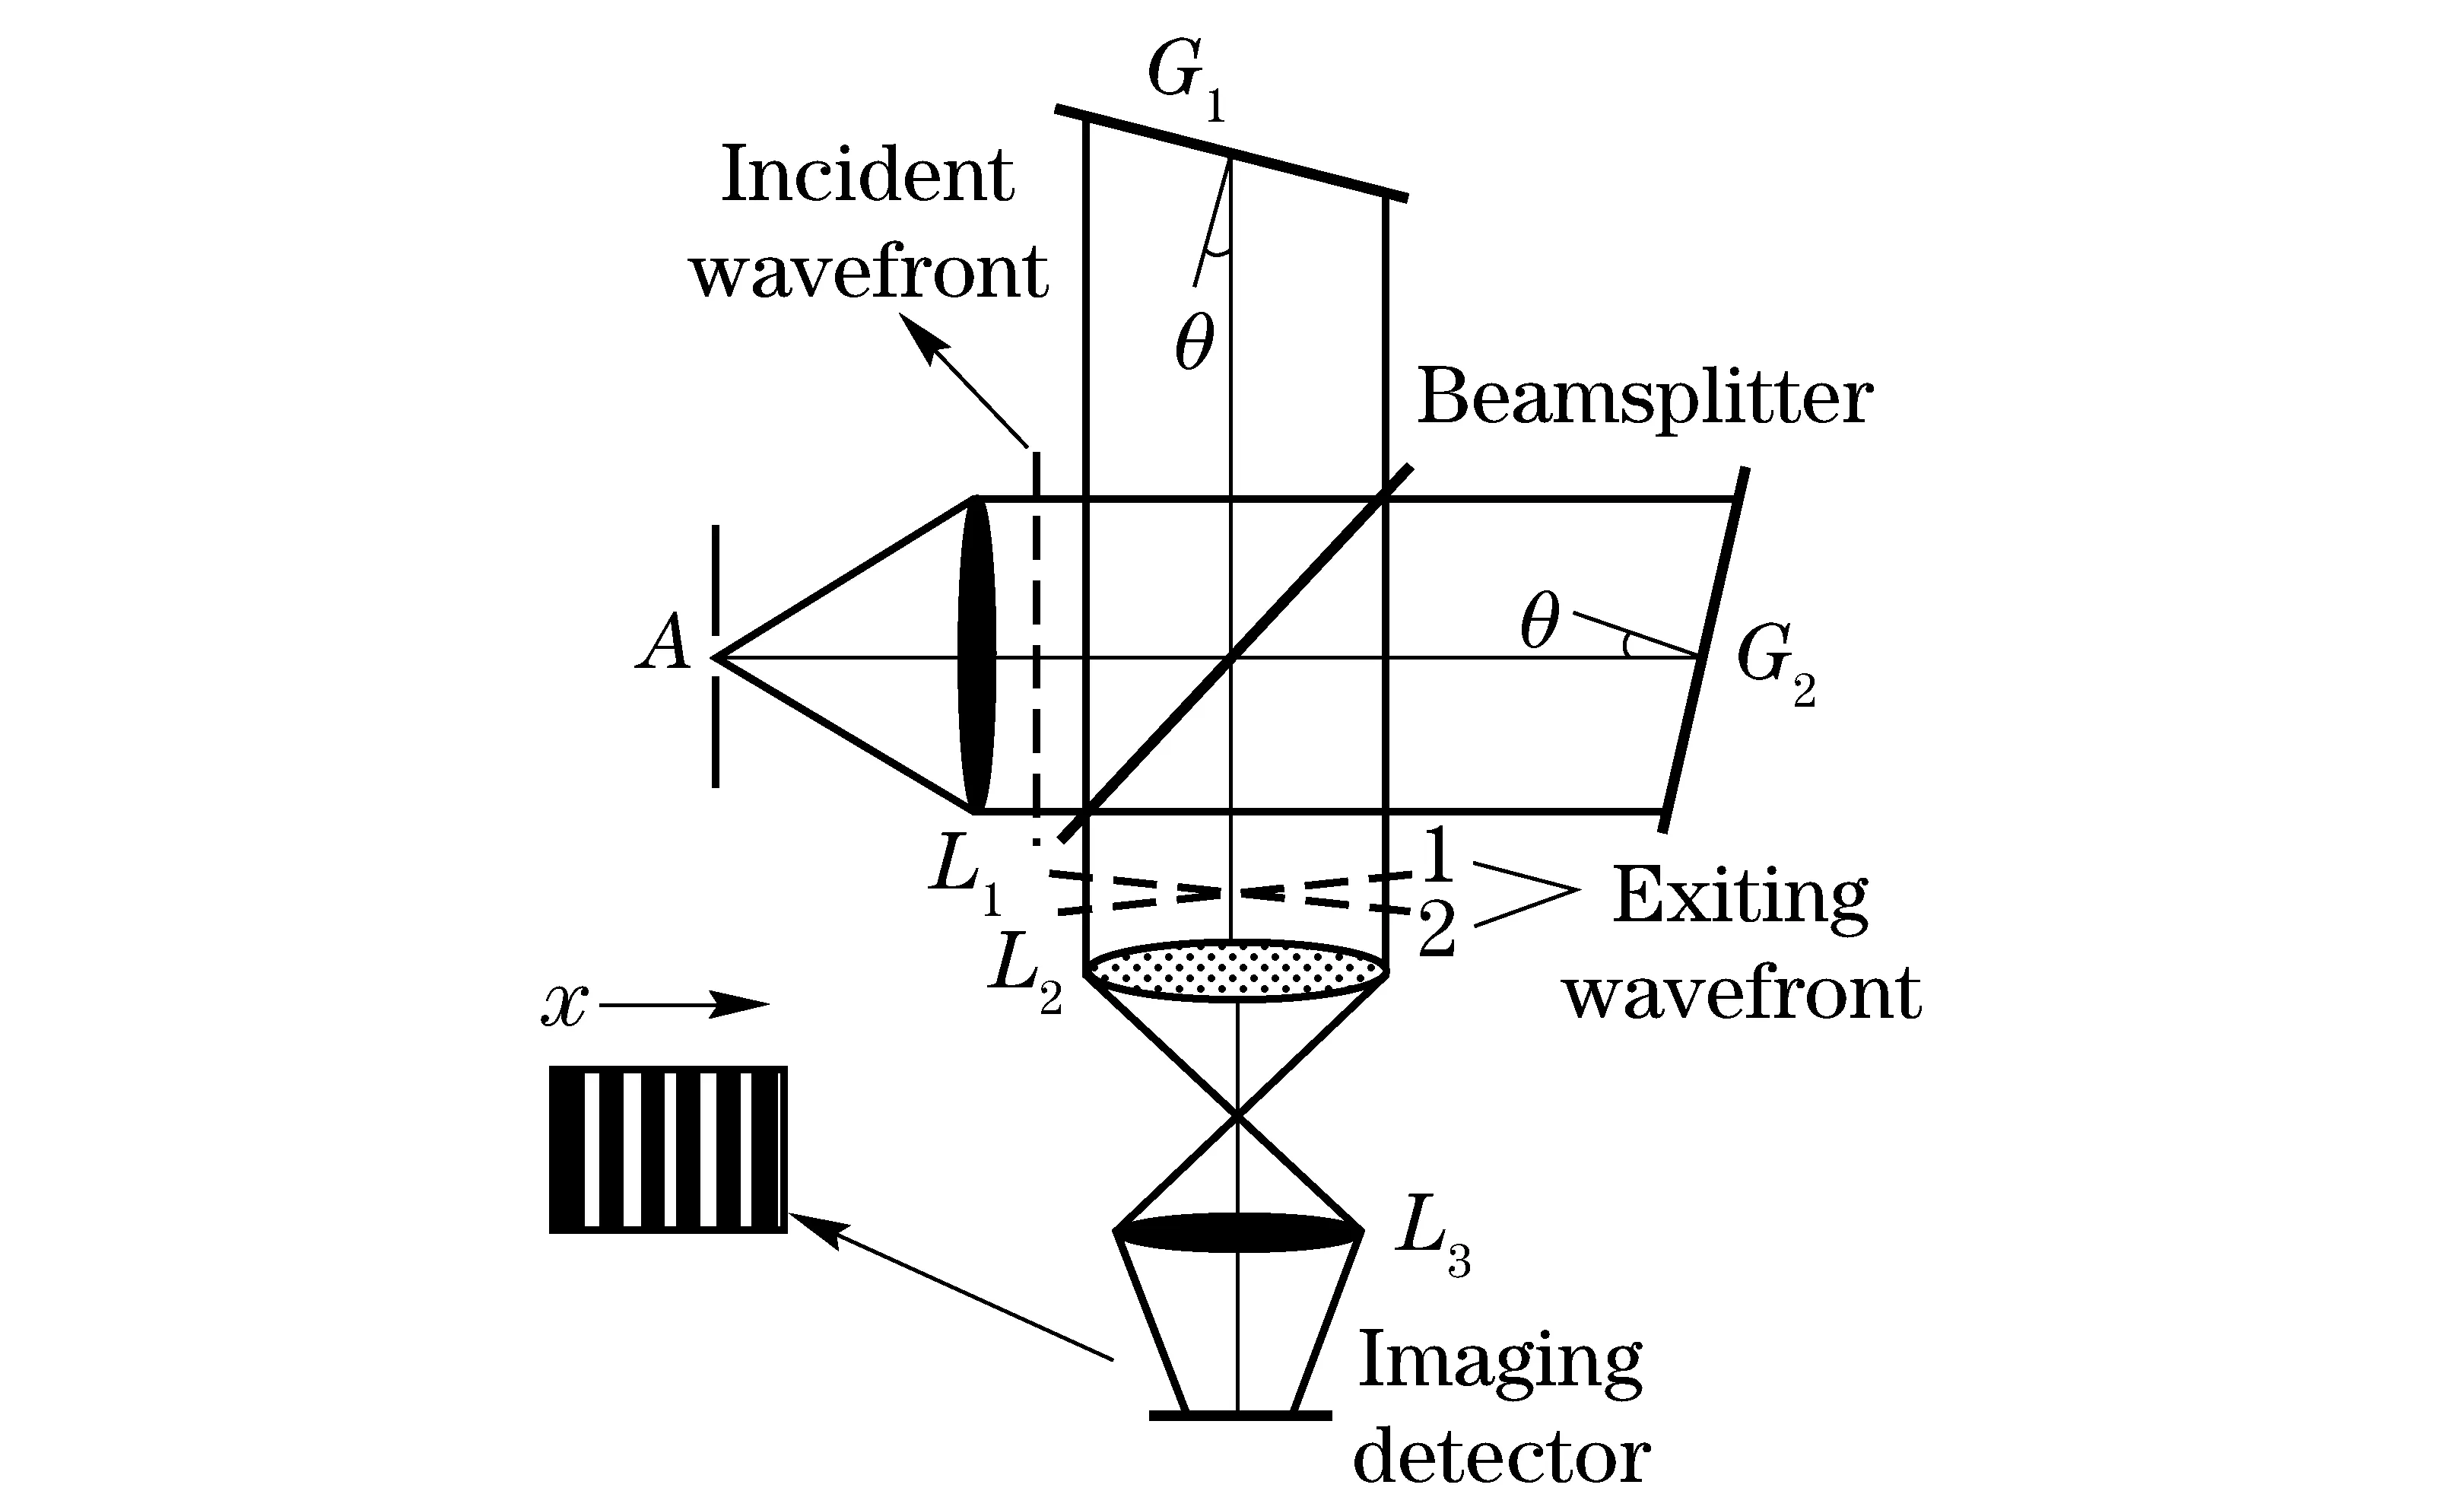
Fig.1 SHS configuration diagram
There are some substantial differences between SHS and conventional FTS. Firstly, the incident radiation is recorded heterodyned around the Littrow wavenumber by SHS, while FTS interferogram record much longer spectral range start from wavenumber of zero, so higher spectra resolution can be achieved easily by SHS[6-7]. Secondly, the return mirrors in FTS are replaced by fixed diffraction gratings in SHS, so for SHS, the effluence of radiation variation with time is less, while for FTS, the effluence is obvious, such as about 10% TANSO FTS abnormal interferograms in orbit[8]. Lastly, 2-D interferogram with spectra dimension and spatial dimension is recorded simultaneously using array detector with SHS, which need much less time than FTS, and averaging multiple spatial dimension data can reduce random noise.
The development of SHS prototype for CO2was started from year 2005[9], and space-borne SHS was developmed start from year 2011, shown as Fig.2. Three absorption bands at 0.76 μm, 1.58 μm and 2.06 μm were designed for space-borne SHS, with spectral resolutions and signal to noise ratio (SNR) all similar to TANSO FTS, which accounts for the improved performance at complex atmospheric situation for detecting atmospheric CO2with high precision.

Fig.2 Conceptual design of four-channel scanning SHS
1.2 Retrieval algorithm
A full physics retrieval algorithm was developed for SHS measurement based on maximum a posteriori approach[10]. CO2is estimated by simultaneously fitting O2A-band at 0.76 μm and CO2bands at 1.58 μm and 2.06 μm. According to the Gauss-Newton method, the estimation is calculated each iteration as
(1)
where xiis a state vector at thei-th iteration, xais an a priori state vector,F(xi) is the forward model and Kiis the Jacobian of the forward model at xi, Sεis the covariance matrix of measurements y, Sais a covariance matrix of a priori data xa. This equation is iterated until the update of the state vector is negligible in comparison to the required accuracy.
In the retrieval, state vector x contains CO2column, O2column, surface albedo and optical depth of the three bands. The a priori of CO2column is set to 8.178 5×10²¹mole/cm2and O2column is set to 4.49×1024mole/cm2. Land surfaces are assumed to be purely Lambertian and prior values of the mean albedo and slopes are estimated directly from each continuum of the three bands[11]. Prior values of aerosol optical depth (AOD) of the three bands are from MODIS products. The profiles of temperature and water vapor are interpolated linearly from 6-hourly NCEP model reanalysis 2.5°×2.5° grid data to the space and time of the SHS FOV, while the information of state vector is derived from the SHS measurements.

Fig.3 CO2 retrieval error (%) caused by the uncertainties of T, Ps and H2O
The information of CO2and O2column are taken from medium absorption lines. Albedo and AOD are given relatively small prior variances based on the proper a prior values. Albedo for the three bands was adjusted by information from continuum. Crisp D et al.[12]pointed out that O2A-band can provide the distribution and optical properties of liquid water clouds, but only in combination with CO22.06 μm band that scattering effects of water ice clouds and aerosols at longer near-IR wavelengths can be considered fully. AOD of O2A-band and CO22.06 μm band were both constraint by continuum and strongly saturated lines together. AOD of CO21.58 μm band could be calculated by obtaining the parameters of a Junge size distributionβandαfrom the AOD at multiple wavelengths
τλ=βλ-α
(2)
whereτλis the approximated AOD at wavelengthλ,βis the Angstrom’s turbidity coefficient, representing the AOD atλ= 1 μm, andαis the Angstrom exponent reflecting the aerosol size distribution[13].
Except for the scattering effect, there are several other factors that contribute to the CO2absorption intensity measured from space, such as the atmospheric temperature, surface pressure, and humidity profiles. They complicate CO2retrieval because their uncertainties introduce errors in CO2absorption. However, these errors influence the O2absorption nearly in the same way, they can be seemed as systematic errors, which can be minimized by calculatingXCO2from simultaneous CO2column (CCO2) and O2column (CO2) soundings, whereXO2=0.209 5 is the O2mole fraction.
XCO2=XO2CCO2/CO2
(3)
With the uncertainty of temperature (T), surface pressure (Ps), atmospheric H2O and aerosol, the retrieval error (%) of the three bands retrieval algorithm and CO2single band retrieval algorithm are shown in Fig. 3 and Fig.4. The retrieval algorithm for CO2single band directly retrieves CO2information from the changes in the absorption line relative depth. The uncertainty ofTis between -20 K and 20 K with sampling steps at 5 K,Psis between -40 h·Pa and 40 h·Pa with sampling steps at 20 h·Pa, and H2O is between -20% to 20% with sampling steps at 10%. The condition of aerosol contain two types as rural and urban, and five types of visibility (VIS) as 50 km, 20 km, 10 km, 5 km, and 2 km. Samples at multiple values across the uncertainty range allow for observing the trend of error propagation.

Fig.4 CO2 retrieval error (%) caused by the uncertainties of aerosol
CO2retrieval error for the 1.58 μm band is mostly caused byTandPs, because contamination by H2O is negligible. For CO2single band algorithm, error caused by the 20 K uncertainty ofTor 40 h·Pa uncertainty ofPsis higher than 15%. However, this error is reduced to 0.05% using three bands algorithm.
The effect of aerosol uncertainty on CO2retrieval error depends on the thickness of aerosol. For CO2single band, the effect of aerosol increases as the aerosol becomes thick, so the effect of thin aerosol is minimal. However, for the three bands algorithm, the effect of aerosol decreases as the aerosol becomes thick. The effect of thin aerosol on O2A-band and CO2band are different obviously, which can be negligible in CO2at 2.06 μm band. Compared to thick aerosol, the correction of small scattering effect by the combination of O2A-band and CO22.06 μm band is weaker, whereas, it also satisfied the requirements of the precision.
2 Experiments with SHS prototype
2.1 Experiments
The ground-based experiments with SHS prototype were designed to test the performance of the instrument, and its potential in measuring atmospheric CO2from space, so the nadir viewing observation mode was taken, which is similar with that aboard in satellite but differs in measuring just single light path from sun to ground.
The specifications of SHS prototype for ground-based measurements are listed in Tab.1. The spectral resolution is lower than space-borne SHS and it just has one single CO2band.
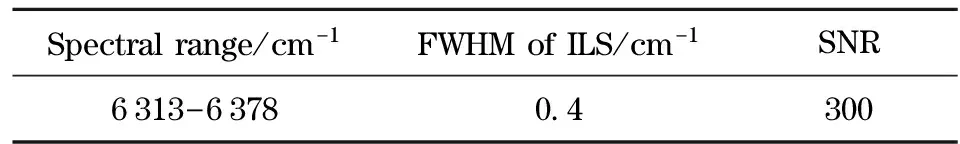
Tab.1 SHS prototype parameters
Ground-based measurements were carried out at experimental field of abroad uniform meadow near our institute (31.9°N, 117.15°E), which is in Hefei north-west urban, 10km far away from the city, surrounded by Dongpu reservoir and relatively far away from local atmospheric pollutant. A photograph of the sensors positioned on the ladder is shown in Fig. 5. The sensor looks down observing the sunlight reflected by the reference board. The reference board has high reflectance and known reflectivity facilitating the simulation of measurements. The system was operated at a constant temperature (245 K) and integration time (50 000 μs).
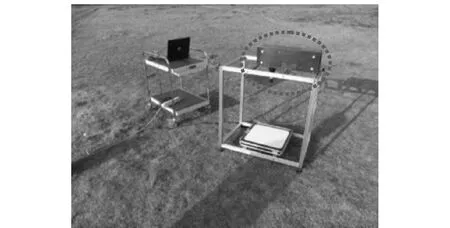
Fig.5 Ground-based observation of SHS prototype
The radiance observed by the instrument is composed of directly reflected radiance and sky scattering radiance. In order to avoid complex scattering radiance, observation with a black baffle plate inserted into the path from sun to the reference board was carried out closely followed normal mode, and the interferogram of reflected sunlight shown as Fig.6 was calculated from the difference of these two observations.

Fig.6 Reflected sunlight interferogram
Spectrum can be recovered through nonuniformity correction, direct current subtraction, phase correction and Fourier transformation. The spectrum of interferogram in Fig. 6 is shown as black line in Fig. 7, while dot line represents the theory spectrum. From Fig. 7, we can see clear CO2absorption lines and medium signals, showing that the capability of detecting of CO2absorption is evident.
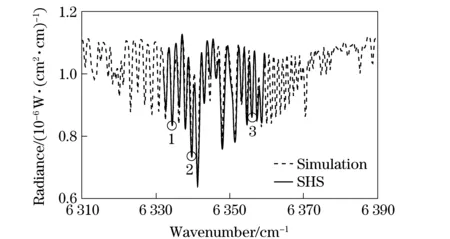
Fig.7 Recovered spectrum
2.2 Results
In order to estimate the effect of aerosol extinction on the continuum intensity to achieve better fitting of instrument observation and simulation, in-suit aerosol measurements were taken from CE318, which was placed on the roof of the building near the experimental field.
A series of about 8-hours-long continuous observations from 8:40 am to 16:18 pm were carried out on 29 September 2012. The day is clear in the afternoon, so the method described in section 1.2 adjusted for single band only retrievingXCO2was used to estimate the CO2daily fluctuation, and the retrievals are shown in Fig. 8. The atmospheric CO2in the afternoon decreases with time, which agrees with the reality. Furthermore, small unsmooth fluctuation validates the stability of the instrument.

Fig.8 CO2 retrievals in the afternoon
In the same way, whole day consecutive measurements of aerosol, near surface temperature and CO2were carried out simultaneously in other three clear days, 12 October 2012, 9 June 2013 and 11 July 2013.The retrievals near 13:00 pm combined with standard deviation of the daily results were compared with the GOSAT CO2products, while the latter was collected in the region within 115°E to 119°E and 30.9°N to 32.9°N during the period of year 2011 to 2013, which contains Hefei and surrounding cities.

Fig.9 Comparison of CO2 retrievals and GOSAT products
From Fig. 9 we can see that there only exists a small bias less than 4×10⁻⁶between retrievals and GOSAT CO2products. Atmospheric parameters were measured simultaneously, so the bias mainly comes from the instrument itself and inaccurate estimation of GOSAT CO2products during the period of April to August in 2013. As illustrated above, since the space-borne SHS was designed with higher spectral resolution and three absorption bands, it can perform better in overcoming these error sources.
3 Conclusion
Analysis of the properties of space-borne SHS and the CO2retrieval algorithm developed for it demonstrated that SHS can achieve comparable performance with TANSO-FTS aboard on GOSAT in theory. Ground-based experiments using SHS prototype with lower spectral resolution and lack of O2A-band and CO22.06 μm band were carried out to test the proposed theory. The CO2values derived from the measurements were compared with GOSAT CO2L2 products, and the results show that SHS prototype can achieve reasonable CO2retrieval but with a small bias possibly from the instrument. Therefore, with higher spectral resolution and three absorption bands, space-borne SHS has the potential to improve current precision.
[1] IPCC. Climate change 2007: the physical science basis. Contribution of working group Ι to the fourth assessment report of the intergovernmental panel on climate change[R]. Cambridge, United Kingdom: Cambridge University Press, 2007.
[2] Rayner P J, O’Brien D M. The utility of remotely sensed CO2concentration data in surface source inversions[J]. Geophysical research letters, 2001, 28(1): 175-178.
[3] Bovensmann H, Burrows J P, Buchwitz M, et al. SCIAMACHY: Mission objectives and measurement modes[J]. Journal of the Atmospheric Sciences, 1999, 56(2): 127-150.
[4] Yoshida J, Kawashima T, Ishida J, et al. Prelaunch performance test results of TANSO-FTS and CAI on GOSAT[C]∥SPIE 7082, Infrared Spaceborne Remote Sensing and Instrumentation XVI, San Diego, California, USA, 2008.
[5] Harlander J M, Tran H T, Roesler F L, et al. Field-widened spatial heterodyne spectroscopy: correcting for optical defects and new vacuum ultraviolet performance tests[C]∥SPIE 2280, EUV, X-Ray and Gamma-Ray Instrumentation of Astronomy V, San Diego, CA, USA, 1994.
[6] Englert C R, Harlander J M. Flatfielding in spatial heterodyne spectroscopy[J]. Applied optics, 2006, 45(19): 4583-4590.
[7] Roesler F L, Harlander J M. Spatial heterodyne spectroscopy for atmospheric remote sensing[C]∥SPIE 3756, Optical Spectroscopic Techniques and Instrumentation for Atmospheric and Space Research III, Denver, CO, 1999.
[8] Nakajima Masakatsu, Kuze Akihiko, Suto Hiroshi, et al. GOSAT two years operation on orbit and its follow-on program[EB/OL]. [2011- 03- 29]. http:∥presentations.copernicus.org/EGU2011- 1501_presentation.pdf.
[9] Ye Song, Xiong Wei, Qiao Yanli, et al. Data processing for interferogram of spatial heterodyne spectrometer[J]. Spectroscopy and Spectral Analysis, 2009, 29(3): 848-852. (in Chinese)
[10] Rodgers C D. Inverse methods for atmospheric sounding: theory and practice[M]. Singapore: World Scientific, 2000: 81-100.
[11] O’Dell C W, Connor B, Bösch H, et al. The ACOS CO2retrieval algorithm-part 1: description and validation against synthetic observations[J]. Atmospheric Measurement Techniques, 2012, 5(1): 99-121.
[12] Crisp D, Atlas R M, Breon F M, et al. The orbiting carbon observatory (OCO) mission[J]. Advances in Space Research, 2004, 34: 700-709.
[13] Ångström A. On the atmospheric transmission of sun radiation and on dust in the air[J]. Geografiska Annaler, 1929, 11: 156-166.
(Edited by Cai Jianying)
10.15918/j.jbit1004-0579.201524.0417
P 407.1 Document code: A Article ID: 1004- 0579(2015)04- 0540- 06
Received 2014- 03- 29
Supported by the National Natural Science Foundation of China(41175037)
E-mail: xhwang@aiofm.ac.cn
杂志排行

Journal of Beijing Institute of Technology的其它文章
- Influence of shear sensitivities of steel projectiles on their ballistic performances
- Triaxial high-g accelerometer of microelectro mechanical systems
- Dynamic modeling and simulation for the rigid flexible coupling system with a non-tip mass
- Multi-constrained model predictive control for autonomous ground vehicle trajectory tracking
- Estimating the clutch transmitting torque during HEV mode-switch based on the Kalman filter
- Optimal tracking control for automatic transmission shift process