GIS定量测量建成环境的适宜缓冲区距离分析
2015-04-15何晓龙段朝阳
何晓龙 段朝阳
1 上海体育学院运动健身科技省部共建教育部重点实验室(上海200438)
2 同济大学附属杨浦医院康复医学科
近年来, 建成环境与体力活动关系的研究引起了广大学者的兴趣, 尤其是在青少年体质研究方面取得了一系列的成果。当前,该领域的研究方法可分为定性研究与定量研究。 随着地理信息系统(geographic information system,GIS)技术在众多领域的推广,应用GIS技术定量测量建成环境指标体系的方法也得到了有效的发展,是该领域定量研究的一种趋势。但无论是采用定性或定量的研究方法, 一般都以建成环境的测量方式为依据[1-3]。然而,要测量影响青少年体力活动的建成环境, 一个重要的前提就是需要知道哪些区域内的建成环境要素会对青少年的体力活动产生影响,因为与个体体力活动直接相关的建成环境并非整个城市空间, 而是与其日常生活紧密相关的特定区域, 如住所、工作地点和通勤区间的周边建成环境等。 该区域,即被称作缓冲区(buffer),是特定的空间对象或集合的邻域, 可以说是地理空间目标的一种影响范围或服务范围[4,5]。
目前在建成环境影响青少年体力活动的研究中,缓冲区的建立主要通过GIS技术以受试者的家庭住址(社区)和(或)学校为中心建立一定距离、不同形状的区域,代表环境暴露。 然而在所设定的一系列距离中,与青少年体力活动敏感性最强的距离才是研究建成环境的“适宜缓冲区距离”,这对于该区域内建成环境状况的认识、制定干预措施具有重要意义。国外在该方面的研究正处于一个快速上升的阶段, 而国内还面临着一片空白。 因此,本文通过对国外使用GIS定量测量建成环境的适宜缓冲区距离进行归纳与讨论, 旨在为国内日后的研究提供参考。
1 研究方法
西方发达国家对建成环境与青少年体力活动的研究一直占据着领先地位,因此本文从Medline、Embase、Pubmed、SportsDiscus和Web of Science等外文数据库中进行检索,以“Built Environment”、“Physical activity”、“youth”、“adolescent”、“children”、“Physical Activity”、“Measurement”、 “Geographic Information System”、“GIS”、 “Global Positioning System”、 “GPS”、“Quantitative”、“buffer”、“radius”、“proximity”、“circular buffer”、“network buffer”、“street-based buffer”和“linebased buffer”等为关键词进行组合检索,检索时间定为1990年1月至2014年6月, 并采用追溯的方法以保证文献齐全。 结果搜索到67篇文献,经过排除,保留有效文献23篇。
2 GIS定量测量建成环境的适宜缓冲区距离
2.1 缓冲区简述
早期的建成环境暴露是以预先设定(pre-defined)的地理边界,如行政单位、县区(counties)、人口普查区域(census tracts)和邮政编码(ZIP codes)等来定义的[6-13]。这种假设的活动空间操作固然简便, 但也存在着各种弊端。随着社会的发展,一个人的流动(包括体力活动)较为频繁,不再局限于一个特定的行政区内部,尤其对于生活在行政区域边界的个体, 可能花更多的时间在临近的行政单位里[13,14];此外,选择行政区域容易导致可塑性面积单元问题 (modifiable areal unit problem,MAUP)。因此,行政单位不能真实反映青少年日常体力活动所发生的区域[15,16], 容易导致错误的环境暴露(exposure misclassification)[14]。
随着GIS技术的应用,缓冲区的创建也得到了长足的发展,其更能代表青少年的日常活动环境,开启了公共卫生领域研究的新纪元[17]。 目前,依靠GIS技术可创建三种不同形状的缓冲区,分别为圆形缓冲区(circular buffer)、 路网缓冲区 (network buffer) 和线形缓冲区(line-based network buffer/liner buffer)等(见图1)。圆形缓冲区, 又叫作crow flies、straight line buffers和airline buffers等[18],通常是以学校或家庭住址为中心就给定的欧式距离(euclidean distance)为半径描绘的圆形区域[19,20],操作较为简便。 路网缓冲区又被称作不规则多边形缓冲区(irregular polygon network),是由目标位置依据街道向外延伸一定距离, 用线将终点的道路网络连接,创建一个目标点周围不规则形状的缓冲区,它所捕获的是一个人基于道路前往目的地的真正可及性。线形缓冲区是沿着要素(如道路、河流等)两侧以及端点向外辐射一定距离的缓冲区域[4,5]。
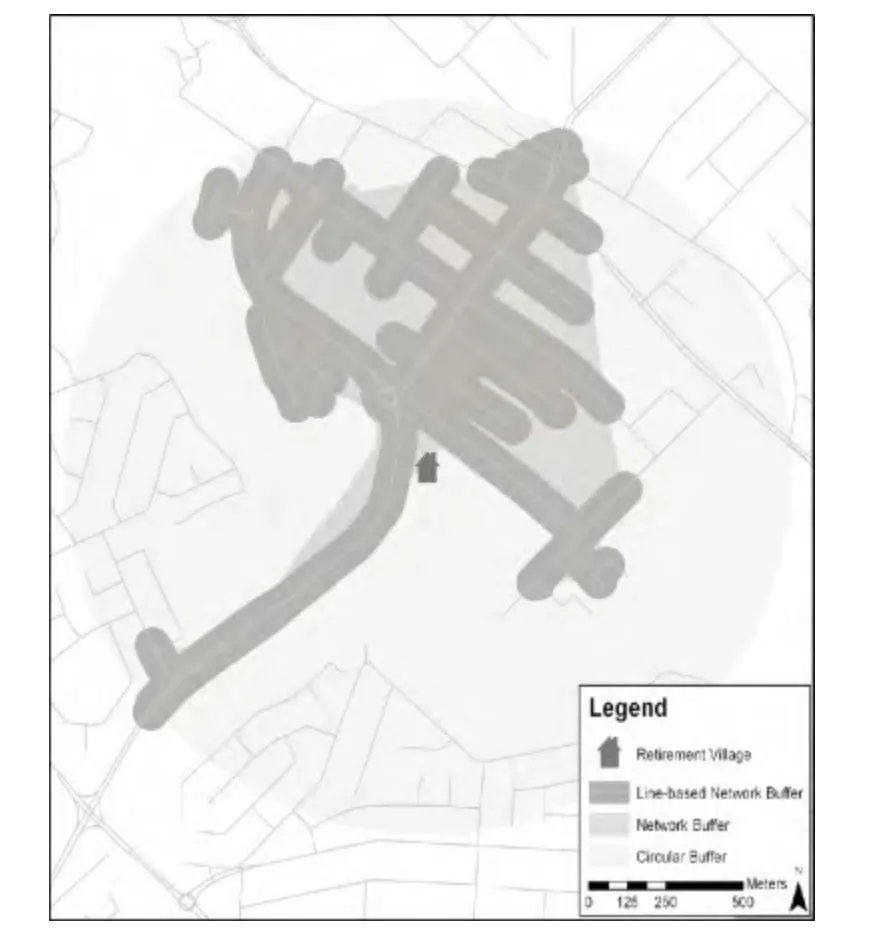
图1 GIS技术所创建的三种缓冲区示意图(引自Boruff等[13])
2.2 不同缓冲区的适宜距离
尽管研究已经表明利用GIS技术定量测量的建成环境缓冲区比行政单位更为准确, 但在具体的研究中到底采取什么类型的缓冲区(圆形缓冲区、路网缓冲区还是线形缓冲区) 以及相同类型的缓冲区所需的适宜缓冲区距离目前还没有统一的标准[21],这阻碍了该领域相同研究的重复与比较[22]。 通过对文献分析发现(见表1),圆形缓冲区的使用频率最高,路网缓冲区次之,线形缓冲区最少。 在圆形缓冲区里,400 m~1600 m(0.25 mile~1 mile)是较为寻常的距离,少数研究采用了2000 m甚至8.05 km的缓冲区距离; 在路网缓冲区里,半径的区间为200 m~1600 m, 1200 m(0.75 mile)较为普遍;在建成环境与青少年体力活动的研究里,线形缓冲区的文献尚且不多,仅有1篇,选用的缓冲区距离为1.6 km(1 mile)。
3 讨论
科学合理的环境暴露是建成环境与青少年体力活动研究的首要前提。缓冲区的建立,一方面强调了与个体密切相关的建成环境, 将那些距离个体生活空间较远的空间元素排除在外;另一方面,使不同区域的研究具备了重复与比较的可能[22]。 然而目前在缓冲区类型的选取以及适宜缓冲区距离测量方面的知识还依然很欠缺[41],导致不同研究的结果不一致[1,42]。
3.1 三种缓冲区各有利弊
圆形缓冲区是以某个中心点和特定距离建立的圆形区域,代表青少年的潜在活动范围,并非所有该区域内的建成环境特征都会吸引青少年体力活动的参与。一些自然状况如铁路、 水域和连通性交叉的道路等显然不是青少年日常体力活动所参与的场所。同时,圆形缓冲区不考虑街道的布局状况。 因此圆形缓冲区会“高估”了青少年的体力活动环境。 然而,由于其操作相对简便,是应用较多的一种缓冲区方法,有文献指出,在使用缓冲区的研究中,圆形占到了73%[43]。 多边形缓冲区与线形缓冲区都是以线(街道、路网)为基本要素。前者以特定的距离沿街道延伸, 并同时向道路两侧旁开一定的宽度, 然后将距离的终点用线连接后围成一个不规则的多边形区域, 代表的是一个人沿着街网所能到达的潜在区域;后者的做法与多边形缓冲区相近,区别在于缓冲区半径的长度不固定, 一直向周围沿着连通性较好的街道延伸, 且在各个道路的终点处并不用线连接,结果是一个更加不规则的图形(见图1)。 人们的空间步行足迹受到路网的影响,由此可见,直线缓冲区所代表的是一个青少年实际所能到达的范围, 这个区域内的建成环境特征对于体力活动的影响显然要大于前两种缓冲区。 这三种类型的缓冲区还面临着地理区域研究的差异问题。Oliver等[42](2007)指出,在街道连通性较为密集的城区与街道连通性较为稀疏的郊区(农村)相比,圆形缓冲区与路网缓冲区所能代表的真实环境暴露区域差别不大, 然而在街道连通性较为稀疏的郊区, 圆形缓冲区的实际用处却比其他两种缓冲区要小,此时就更适宜采用路网缓冲区与直线缓冲区。
另外, 缓冲区的采用也会随着体力活动的类型的差别而改变。比如,一个人的步行与目的地的可及性以及街道的连通性较为关联, 因此线形缓冲区对于步行研究来说也许更能够代表一个人的空间环境暴露[13,42]。
3.2 适宜的缓冲区距离与敏感性分析
纵观文献, 在相同的缓冲区里使用的缓冲区距离也存在较大的差异。 例如, 在使用圆形缓冲区的研究中,有的使用了较大的半径[23,25,26,31],也有的使用了较小的半径[30,32,33]。 较大或较小的缓冲区半径哪一个更能够代表青少年的体力活动环境目前还没有统一的定论。Gordon-Larsen[44]和Sallis[45]认为,5 km的范围内对研究成年人的体力活动较为适合,然而对于青少年而言,缓冲区的范围越小越适合, 主要是因为小范围内其受交通影响较小,其他学者也提出了相同的看法[37,46-48]。 然而也有研究认为,缓冲区的半径越大,青少年日常所能接触到的体力活动设施 (或者有利于体力活动开展的建成环境特征)的机会就越大[49]。 Nelson[50]通过敏感性分析(sensitivity analyses)确定了适合青少年体力活动研究的缓冲区尺度较大,为3 km。
同时, 很多缓冲区的半径是依据社区的定义来选择的。 比如,Colabianchi等[51]经研究得出适宜青少年女生的社区适宜步行的时间为14.7±8.7 min, 约等于15 min,相当于0.75 mile(1200 m),并为很多研究所引用。也有研究认为半径为1600 m(1 mile)更能代表社区的定义,约为20 min的步行[52,53]。
除了常用的几种缓冲区半径外, 还有学者以家庭周围(社区)或学校为中心建立不同的缓冲区半径,采用敏感性分析, 找出与青少年体力活动较为密切联系的距离来代表更科学的建成环境暴露。 Boone-Heinonen等[26]分析了17659名青少年的中高强度体力活动(MVPA)数据发现,不同缓冲区规模——1 km、3 km、5 km和8.05 km缓冲区半径内的体力活动设施数量与街道连通性与青少年的MVPA有关。 其中,3km以内的体力活动设施数量、1 km内的交叉口密度与其MVPA最有一致性的联系。 van Loon等(2014)[33]在366名青少年的家庭周围分别创建了半径为200 m、400 m、800 m和1600 m(1 mile)的路网缓冲区定义社区范围,来检测与8~11岁青少年的MVPA最为关联的社区建成环境特征。 结果发现,在设定的几个半径模型里,最大的缓冲区距离(1600 m) 与青少年的体力活动的联系较为紧密。由此看来,利用多重缓冲区尺寸对青少年的体力活动进行敏感性分析对于适宜缓冲区距离的确定有着重要意义[54]。
3.3 未来加大GPS的使用
尽管敏感性分析可能是较为科学的方法,但不同缓冲区半径的选择仍然依靠作者主观的随意选择性[55],对于客观反映建成环境与体力活动的相互关系来说,仍然不是最佳选择。 有研究指出,青少年的体力活动会随着建成环境特征的改变而改变[56-58],因此详尽的体力活动背景信息能为研究者提供更完整的环境暴露评估[59-61]。而环境暴露对体力活动的最大影响因素在于体力活动开展的地点与时间[62],基于此点,GPS已逐渐被引用到该领域的研究当中, 被认为是一种较为有效的工具[63]。
GPS由定位卫星、地面监控系统和定位接收器三个部分组成。 定位原理即根据高速运动的卫星瞬间位置作为已知的起算数据,采用空间距离后方交汇的方法,确定待测点的位置。它不仅提供三维坐标,还显示精确的时空和速度数据,因此可用来测量体力活动环境[64]。
Maddison等[65]同时采用GIS、GPS和加速度计对12~17岁高中学生的4天体力活动模式进行了研究,结果发现, 周一到周五体力活动主要发生在学校周边1 km的缓冲区内或家庭周围150 m的范围内,每天的中等强度体力活动(MPA)平均为74 ± 36 min,高强度体力活动(VPA)为7.5 ± 8 min,周六和周日青少年的体力活动与上学日截然不同,主要发生在家庭周围的户外环境。这样,基于GPS的体力活动追踪对于客观反映建成环境与体力活动之间的相互关系更为科学, 被认为是环境暴露研究的一大进步[66],也是该领域以后的研究方向与热点。
4 小结
基于GIS定量测量建成环境的三种缓冲区比传统的行政单位更加准确,且各有侧重点。目前统一的适宜缓冲区距离仍未得到广泛共识。 通过设置多重缓冲区尺寸进行敏感性分析得出的缓冲区距离较为科学。 在将来的研究中,侧重GPS的使用,将更能反映青少年日常体力活动与建成环境之间的相互联系。
[1] Brownson RC,Hoehner CM,Day K,et al. Measuring the built environment for physical activity:state of the science. Am J Prev Med,2009,36(4 Suppl): S99-S123.
[2] Stark S,Hollingsworth HH,Morgan KA,et al. Development of a measure of receptivity of the physical environment.Disability Rehab,2007,29(2):123-137.
[3] Kirtland KA,Porter DE,Addy CL,et al. Environmental measures of physical activity supports:perception versus reality. Am J Prev Med,2003,24(4):323-331.
[4] 王法辉. 基于GIS的数量方法与应用[M].北京:商务印书馆,2009:47-50.
[5] 邬伦,刘瑜,张晶. 地理信息系统-原理、方法和应用[M].科学出版社,北京,2012:3-31.
[6] Mujahid MS,Diez Roux AV,Shen M,et al. Relation between neighborhood environments and obesity in the multi-ethnic study of atherosclerosis. Am J Epidemiol,2008,167:1349-1357.
[7] Lopez RP. Neighborhood risk factors for obesity. Obesity,2007,15(8):2111-2119.
[8] Joshu CE,Boehmer TK,Brownson RC,et al. Personal,neighbourhood and urban factors associated with obesity in the United States. J Epidemiol Community Health,2008,62(3):202-208.
[9] James P,Troped PJ,Hart JE,et al. Urban sprawl,physical activity,and body mass index: nurses' health study and nurses' health study II. Am J Public Health,2013,103:369-375.
[10] Ewing R,Brownson RC,Berrigan D. Relationship between urban sprawl and weight of United States youth. Am J Prev Med,2006,31(6):464-474.
[11] Kwan MP. From place -based to people -based exposure measures. Social Science & Medicine,2009,69:1311-1313.
[12] Boone JE,Gordon-Larsen P,James D,et al.Validation of a GIS facilities database: quantification and implications of error. Ann Epidemiol,2008,18(5):371-377.
[13] Boruff BJ,Nathan A,Nijenstein S.Using GPS technology to(re) -examine operational definitions of 'neighbourhood' in place-based health research. Int J Health Geogr,2012,11:22.
[14] Duncan DT,Piras G,Dunn EC,et al.The built environment and depressive symptoms among urban youth: A spatial regression study. Spat Spatiotemporal Epidemiol,2013,5:11-25.
[15] Vallée J,Cadot E,Grillo F,et al. The combined effects of activity space and neighbourhood of residence on participation in preventive health-care activities: the case of cervical screening in the Paris metropolitan area. Health Place,2010,16(5):838-852.
[16] Matthews SA. The salience of neighborhood: some lessons from sociology. Am J Prev Med,2008,34(3):257-259.
[17] Charreire H,Casey R,Salze P,et al. Measuring the food environment using geographical information systems:A methodological review. Public Health Nutr,2010,13 (11):1773-1785.
[18] Forsyth A,Van Riper D,Larson N,et al.Creating a replicable,valid cross -platform buffering technique: The sausage network buffer for measuring food and physical activity built environments. Int J Health Geogr,2012,11:14.
[19] Rutt CD,Coleman KJ. Examining the relationships among built environment,physical activity,and body mass index in El Paso,TX. Prev Med,2005,40(6):831-841.
[20] Nelson MC,Gordon-Larsen P,Song Y,et al. Built and social environments associations with adolescent overweight and activity. Am J Prev Med,2006,31(2):109-117.
[21] Leal C,Chaix B. The influence of geographic life environments on cardiometabolic risk factors: a systematic review,a methodological assessment and a research agenda.Obes Rev,2011 ,12(3):217-230.
[22] Dunton GF,Kaplan J,Wolch J,et al.Physical environmental correlates of childhood obesity: a systematic review.Obes Rev,2009,10(4):393-402.
[23] Jago R,Baranowski T,Baranowski JC. Observed,GIS,and self-reported environmental features and adolescent physical activity.Am J Health Promot,2006,20(6):422-428.
[24] Pate RR,Colabianchi N,Porter D,et al. Physical activity and neighborhood resources in high school girls. Am J Prev Med,2008,34(5):413-419.
[25] Timperio A,Jeffery RW,Crawford D,et al. Neighbourhood physical activity environments and adiposity in children and mothers: a three-year longitudinal study. Int J Behav Nutr Phys Act,2010,19(7):18.
[26] Boone -Heinonen J,Popkin BM,Song Y,et al. What neighborhood area captures built environment features related to adolescent physical activity? Health Place,2010,16(6):1280-1286.
[27] Wolch J,Jerrett M,Reynolds K,et al. Childhood obesity and proximity to urban parks and recreational resources: a longitudinal cohort study.Health Place,2011,17(1):207-214.
[28] Trilk JL,Ward DS,Dowda M,et al. Do physical activity facilities near schools affect physical activity in high school girls? Health Place,2011,17(2):651-657.
[29] Gropp KM,Pickett W,Janssen I.Multi-level examination of correlates of active transportation to school among youth living within 1 mile of their school. Int J Behav Nutr Phys Act,2012,16(9):124.
[30] Lovasi GS,Schwartz-Soicher O,Quinn JW,et al. Neighborhood safety and green space as predictors of obesity among preschool children from low-income families in New York City. Prev Med,2013,57(3):189-193.
[31] Carvera A,Panter JR,Jones AP,et al. Independent mobility on the journey to school: A joint cross -sectional and prospective exploration of social and physical environmental influences. J Trans Health, 2014,1(1):25-32.
[32] Prins RG,Ball K,Timperio A,et al. Associations between availability of facilities within three different neighbourhood buffer sizes and objectively assessed physical activity in adolescents. Health Place,2011,17(6):1228-1234.
[33] van Loon J,Frank LD,Nettlefold L,et al. Youth physical activity and the neighbourhood environment: examining correlates and the role of neighbourhood definition. Soc Sci Med,2014,104:107-115.
[34] Colabianchi N,Coulton CJ,Hibbert JD,et al. Adolescent selfdefined neighborhoods and activity spaces: spatial overlap and relations to physical activity and obesity.Health Place,2014,27:22-29.
[35] Cradock AL,Melly SJ,Allen JG,et al. Youth destinations associated with objective measures of physical activity in adolescents.J Adolesc Health,2009,45(3 Suppl):S91-98.
[36] Norman JG,Nutter SK,Ryan S,et al. Community design and access to recreational facilities as correlates of adolescent physical activity and body-mass index. J Phys Act Health,2006,3(Suppl 1), S118-S128.
[37] Scott MM,Evenson KR,Cohen DA,et al. Comparing perceived and objectively measured access to recreational facilities as predictors of physical activity in adolescent girls.J Urban Health,2007 ,84(3):346-359.
[38] Frank LD,Engelke P,Schmid TL.Obesity relationships with community design,physical activity,and time spent in cars.Am J Prev Med,2004,27(2):87-96.
[39] Tucker P,Irwin JD,Gilliland J,et al. Environmental influences on physical activity levels in youth. Health Place,2009,15(1):357-363.
[40] McDonald K,Hearst M,Farbakhsh K,et al. Adolescent physical activity and the built environment: a latent class analysis approach. Health Place,2012,18(2):191-198.
[41] Diez Roux AV. Estimating neighborhood health effects: the challenges of causal inference in a complex world. Soc Sci Med,2004,58(10):1953-1960.
[42] Oliver LN,Schuurman N,Hall AW. Comparing circular and network buffers to examine the influence of land use on walking for leisure and errands. Int J Health Geogr,2007,20(6):41.
[43] Auchincloss AH,Gebreab SY,Mair C,et al. A review of spatial methods in epidemiology,2000 -2010. Annu Rev Public Health,2012,33:107-122.
[44] Gordon-Larsen P,Nelson M,Page P,et al. Inequality in the built environment underlies key health disparities. Pediatrics,2006,117(2):417-424.
[45] Sallis J,Hovell M,CRHofstetter,et al. Distance between homes and exercise facilities related to frequency of exercise among San Diego residents. Public Health Rep,1990,105(2):179-185.
[46] Jago R,Baranowski T,Harris M.Relationships between GIS environmental features and adolescent male physical activity:GIS coding differences.J Phys Act Health,2006,3 (3) : 230-242.
[47] Cohen DA,Ashwood JS,Scott MM,et al. Public parks and physical activity among adolescent girls. Pediatrics,2006,118(5):e1381-e1389.
[48] Boone -Heinonen J,Popkin BM,Song Y,et al. What neighborhood area captures built environment features related to adolescent physical activity? Health Place 201,16 (6):1280-1286.
[49] Prins RG,Ball K,Timperio A,et al.Associations between availability of facilities within three different neighbourhood buffer sizes and objectively assessed physical activity in adolescents. Health Place,2011,17(6):1228-1234.
[50] Nelson MC,Gordon-Larsen P,Song Y,et al. Built and Social Environments: Associations with Adolescent Overweight and Activity. Am J Pre Med,2006,31(2):109-117.
[51] Colabianchi N,Dowda M,Pfeiffer KA,et al. Towards an understanding of salient neighborhood boundaries: adolescent reports of an easy walking distance and convenient driving distance. Int J Behav Nutr Phys Activity,2007,4:66.
[52] Dengel DR,Hearst MO,Harmon JH,et al. Does the built environment relate to the metabolic syndrome in adolescents?Health Place,2009,15(4):946-951.
[53] Timperio A,Salmon J,Telford A,et al. Perceptions about the local neighborhood and walking and cycling among children.Prev Med,2004,38(1):39-47.
[54] Emch M,Ali M,Park JK,et al. Relationship between neighbourhood level killed oral cholera vaccine coverage and protective efficacy: evidence for herd immunity. Int J Epidemiol,2006,35(4):1044-1050.
[55] Rainham DG,Bates CJ,Blanchard CM,et al.Spatial classification of youth physical activity patterns.Am J Prev Med,2012,42(5):e87-96.
[56] Casey R,Oppert JM,Weber C,et al.Determinants of childhood obesity: What can we learn from built environment studies? Food Qual Prefer,2014,31:164-172.
[57] Cummins S,Curtis S,Diez-Roux AV,et al. Understanding and representing 'place' in health research: a relational approach. Soc Sci Med,2007,65(9):1825-1838.
[58] van Loon J,Frank LD,Nettlefold L,et al.Youth physical activity and the neighbourhood environment: Examining correlates and the role of neighbourhood definition. Soc Sci Med,2014,104:107-115.
[59] Kestens Y,Lebel A,Daniel M,et al. Using experienced activity spaces to measure foodscape exposure. Health Place 2010,16(6):1094-1103.
[60] Setton E,Marshall JD,Brauer M,et al. The impact of daily mobility on exposure to traffic-related air pollution and health effect estimates. J Expo Sci Environ Epidemiol,2010,21(1):42-48.
[61] Perchoux C,Chaix B,Cummins S,et al. Conceptualization and measurement of environmental exposure in epidemiology:Accounting for activity space related to daily mobility. Health Place,2013,21:86-93.
[62] Kwan MP,Peterson RD,Browning CR,et al. Reconceptualizing sociogeographic context for the study of drug use,abuse,and addiction. Berlin:Springer,Thomas YF,Richardson D,Cheung I (Eds.),Geography and drug addiction (2008):437-446.
[63] Maddison R,Ni Mhurchu C. Global positioning system: a new opportunity in physical activity measurement. Int J Behav Nutr Phys Act,2009,6: 73.
[64] Shoval N. Tracking technologies and urban analysis. Cities,2008,25,21-28.
[65] Maddison R,Jiang Y,Vander Hoorn S,et al. Describing patterns of physical activity in adolescents using global positioning systems and accelerometry. Pediatr Exerc Sci,2010,22(3):392-407.
[66] Chaix B,Me′ line J,Duncan S,et al. GPS tracking in neighborhood and health studies: A step forward for environmental exposure assessment, a step backward for causal inference?.Health Place,2013,21:46-51.