Based Machinery Condition Prediction Based on Support Vector Machine Model with Wavelet Transform
2014-08-12LIUShujie刘淑杰LUHuitian陆惠天LIChaoHUYawei胡娅维ZHANGHongchao张洪潮
LIU Shu-jie(刘淑杰), LU Hui-tian(陆惠天), LI Chao(李 超), HU Ya-wei(胡娅维), ZHANG Hong-chao(张洪潮),3,
1 School of Mechanical Engineering, Dalian University of Technology, Dalian 116024, China 2 Department of Construction & Operations Management, South Dakota State University, Brookings SD 57007, USA 3 Department of Industrial Engineering, Texas Tech University, Lubbock TX79409, USA 4 Offshore Oil Engineering Co., Ltd., Tianjin 300450, China
Based Machinery Condition Prediction Based on Support Vector Machine Model with Wavelet Transform
LIU Shu-jie(刘淑杰)1*, LU Hui-tian(陆惠天)2, LI Chao(李 超)1,4, HU Ya-wei(胡娅维)1, ZHANG Hong-chao(张洪潮)1,3,
1SchoolofMechanicalEngineering,DalianUniversityofTechnology,Dalian116024,China2DepartmentofConstruction&OperationsManagement,SouthDakotaStateUniversity,BrookingsSD57007,USA3DepartmentofIndustrialEngineering,TexasTechUniversity,LubbockTX79409,USA4OffshoreOilEngineeringCo.,Ltd.,Tianjin300450,China
Soft failure of mechanical equipment makes its performance drop gradually, which occupies a large proportion and has certain regularity. The performance can be evaluated and predicted through early state monitoring and data analysis. The vibration signal was modeled from the double row bearing, and wavelet transform and support vector machine model (WT-SVM model) was constructed and trained for bearing degradation process prediction. Besides Hazen plotting position relationships was applied to describing the degradation trend distribution and a 95% confidence level based ont-distribution was given. The single SVM model and neural network (NN) approach were also investigated as a comparison. Results indicate that the WT-SVM model outperforms the NN and single SVM models, and is feasible and effective in machinery condition prediction.
supportvectormachine(SVM);wavelettransform(WT);vibrationintensity;probabilisticforecasting
Introduction
Condition trend prediction aims at soft failure of mechanical equipment. A soft failure is defined as a failure, fault, defect, or error that results in a temporary system stoppage; such a system stoppage can be returned to a successful system performance state by system hardware reset, software performance reset, gradual return to equilibrium, or a non-repair maintenance action[1]. Soft failure is due to performance degradation of certain components in the long term, which causes performance parameter to exceed the allowable value, eventually. This kind of fault occupies a large proportion and has certain regularity. It can be evaluated and predicted through early condition monitoring and data analysis. Various operating parameters and signals such as vibration, noise, and temperature in the running process of mechanical equipment, can be seen as a time-based process[2]. We can identify the working condition and predict the future trend of mechanical equipment through this kind of signals.
Support vector machine (SVM) is a machine learning algorithm proposed in 1990s and based on Vapnik’s statistical learning theory[3]. SVM is not based on traditional empirical risk minimization principle, but Vapnik-Chervonenkis(VC) dimension theory and structural risk minimization principle in statistics[4]. SVM can solve the structural problems of high dimensional model with limited number of samples, and has good predictive performance. The initial SVM is mainly applied in pattern recognition problems. Through research and development of short-term, SVM also makes a good result in regression[5]. SVMs have been used by researchers to solve classification and regression problems. Several research studies demonstrate the good performance of these techniques in the forecasting modeling but few can give a probabilistic forecasting.
In 1970s, French geophysicist Jean Morlet proposed the concept of wavelet transform (WT). In 1980s, French scientist Meyer and his colleagues developed the system of wavelet analysis. The main algorithm of WT was proposed by French scientist Stephane Mallat in 1988[6-7]. WT describes a time-series by dividing it into scales (frequency regions). These scales are analyzed by use of a scale dependent wave function travelling along the specific scale time-axis. The WTs thereby give both frequency and time resolutions while the Fourier transform (FT) only gives frequency resolution.
In this paper, the SVM approach is exploited for mechanical equipment probabilistic degradation forecasting. Simultaneously, WT, a powerful multi-resolution analysis method, is introduced into the SVM model to reduce the influence of irregular characteristics and simultaneously simplify the complexity of the original signal. The WT-SVM model is applied in a case study to modeling the vibration signal from the double row bearing and expected to more accurately obtain probabilistic forecasting results under a certain confidence level based on plotting position relationships andt-distribution.
1 Proposed Strategy of Combining SVM with WT
Various operating parameters and signals such as vibration, noise, and temperature in the running process of mechanical equipment, can be used to identify the working condition and predict the future trend of mechanical equipment. However these characteristic signals are usually the result of the interaction of various factors with irregular characteristics, such as chaos, typing, nonlinear, the data has multi-scale characteristics. WT can decompose a complicated signal into many sub-signals under the wavelet families through dilating and translating the mother wavelet. Each scale can be seen as different “band”. The characteristics of the sequence can be shown more clearly[8-10]. In this paper, the WT is thus introduced into the SVM for modeling. The architecture of the proposed combination model is shown in Fig.1.
In this combination strategy, with the given scaling function and wavelet function the original data are first decomposed in the different scales by multi-resolution analysis (MRA). The SVM regression method is then constructed to model through the data of each band and identify the actual relationship model between the input and output data. Synthesize the forecasting results of each frequency and the vibration intensity can be obtained. The probabilistic forecasting can be calculated based on plotting position relationships andt-distribution. Note that the preprocessed characteristic data reduce the influence of irregular characteristics and simultaneously simplify the complexity of the original data model[11-12]. Results show that the proposed WT-SVM model can more accurately model and compensate the behavior of the characteristic signals and show better modeling speed and generalization performance than those of SVM model.

Fig.1 Flow chart of the proposed combination model
2 Case Study
The vibration signals used in this paper are provided by the Center for Intelligent Maintenance Systems (IMS), University of Cincinnati[13]. The experimental data sets are generated from bearing run-to-failure tests under constant load conditions on a specially designed test rig. The bearing test rig hosts four test Rexnord ZA-2115 double row bearings on one shaft. The shaft is driven by an AC motor and coupled by rub belts. A radial load of 6000 lbs is added to the shaft and bearing by a spring mechanism. The rotation speed is kept constant at 2000 r/min. A PCB 353B33 high sensitivity quartz ICP accelerometer is installed and data collection is done using a National Instruments LabVIEW program. The data sampling rate is 20 kHz and the data length is 20 480 points. It took a total of 7 d until the bearing fails. At the end, one bearing with serious wrecked was used to verify the performance of the model.
The vibration intensity is calculated through each of the 10 min sampling data while the sampling interval is kept 10 min, shown in Fig.2. Before the 700th points, the bearing is working at a normal state, so the 780-930 points are used to train the SVM model and the following 50 points are employed for testing.

Fig.2 Bearing vibration intensity curve
In WT-SVM model, db5 wavelet is selected as wavelet function, and two layers of wavelet decomposition is conducted getting a low frequency component and two high frequency components. The calibration and the subsequent forecasting work of SVR in this study were performed by resorting to the LIBSVM software package[14]. The LIBSVM software is freeware, and the source codes, written in C++, are open to public. This study has modified the codes for this tool wearing assessment. The radial basis function (RBF) kernel is used to construct the SVM model. The error toleranceεis set to 0.01. The grid search method with a cross validation technique[15]was used to derive the SVR model parameters, including the penalty parameterCand the kernel parameterγ. The search range is 2-8-28and the search step is set at 1.0. A three-fold cross validation was used, and the parameters were obtained by the minimum RMSE regarding each-fold cross validation. The model parameters were then determined by averaging the derived three sets of parameters from cross validation, and the root mean square percentage error (RMSE) was simulated through the calibration events. In order to verify the proposed advantage in predict the bearing degradation process, single SVM model and the neural network (NN) model are used to achieve the prediction. Figures 3(a), (b), and (c) are the results of the one-step ahead forecasting performed on WT-SVM, SVM, and NN models respectively. The trend of the bearing running state can be predicted by optimized WT-SVM model effectively and the predicted result with the proposed optimized model is very close to the actual degradation curve.
Forecasting error, the deviation between model prediction and the real value, exists inevitably because of the effect of uncertain factors. In order to explicitly indicate the respective modeling performance of the three different models, we adopt relative error (RE), mean absolute percentage error (MAE), and RMSE as evaluation criteria in the paper, which are calculated as:

(1)
(2)

(3)

Figure 4 is the REs of one-step ahead forecasting in WT-SVM, SVM, and NN models respectively. MAE and RMSE values of each model are expressed in Table 1. From Table 1, we can see that the MAE and RMSE of three prediction methods are very different. The MAE and RMSE of the actual and the predicted result are 1.92% and 2.37%, so the proposed method can closely track the changes of trending condition of the bearing. SVM model has a big error in some forecasting points and the prediction error of SVM is larger than the proposed method; after calculation, the prediction error is 8.22% (MAE) and 11.33% (RMSE). The NN model works relatively bad and the prediction error is larger than WT-SVM model and SVM model.

(a) WT-SVM model

(b) SVM model

(c) NN modelFig.3 The one-step ahead forecasting performed
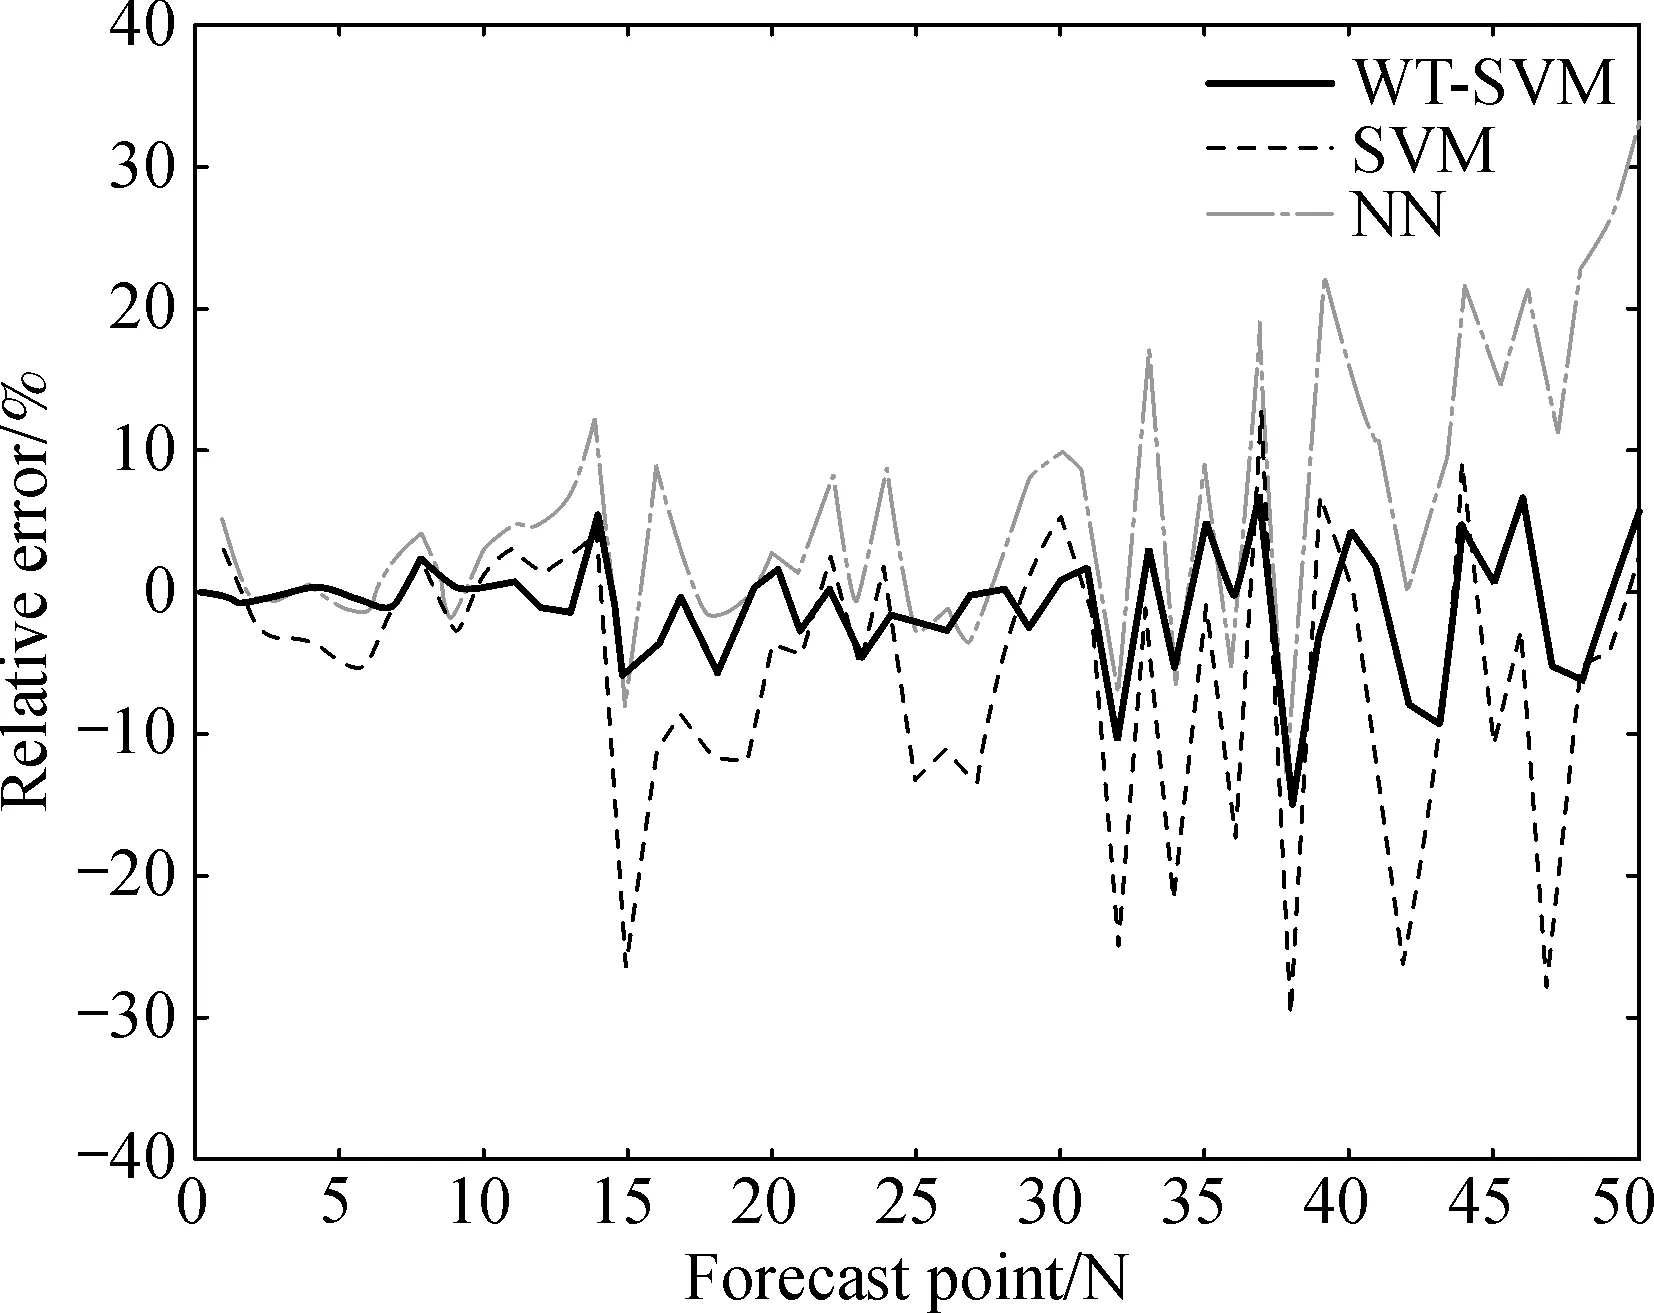
Fig.4 REs of one-step ahead forecasting in WT-SVM, SVM and NN models

ModelMAE/%RMSE/%WT-SVM1.922.37SVM8.2211.33NN10.0214.57
The 95% predicted confidence intervals based on WT-SVM model and SVM model ont-distribution (α=0.05) are expressed in Figs. 5(a) and (b). The confidence interval width of SVM model is larger than that of WT-SVM model. The confidence intervals reasonably present the uncertainty characteristics, because confidence regions enclose most of the data.

(a) WT-SVM

(b) SVMFig.5 Forecasting confidence intervals based on t-distribution in WT-SVM and SVM
This work applied Hazen plotting position relationships to describing the degradation trend distribution oft. Probability distributions can be produced by the proposed probabilistic forecasting model at each time step. Figure 6 presents predictive probability distributions calculated at forecast pointN=40-45 based on WT-SVM model. The probability distribution assigns an exceedance probability to a specific future RMS. We set 0.18 A/g as a threshold for the RMS. When the RMS value exceeds the threshold, we consider the bearing fails. At forecast pointN=40, the probability that the future RMS exceeds 0.18 A/g is 0.0%, while atN=45 forecasting, the exceedance probability is nearly 100%. The possibilities that the RMS value exceeds the threshold at forecast pointN=40-45 are correspondingly [2.41%, 8.62%, 29.31%, 66.55%, 94.13%, 99.66%], and it can be seen that the reliability reduces gradually with increase of forecast step.
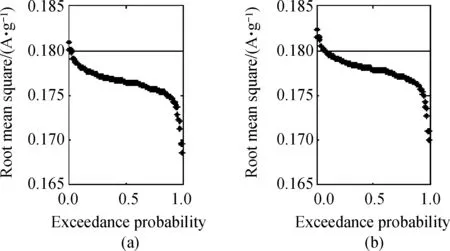
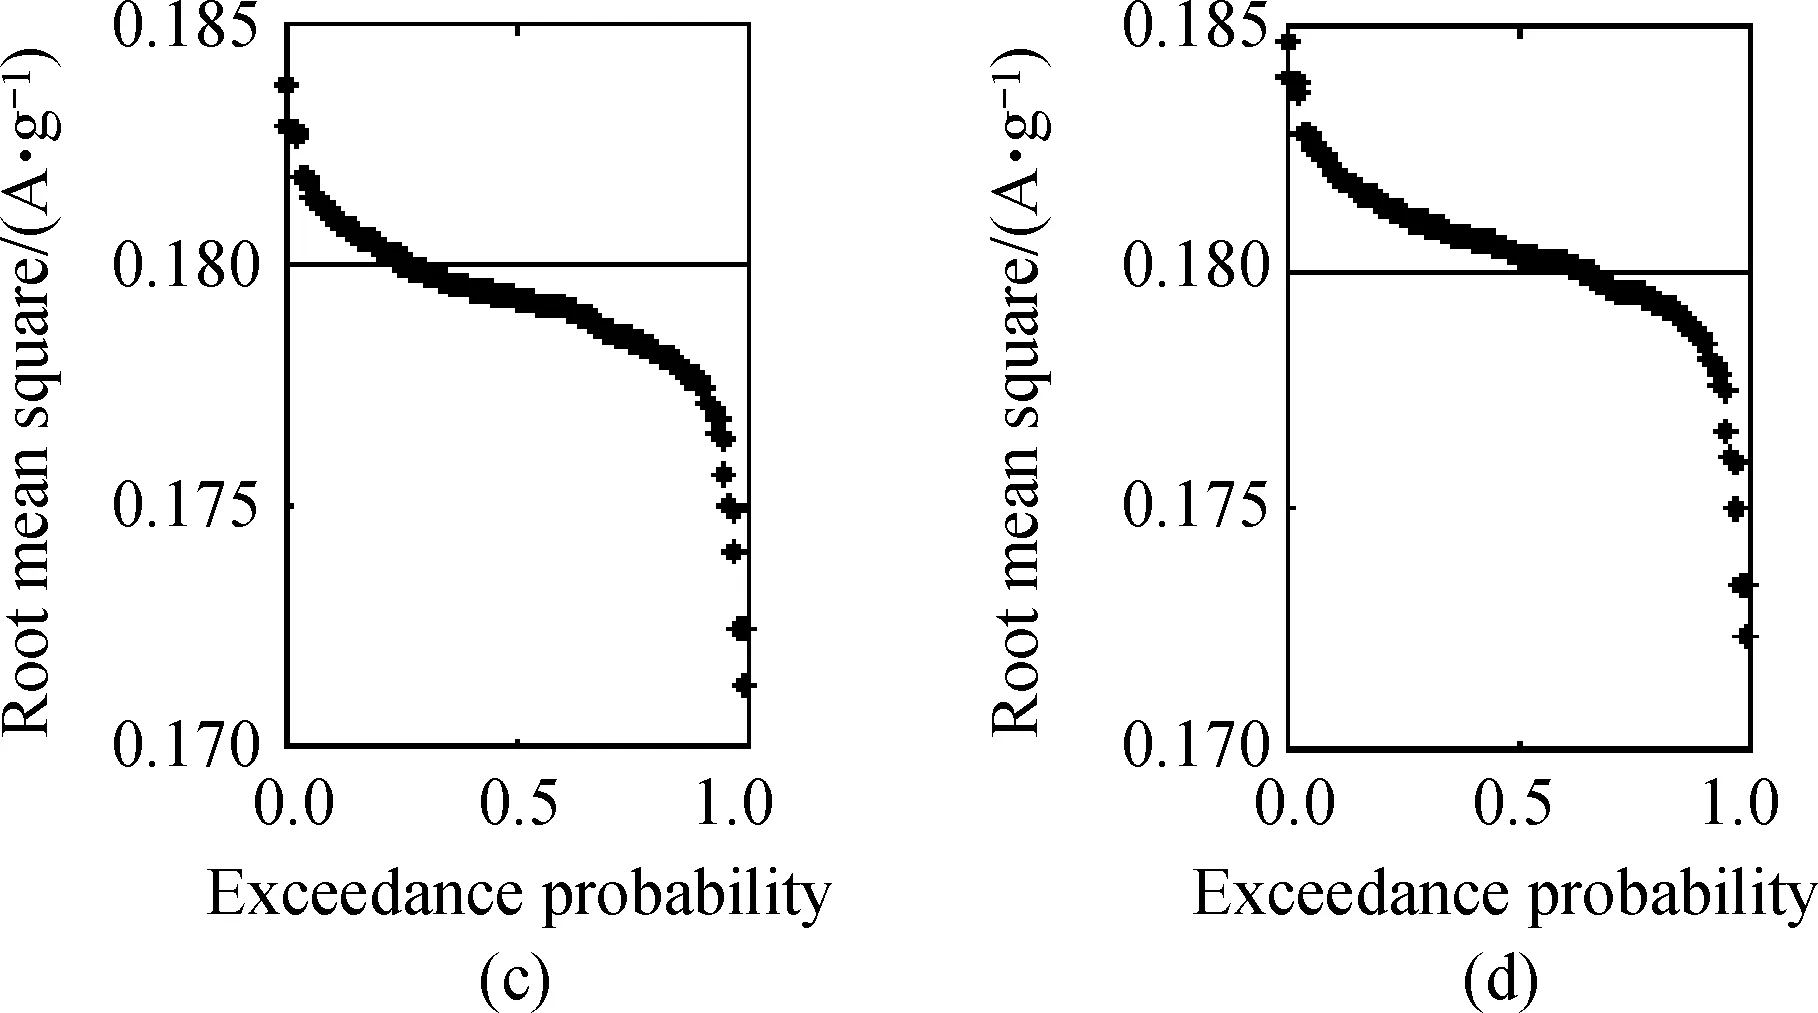

Fig.6 Predictive probability distributions: (a) N=40, (b) N=41, (c) N=42, (d) N=43, (e) N=44, and (f) N=45
3 Conclusions
The work presented in this paper demonstrates the application of SVM combined with WT in machinery condition prediction. WT can reduce the influence of irregular characteristics and simultaneously simplify the complexity of the original signal. In the case study, WT-SVM model is constructed and trained for bearing degradation process prediction. The degradation reliability can be properly calculated with probabilistic forecasting results. Hazen plotting position relationships is applied to describing the degradation trend distribution and a 95% confidence level based ont-distribution is given. The case study results show that WT-SVM model outperforms the NN and single SVM model and is more feasible and effective. Applying it into machinery condition prediction, it will be helpful in improving the detection ability of early faults, reducing maintenance, and improving other aspects.
[1] Chenoweth H B. Soft Failures and Reliability [C]. Reliability and Maintainability Symposium, Los Angeles, CA, USA, 1990: 419-424.
[2] Christmann A, Steinwart I. Support Vector Machines [M]. New York: Springer, 2008.
[3] Jardine A K S, Lin D, Banjevic D. A Review on Machinery Diagnostics and Prognostics Implementing Condition-Based Maintenance [J].MechanicalSystemsandSignalProcessing, 2006, 20(7): 1483-1510.
[4] Vapnik V N. Statistical Learning Theory [M]. New York: Wiley, 1998.
[5] Furey T S, Cristianini N, Duffy N,etal. Support Vector Machine Classification and Validation of Cancer Tissuesamples Using Microarray Expression Data [J].Bioinformatics, 2000, 16: 906-914.
[6] Mallat S G. A Theory for Multiresolution Signal Decomposition: the Wavelet Representation [J].IEEETransactionsonPatternAnalysisandMachineIntelligence, 1989, 2(7): 674-693.
[7] Erdöl N, Basbug F. Wavelet Transform Based Adpative Filters: Analysis and New Reswlts [J]. IEEE Tranavtionson Signal Processing, 1996, 44(9): 2163-2171.
[8] Hu Q, He Z J, Zhang Z S,etal. Fault Diagnosis of Rotating Machinery Based on Improved Wavelet Package Transform and SVMs Ensemble [J].MechanicalSystemsandSignalProcessing, 2007, 21(2): 688-705.
[9] He H B, Starzyk J A. A Self-organizing Learning Array System for Power Quality Classification Based on Wavelet Transform [J].IEEETransactionsonPowerDelivery, 2005, 21(1): 286-295.
[10] Millet-Roig J, Ventura-Galiano R, Chorro-Gasco F J,etal. Support Vector Machine for Arrhythmia Discrimination with Wavelet Transform-Based Feature Selection [C]. Computers in Cardiology, Cambridge, MA, USA, 2000: 407-410.
[11] Zhang L, Zhou W D, Jiao L C. Wavelet Support Vector Machine [J].IEEETransactionsonSystems,ManandCybernetics—PartB:Cybernetics, 2004, 34(1): 34-39.
[12] Tong S, Koller D. Support Vector Machine Active Learning with Applications to Text Classification [J].TheJournalofMachineLearningResearch, 2002, 2: 45-66.
[13] Lee J, Qiu H, Yu G,etal. NASA Ames Prognostics Data Repository, Rexnord Technical Services: Bearing DataSet [DB/OL]. (2012) [2014]. http://ti.arc.nasa.gov/project/prognostic-data-repository.
[14] Chang C C, Lin C J. LIBSVM: a Library for Support Vector Machines [CP/OL]. (2001)[2014]. http://www.csie.ntu.edu.tw/~cjlin/papers/libsvm.pdf.
[15] Hsu C W, Chang C C, Lin C J. A Practical Guide to Support Vector Classification [R]. Department of Computer Science and Information Engineering, National Taiwan University, Taipei, China, 2003.
National Natural Science Foundation of China (No. 51205043); the Special Fundamental Research Funds for Central Universities of China (No. DUT14QY21)
1672-5220(2014)06-0831-04
Received date: 2014-08-08
* Correspondence should be addressed to LIU Shu-jie, E-mail: liushujie@dlut.edu.cn
CLC number: TH17 Document code: A
杂志排行

Journal of Donghua University(English Edition)的其它文章
- Optimization of Quality Consistency Problem of Electromechanical Component due to Manufacturing Uncertainties with a Novel Tolerance Design Method
- Effect of Starch Dodecenylsuccinylation on the Adhesion and Film Properties of Dodecenylsuccinylated Starch for Polyester Warp Sizing
- Interval Fault Tree Analysis of Excavator Variable-Frequency Speed Control System
- Combinatorial Optimization Based Analog Circuit Fault Diagnosis with Back Propagation Neural Network
- Reliability Allocation of Large Mining Excavator Electrical System Based on the Entropy Method with Failure and Maintenance Data
- Deployment Reliability Test and Assessment for Landing Gear of Chang’E-3 Probe