Global Mission Sensitivity Study for Phased Mission System with Analysis of Variance Method
2014-08-12WUXinyang吴昕阳WUXiaoyue武小悦
WU Xin-yang(吴昕阳), WU Xiao-yue(武小悦)
College of Information System and Management, National University of Defense Technology, Changsha 410073, China
Global Mission Sensitivity Study for Phased Mission System with Analysis of Variance Method
WU Xin-yang(吴昕阳)*, WU Xiao-yue(武小悦)
CollegeofInformationSystemandManagement,NationalUniversityofDefenseTechnology,Changsha410073,China
A comprehensive mission sensitivity analysis index based on Sobol’s index called global mission sensitivity (GMS) was proposed in this paper which focused on analyzing the mission sensitivity of components of phased mission systems (PMS). The simulation strategy of GMS based on a Petri net and Monte Carlo method was presented which had broad applicability. Finally, the GMS and Birnbaum’s sensitivity of components in a PMS example were compared. The GMS of component is demonstrated to be more adaptable to reflect the component mission sensitivity when the rated reliability parameters of components cannot be obtained, and components have state dependency or the system is subjected to common cause failure.
phasedmissionsystem(PMS);globalmissionsensitivity(GMS);Sobol’sindex
Introduction
Sensitivity analysis is widely used in practice to find out the component contributing most to the system non-reliability, which is also called importance analysis[1]. Since the 1960s, many literatures have concentrated on the component sensitivity analysis. Sensitivity to an input parameter is mostly often defined as the partial derivative of the reliability with respect to that parameter[1]. As a result, these sensitivity analyses are local, for they mainly help to determine the influence of a small parameter variation at nominal values. Actually, in some cases, it is significant to take account of the variation effect in its entire range of the input variables. (e.g., the rated values of the input parameters are not available, or the rated values of the input parameters cannot reflect its real value.) Besides, the rated values are estimated values whose accuracies are subjected to the estimation method. If the rated values are inaccuracy, the truly sensitivities of components may not be obtained. Meanwhile, the system structure function may not be exactly depicted with the system complexity degree constantly increasing. Hence, more and more researches have focused on global sensitivity analysis, such as nonparametric techniques[2], moment-independent sensitivity measures[3], and variance-based sensitivity measure indices, among which variance-based sensitivity measures have a quite general applicability, because they could simply and effectively reflect the effect of the input variables on the output response[4-7].
Most of the existing sensitivity analysis techniques applied in system reliability analysis mainly focus on single phase systems and a few literatures study the mission sensitivity analysis for phased mission systems (PMS)[8]. Compared with single-phase systems, PMS has the following characteristics: (1) component state is not independent among phases. The state of a component at the beginning of a phase depends on its state at the end of the previous phase, which most of the exiting sensitivity analysis techniques do not take into consideration; (2) component may have different reliability parameters in different phases, since different phases have different requirements for components logics. As a result, component sensitivity analysis techniques for single systems have difficulty in component sensitivity analysis of PMS. Xing and Dugan proposed a sensitivity analysis method for general PMS based on the Birnbaum’s measure which defined the component sensitivity as the partial derivative of the reliability with respect to the input parameter[8]. Birnbaum’s measure is a local method. Thus, if the component rated reliability values cannot be obtained, or component in different phases has different rated reliability level, it is no longer applicable. Sobol’ index is one of the popular variance-based methods which is mainly applied to nonlinear mathematical models or rather complex mathematical models[5-6]. It aims at decomposing the variance of the output as a sum of contributions of each input variable[4-5]. When applied to the component sensitivity analysis, the change in the mission reliability of the whole system can be decomposed as a sum of reliability change of each component. It considers the impact of the component reliability varying in its whole reliability degeneration range. In this way, we could estimate the component mission sensitivity to the whole mission reliability even when the reliability indexes of components cannot be evaluated. In this paper, the Sobol’s index is used to define the component global mission sensitivity (GMS) of PMS, and the mission reliability of PMS is obtained based on extended object-oriented Petri net (EOOPN) simulation method[9].
The following paper is organized as follows. Section 1 presents the Sobol’s index and the EOOPN model. Section 2 shows the definition of GMS based on Sobol’s index and its simulation strategy based on EOOPN and Monte Carlo method. Section 3 illustrates how to calculate GMS value of each component via an example PMS and compares GMS value with the traditional sensitivity index based on Birnbaum’s method. Finally, Section 4 discusses some main results.
1 Background
1.1 Analysis of Variance-representation
Consider a mathematical model withninput parameters and a scalar outputy:
y=f(x),x=(x1,x2, …,xn),x∈In
(1)
whereIis the unit interval [0, 1], andInis then-dimensional unit hypercube. The Sobol’s decomposition off(x)into summands of increasing dimension instant is:

(2)
wheref(x) is assumed to be continuous and the integral of each summandfi1i2…im(xi1,xi2, …,xim) is zero over any of its independent variables:

(3)
The termf0is a constant, and it is the mean value of the output.
(4)
Besides, the others members in Eq. (1) are orthogonal and can be expressed as:


(5)
Considerxis a random point uniformly distributed inIn, thenf(x) and other members exceptf0in Eq. (2) are also random variables, whose variances are:

(6)
1.2 Sobol’s index


The Sobol’s indices are usually calculated by Monte Carlo simulation. Consider two independent random pointsξandξ′ uniformly distributed inInand givenξ=(η,ζ),ξ′=(η′,ζ′). AfterNth trails, crude Monte Carlo estimates are obtained as follows:

(7)
1.3 EOOPN model
EOOPN model is generating for the mission reliability simulation and analysis of complex systems. It is defined as a 3-tuple: (SN,F,Ddr), whereSN={SNi,i=1, 2, …,n},SNis defined as a set of extended colored Petri nets (CPN), called subnet place. It is used to encapsulate the reliability behaviors of a sub-system, a phase or a component;Fis a set of arcs, via which subnets transfer messages.Ddris a set of logical transitions integrating the transition in traditional Petri net and logical gate in fault tree. The simulation of EOOPN is the movement or transfer of tokens among places in or between different subnets through the firing of transitions. Given the data and information of phase durations, phase failure logic and components failure and repair parameters, the system reliability can be obtained by computing the steady probability of the token in the corresponding place afterNth simulations.
2 Global Sensitivity Index of PMS and Its Simulation Strategy
2.1 Global sensitivity index of PMS based on Sobol’s index
Consider a PMS withHphases andncomponents, and letrj(h) be the reliability of componentjduring phaseh(1≤h≤H),rj(h)∈[0, 1];α(h) is the relative mission importance to the whole system mission of phaseh. All of the components are supposed to be non-repairable. Letf(h) be system structure function, andmibe the number of independent components working in phasehi. Then, we havef(h)=f(r1(h1),r2(h1), …,rm1(h),r1(h2),r2(h2), …,rmH(hH)). In this paper, the reliability level of the componentiis suggested to beri, andr1,r2,… are independent and identically distributed variables uniformly distributed in [0, 1]. The states of the same component during different phases are dependent. As a result, the number of the independent and identically distributed variables isn. Then the dimension off(h) was equal ton, and could be expressed asf(r1,r2, …,rn).
Based on the analysis of variance-representation and Sobol’s index, we have

(8)
The GMS for PMS of componentiis defined as

(9)

2.2 Simulation strategy
Based on the above hypothesizes,Nth simulation can be undertaken as follows.
Step 1: Build the EOOPN model for the PMS;

Step 3: Run the EOOPN model for 100 thousand times;


Step 6: repeat step 2 to step 5 forNtimes.
Then the GMS for componentmcan be obtained by

3 Case Study
To illustrate the effectiveness and wide applicability of the proposed method, this paper takes a space tracking, telemetry, and command (TT& C) system as an example which is generally regarded as a PMS to account for time sequence division and phase dependence.
There are four components in total. The system structure function in each phase is respectively:
φ(x1) =A·B,φ(x2)=A·(B+C),
φ(x3)=A·(C+D),φ(x4)=A·(B+D).
(10)
ComponentArepresents the center, and componentsB,C,andDare stations. In practice, the components are non-repairable during once mission. Along with increasing of data amount sending back from the aircrafts, the amount of work will rapidly go up, and failure rates of the continuous working stations and center will also increase. The phase duration time ist1=0.025 h,t2=0.042 h,t3=0.036 h,t4=0.050 h, and component reliability characteristics are given in Table 1. The EOOPN simulation method is then executed and results were obtained for the probability of phase and mission failure.
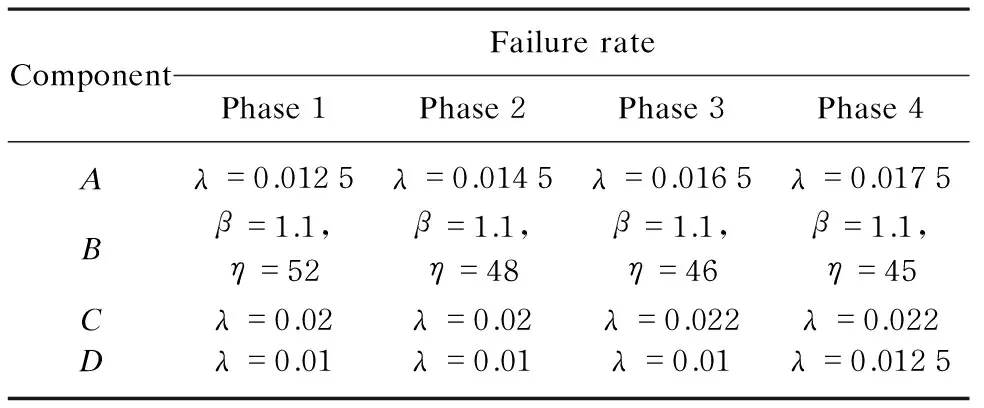
Table 1 Component reliability information
Assuming that all the phases’ weights are 0.25, the GMS simulation results according to the Sobol’s method are shown in Table 2. And the sensitivity of each component based on the Birnbaum’s sensitivity method is also shown in Table 2 as a comparison. In this paper, the Birnbaum’s sensitivity for each component is defined as its average Birnbaum’s sensitivity in each phase.

Table 2 Relative sensitivity index of each component
From Table 2, we can find that if we use Birnbaum’s method to evaluate component sensitivity, we will obtain the conclusion that both stationsCandDhave little influence on the whole system mission reliability. However, Birnbaum’s method assumes that the states of the same component in different phases are regarded as independent, the phases are of equal importance for the mission, and the rated value of each component reflects its actual reliability. In practice, the component state at the beginning of a phase depends on its previous state at the end of the previous phase and the rated value of each component could not always reflect its actual reliability for the nature environment is out of control. For example, during once mission, if the weather of where stationDlocated breaks, the reliability of stationDmay has a sharp downgrade. Assuming that the reliability of stationDduring phase 3 decreases to 0.5, the Birnbaum’s sensitivity of stationsCwill increase to 0.4997 which implies that the reliability of stationDhas a profound influence on the Birnbaum’s sensitivities of stationsC. Besides, because the station state is phase dependent, the reliability of stationDduring phase 4 is lower than 0.5 and the Birnbaum’s sensitivity of stationBis higher than 0.4995. In conclusion, the Birnbaum’s sensitivity is not applicable for component sensitivity analysis of PMS. The GMS is insensitive to the extreme cases for it is a global index and it takes the component states dependence into consideration.
Besides, the GMS can deal with component sensitivity analysis of PMS with common cause failure[10]. Assuming that the PMS contains one common cause groupG={B,C}, the propagated failure probability of each station in groupGat each phase isei(h) wherei=B,Candh=1, 2, 3, 4. Given that the propagated failure probability of stationBandCareeB(h)=1,eC(h)=0 for each phase. Similarly, assuming that all the phases’ weights are 0.25, the GMS simulation results according to the Sobol’s method are shown in Table 3.

Table 3 Relative sensitivity index of each component with common cause failure
Comparing Table 3 with Table 2, we can find that the relative GMS of stationBincreases as it can cause propagated failure. The relative GMS of stationCdecreases as it can not cause propagated failure. However, the Birnbaum’s indexes have no changes.
4 Conclusions
This paper defines the GMS index estimate the global component mission sensitivity of PMS which is important to find the key component limiting the reliability growth of PMS. Sobol’s index based on the analysis of variance methodology is used to define and evaluate GMS value of each component of PMS which is a global parameter considering the component reliability falling within a wide range.
A major advantage of this approach is that, if the rated value of the component rated reliability parameters cannot be obtained, the GMS value of each component also can be estimated. And GMS also can be used to analyze component sensitivity when the systems have components state dependency, complicated phase relationship or subjected to common cause failure.
[1] Birnbaum Z W. On the Sensitivity of Different Components in a Multi-components System [M]. San Diego: Academic, 1969: 581-592.
[2] Saltelli A, Marivoet J. Non-parametric Statistics in Sensitivity Analysis for Model Output: A Comparison of Selected Techniques [J].ReliabilityEngineeringandSystemSafety, 1990, 28(2): 229-253.
[3] Castillo E, Minguez R, Castillo C. Sensitivity Analysis in Optimization and Reliability Problems [J].ReliabilityEngineering&SystemSafety, 2008, 93(12): 1788-1800.
[4] Sobol’ I M. Sensitivity Analysis for Non-linear Mathematical Models [J].MathematicsandComputersinSimulation, 1993, 1: 407-414. (in Russian)
[5] Sobol’ I M. Global Sensitivity Indices for Nonlinear Mathematical Models and Their Monte Carlo Estimates [J].MathematicsandComputersinSimulation, 2001, 55(1/2/3): 271-280.
[6] Wei P F, Lu Z Z, Song J W. A New Variance-Based Global Sensitivity Analysis Technique [J].ComputerPhysicsCommunications, 2013, 184(1): 2540-2551.
[7] Mara T A, Tarantola S. Variance-Based Sensitivity Indices for Models with Dependent Inputs [J].ReliabilityEngineering&SystemSafety, 2012, 107: 115-121.
[8] Xing L, Dugan J B. Analysis of Generalized Phased-Mission Systems Reliability, Performance and Sensitivity [J].IEEETransactionsonReliability, 2002, 51(2): 199-211.
[9] Mitra S, Saxena N R, McCluskey E J. Common-Mode Failures in Redundant VLSI Systems: a Survey [J].IEEETransactionsonReliability, 2000, 49(3): 285-295.
[10] Wu X Y, Wu X Y. Extended Object-Oriented Petri Net Model for Mission Reliability Analysis of Complex System [J].JournalofAcademyofEquipment, 2013, 24(2): 66-69. (in Chinese)
Foundation item: National Natural Science Foundation of China (No.71071159)
1672-5220(2014)06-0809-03
Received date: 2014-08-08
*Correspondence should be addressed to WU Xin-yang, E-mail: wuxinyang525@126.com
CLC number: TP302 Document code: A
杂志排行

Journal of Donghua University(English Edition)的其它文章
- Optimization of Quality Consistency Problem of Electromechanical Component due to Manufacturing Uncertainties with a Novel Tolerance Design Method
- Effect of Starch Dodecenylsuccinylation on the Adhesion and Film Properties of Dodecenylsuccinylated Starch for Polyester Warp Sizing
- Interval Fault Tree Analysis of Excavator Variable-Frequency Speed Control System
- Combinatorial Optimization Based Analog Circuit Fault Diagnosis with Back Propagation Neural Network
- Reliability Allocation of Large Mining Excavator Electrical System Based on the Entropy Method with Failure and Maintenance Data
- Deployment Reliability Test and Assessment for Landing Gear of Chang’E-3 Probe