Channel Error Compensation for Multi-channel SAR Based on Cost Function
2014-08-05ZhangLeiDengYunkaiWangYuZhengShichaoYangLiangInstituteofElectronicsChineseAcademyofSciencesBeijing100190ChinaUniversityofChineseAcademyofSciencesBeijing100049China
Zhang Lei Deng Yun-kai Wang Yu Zheng Shi-chao Yang Liang(Institute of Electronics, Chinese Academy of Sciences, Beijing 100190, China)(University of Chinese Academy of Sciences, Beijing 100049, China)
Channel Error Compensation for Multi-channel SAR Based on Cost Function
Zhang Lei*①②Deng Yun-kai①Wang Yu①Zheng Shi-chao①②Yang Liang①②①(Institute of Electronics, Chinese Academy of Sciences, Beijing 100190, China)②(University of Chinese Academy of Sciences, Beijing 100049, China)
Multi-channel in azimuth is a technique to achieve high-resolution as well as wide-swath in Synthetic Aperture Radar (SAR) systems. Channel error is inevitable in multi-channel systems and it induces blurring in subsequent SAR imagery. Existing compensation approaches are sensitive to system parameters as well as the imaging scenes. Uncertainty of the parameters impacts the validation of these algorithms. In this paper, an improved approach is presented to remove the channel error. Based on the error form, this approach models channel error as three parts: the range gain error, the pulse sampling clock error, and the transmission phase error. The range gain error and the pulse sampling clock error are removed alternately. Then the proposed approach uses cost function to estimate the transmission phase error so that it is independent from the imaging scene. Point target simulations are carried out to investigate the performance, and real data comparison experiments are carried out to verify this approach.
Synthetic Aperture Radar (SAR); Multi-channel; Channel error compensation
CLC index: TN957.52
1 Introduction
Synthetic Aperture Radar (SAR) is a widely used remote sensing instrument. High-resolution as well as wide-swath is one of the main goals of system design[1,2]. For conventional spaceborne SAR, high resolution in azimuth requires large Doppler bandwidth, which means a high Pulse Repetition Frequency (PRF) to avoid ambiguity. However, wide imaging swath requires wide range beam, hence PRF must be low to guarantee the echo integrality. This contradiction is known as the minimum-antenna-area constraint[3].
Multi-channel technique was proposed to break through this constraint. Multi-channel can be realized either in the range direction[4]or in the azimuth direction, even in both directions[5,6]. Besides, channels can be placed either on single platform or distribute platforms[7,8]. Multi-channel in azimuth on single platform has been tested withTerraSAR-X, and the outcomes are encouraging[9]. Due to the effects of the qualities of modules, the construction of the system and the atmosphere, channel imbalance is inevitable in multi-channel system. Channel imbalance presents in echo data in terms of amplitude error and phase error. These errors impair the reconstruction of azimuth signals thus the final SAR image will be ambiguous[10].
Several algorithms have been proposed to remove channel errors. They can be classified as two categories: methods based on inner calibration and methods based on raw data. Inner calibration[11]uses calibration subsystem to get imbalance information. This method works precisely, but it can not monitor the imbalance outside system loop such as antennas. Methods based on raw data can overcome this limitation. In this method[12], signal covariance is formulated and then be decomposed by eigenvalues and the corresponding eigenvectors. The phase error between channels is derived in signal subspace. Method introduced by Ref. [13]works in a different way that it divides channel imbalance into pulse sampling clock error and channel phase error. It uses azimuth crosscorrelation to estimate these errors. Usually, methods based on raw data are sensitive to the imaging scene. Strong targets are likely to destroy the signal correlation and the validations of these algorithms are impacted.
In this paper, an improved method to handle channel imbalance is proposed. The method models channel imbalance as three parts: the range gain error, the pulse sampling clock error, and the transmission phase error. The range gain error is removed alternately with the pulse sampling clock error. The estimation of transmission phase error is improved using cost function. Compared with existing methods, the proposed one is independent on the imaging scene, so it is more robust.
2 Signal and Error Model
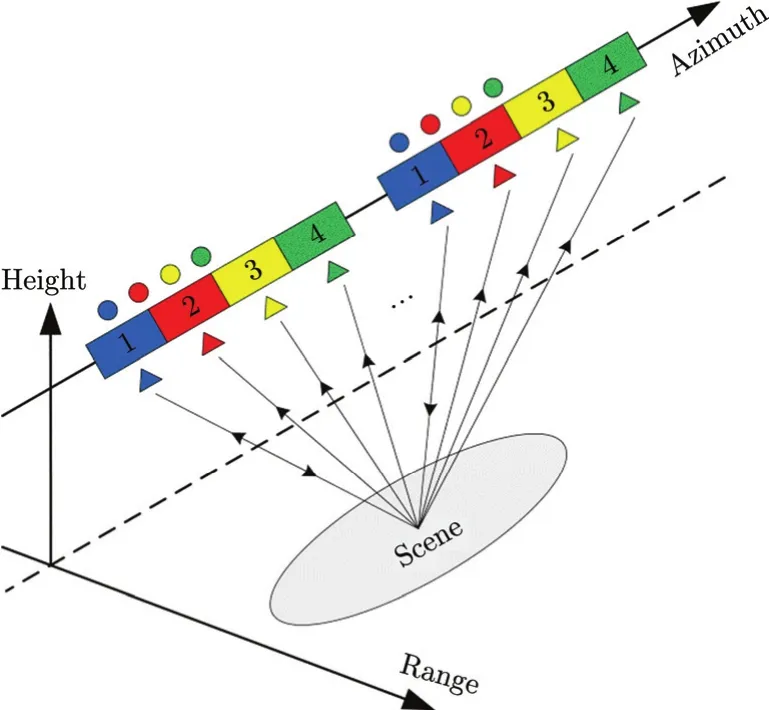
Fig. 1 System geometry of azimuth multi-channel SAR
Fig.1 shows the geometry of a SAR system with four channels in azimuth. Antennas of each channel and the corresponding phase-centers are marked with rectangles and triangles respectively. Suppose that channel 1 transmits signal and all four channels receive echo signal. By compensating a known constant phase between channels, the received echo signal can be converted into the equivalent self-transmit and self-receive signal[14]. The equivalent phase-centers are marked with circles, which are located halfway in between the transmitting (channel 1) and the respective receiving phase-center.
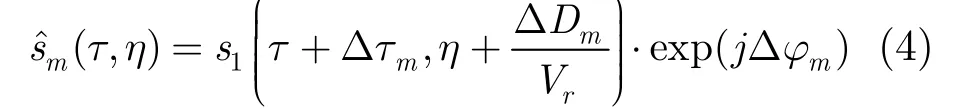
The echo signal received by channel 1 is denoted by s1(τ, η), where τ is the fast time and η is the slow time. According to the slow time delay, the echo signal received by channel m can be written as
where m is the channel number ranging from 2 to M (M is the total channels), ΔDmis the distance from the equivalent phase-center of channel m to that of channel 1, Vris the platform velocity.
For a spaceborne SAR system, its antenna radiation characteristic is measured in laboratory before launched. However, such characteristic usually changes in orbit because of antenna unfold error, satellite shake, modules invalidation and so on. So the gains of each channel are different. Antenna gain is a parameter of two dimensions, and this paper only focuses on range direction.
Because of the mis-synchronizing of the sampling clock, channels start to receive signal at different time. This leads to echoes from different range aligned in data. So it is needed to shift the pulse and align the data according to the range.
The inconsistency of receiver characteristic of channels brings a constant gain error and a constant phase error.
Based on the three sources discussed above, the channel errors are modeled as three parts: the range gain error, the pulse sampling clock error, and the transmission phase error. Thus the actual echo signal is formulated as

where δ am(τ) is the range gain error composed of the antenna gain error in range and the receiver gain error, Δτmis the pulse sampling clock error, Δ ϕmis the transmission phase error i.e. the receiver phase error. These errors induce blurring in subsequent SAR imaging, so that the images are ambiguous in the azimuth.
3 Error Compensation
3.1 Range gain error and pulse sampling clock error
For range gain error, we have

Because Δτmis also needed to be estimated, we use s1(τ+Δτm,η) instead. After δ am(τ) is removed, we get
Transform Eq. (4) into range frequency domain and performing azimuth cross-correlation[13], the phase is formulated

where fdcis the Doppler center frequency. Fitting the phase to a straight line, we can obtain Δτmfrom the slope.
The compensation of δ am(τ) as well as Δτmneeds to be done alternately with two reasons. First, by multiplying a linear phase with(fτ,η), Δτmis removed. According to the property of Fourier transform, the echo data are shifted in range time domain. This will bring a new range gain difference. Second, we use s1(τ, η) instead of s1(τ+δτm,η) when estimating δ am(τ).Alternation is terminated when the variety of Δτmestimated is below certain threshold (e.g. corresponding propagation phase is smaller than π/100).
The validation of Eq. (5) is related to the imaging scene. The relationship between the azimuth antenna pattern and the signal azimuth power spectrum is likely to be destroyed when several strong targets exist. Then, Δϕmestimated using Eq. (5) is not precisely enough.
3.2 Transmission phase error
After several alternations, the remaining part is the transmission phase error between channels i.e. Δϕm. We solve this problem resorting to the cost function-an effective way of SAR image autofocus[15]. For airborne SAR system, phase error in azimuth is unavoidable due to motion errors, unknown atmosphere effect and so on. This phase error causes defocusing in SAR image. The aim of autofocus is to estimate such phase error and refocus the image. One kind of autofocus technique is using the cost function. Cost function is derived from SAR images and used to justify whether an image is completely focused because its value relates to the extent of an image into focus. The transmission phase error Δϕmis constant in range, so its estimation can be treated as a special case of autofocus.
Blurred images caused by transmission phase error have two main characteristics. On one hand, the main lobe of the point target becomes wide. On the other hand, ambiguous images contain several ghosts in azimuth. Although defocused, these ghosts share the same shape with the actual targets. According to these two characteristics, we develop a new cost function called Image Self-Correlation in Azimuth (ISCA)

where I(m, n) is a SAR image, m and n are range coordinate and azimuth coordinate respectively, k is azimuth offset,*denotes conjugation, Emimplies average in range. ISCA is normalized by the denominator. Thus, we have

Ambiguous is exhibited by ISCA in two main ways. First, a wider main lobe means the ISCA of a focused image descends faster around k=0 (zero peak) than that of a defocused one, i.e. the zero peak is sharper. Second, the curve of selfcorrelation may have a couple of peaks besides the one at k=0 (non-zero peak). When the image is fully focused, these non-zero peaks become flat i.e. the ghosts are suppressed.
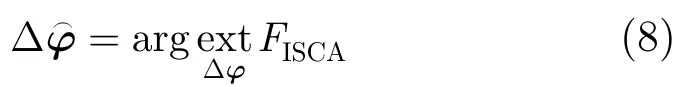
Thus, the estimation of transmission phase error can be described as
3.3 Iteration and the imaging algorithm
As the optimization in Eq. (8) has no closedform solution, we resort to an iterative method called coordinate descent algorithm[16]that Δϕmis obtained in sequence with iterations.
Suppose Δϕ represents a vector with dimension M-1. The optimization procedure is to find the most appropriate vector in (M -1)-dimensional space. In coordinate descent optimization, each parameter (coordinator) is optimized sequentially, while holding all other parameters constant. Let δ denote the m-th coordinate (the transmission phase error of the mth channel) of the i-th iteration. At the next iteration i+1, the coordinate descent estimated is

where m ranges from 2 to M. Note that parameters Δ ϕ2,…,Δ ϕm-1have already been updated whereas parameters δ ϕm+1,… , Δ ϕMare waiting for the updating. Because the parameters are interdependent, optimization over the entire set of parameters must be performed a number of times. The coordinate descent algorithm has the possibility to get local optimum. Changing the parameters optimization order can solve this problem. That is at the i-th iteration, optimize from Δϕ2to ΔϕM, and at the (i+1)-th iteration, from ΔϕMto Δϕ2.
It is interesting that different imaging algorithms correspond to distinct iterative processes.
If frequency domain imaging algorithms such as the Chirp Scaling Algorithm (CSA) are chosen, the iterative process is shown in Fig. 2(a). Because the imaging process is involved, the time consumption of the total iteration will be quite large especially when the number of channels is large. At the expense of time, we get channel error removed accurately and robustly.

Fig. 2 Flow chart of the compensation
The conditions will turn better when Back-Projection imaging Algorithm (BPA) is used. BPA is a flexible algorithm, it can be used in almost all SAR working modes. If BPA is adopted, the iterative process is given by Fig. 2(b), where only multi-channel accumulation is involved in iteration. Thus the iteration requires few time. After each single channel is imaged, we can select some range bins with highest contrast as sample set to be used in the estimation. This will speed up the iteration further.
4 Simulation and Real Data Experiment
4.1 Simulation experiment
To analyze the performance of the proposed method, we first use Monte Carlo simulation with point target echo. The system has five channels in azimuth with parameters set as shown in Tab. 1. For the pulse sampling clock error estimation, the error interval is set to be [-0.5ΔT, 0.5ΔT]with uniform distribution, where ΔT is the range sampling interval unit. For the transmission phase error estimation, the error interval is set to be [-0.5π, 0.5π]with uniform distribution. The system SNR is set from 10 dB to 30 dB with step of 2 dB. For each SNR, the simulation is carried out 100 times.
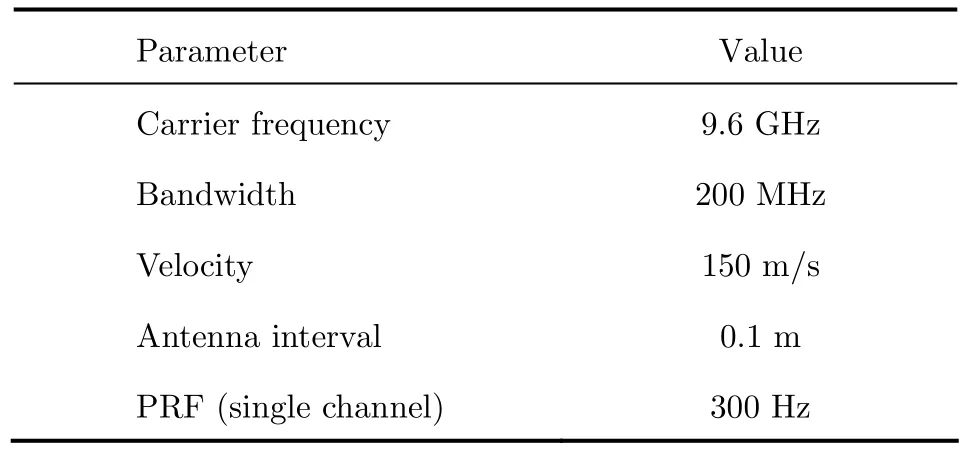
Tab. 1 System parameters point target echo
The simulation results are given by Fig. 3, the Averaged Root-Mean-Square Error (ARMSE) is defined by

where M is the total channels, N is the simulation times, ε is the error set, ˆε is the error estimated, and subscript m and n indicate the channel and the sample respectively. From Fig. 3, it is shown that the ARMSE of pulse sampling clock error estimated is dependent on system SNR. This is because Eq. (5) is derived with cross-correlation. While for the transmission phase error estimation, our method is independent on system SNR. This is another superiority compared with other algorithms.
4.2 Real data experiment
In this Section, we use some sets of airborne data to evaluate the proposed method. For comparison, the data are also processed with the method in Ref. [13]. The test data are collected by an airborne SAR system, which is an experimental platform of a future spaceborrne SAR system. There are two channels in azimuth working in strip-map mode. The SAR system is multi-carrier and the main parameters are listed in Tab. 2.

Tab. 2 System parameters of the airborne SAR

Fig. 3 Point target simulation results
Since the original data are oversampled in azimuth, we extract specific samples to simulate the undersampled signal as illustrated by Fig. 4. Channel 1 is ahead in time. We refer sample m to‘Sm’ and channel m to ‘CHm’ for short. The first sample of the new data set comes from S1CH1of the original data. The second sample comes from S2CH2of the original data. Then we jump across four samples, i.e. the third sample of the new data set comes from S7CH1of the original data and goes on. Thus the actual PRF is 250 Hz for C-band and 125 Hz for L-band. The experimental data set size is 16384 (range) by 16384 (azimuth) in sample.
Fig. 5 to Fig. 7 give the results of experiment executed on C-band data. Range gains of the two channels are drawn in Fig. 5(a). It shows that not only the gain but also the pattern are not identical. Fig. 5(b) shows the phase grads of channel crosscorrelation, that the linear variation is quite clear. Severe jitters at high frequency are caused by oversampling, i.e. the noise outside signal bandwidth.
A part of the final images are shown in Fig. 7. Fig. 7(a) is the image of the uncalibrated data. Ambiguity is so heavy that the factory can not be distinguished. Result of method in Ref. [13]is given by Fig. 7(b). Because the factory is stronger than the other targets, the ghosts still exist. Fig. 7(c) draws the image processed by the proposed approach. Ambiguity is greatly suppressed and we can recognize the factory on the left clearly.
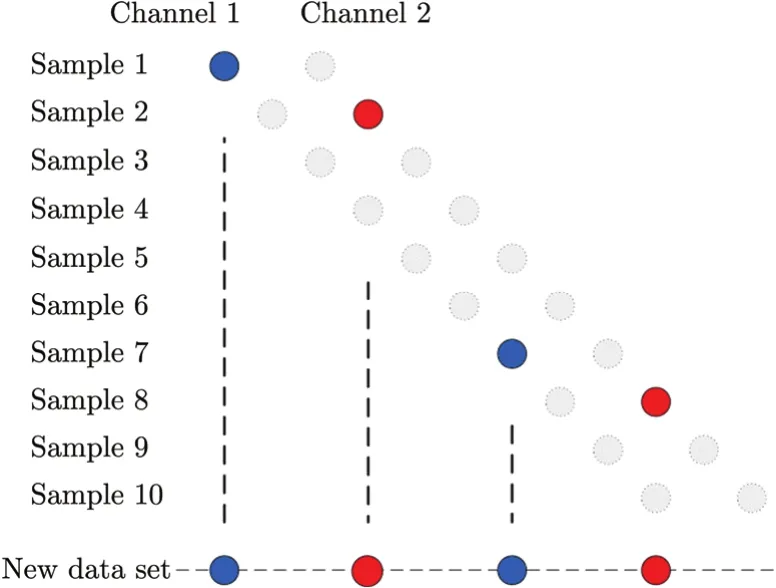
Fig. 4 Timing diagram of the new data set
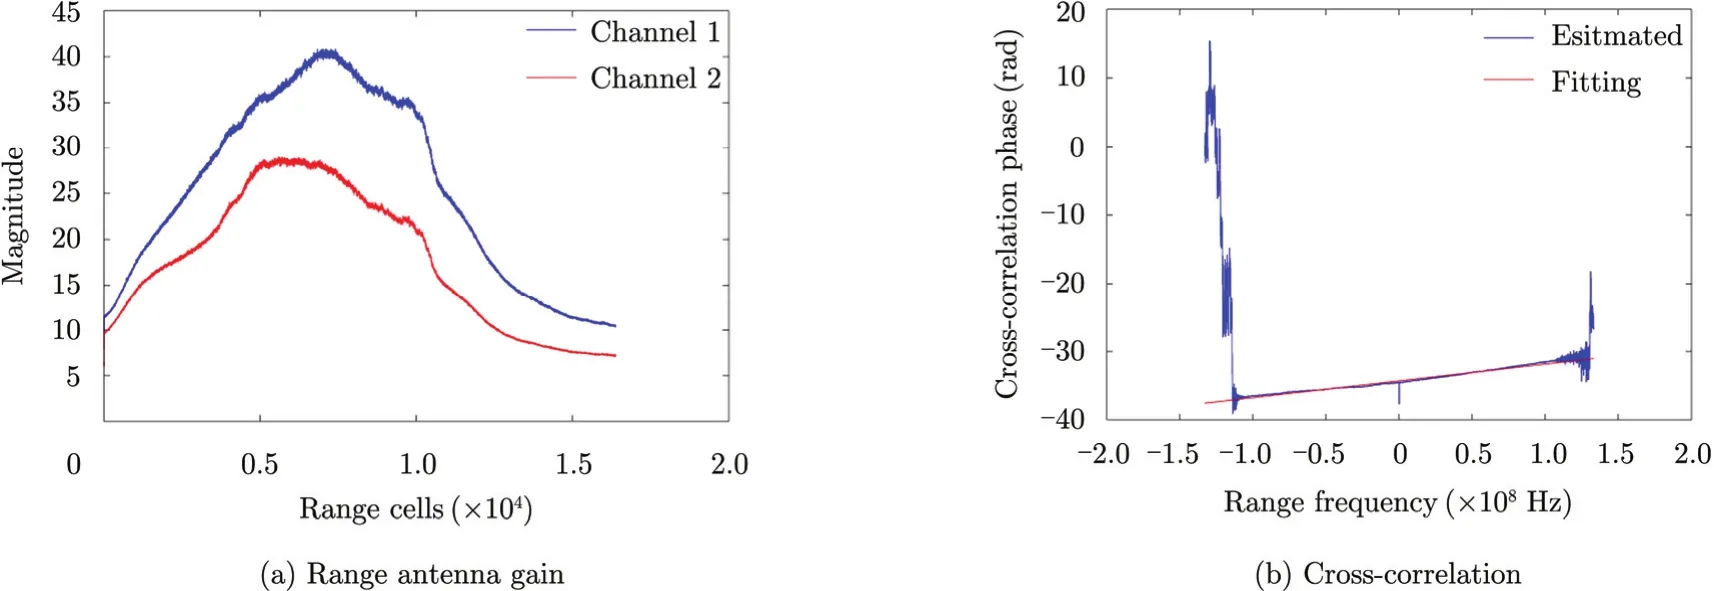
Fig. 5 Range gain error and pulse sampling clock error
Fig. 8 and Fig. 9 give the results of experiment executed on L-band data. Different from the C-band one, there is no obvious peak on the cost function curves. This is because of the scene content. The scene of C-band is mainly plowland so the factory as well as its ghost is prominent. While the one of L-band is mainly seaside city, that no particular human structure can be considered as prominent. As no peak is available, we use the mean value as the evaluation criterion, which is 0.487 before calibration and 0.262 after. Lower cross-correlation implies better focus.
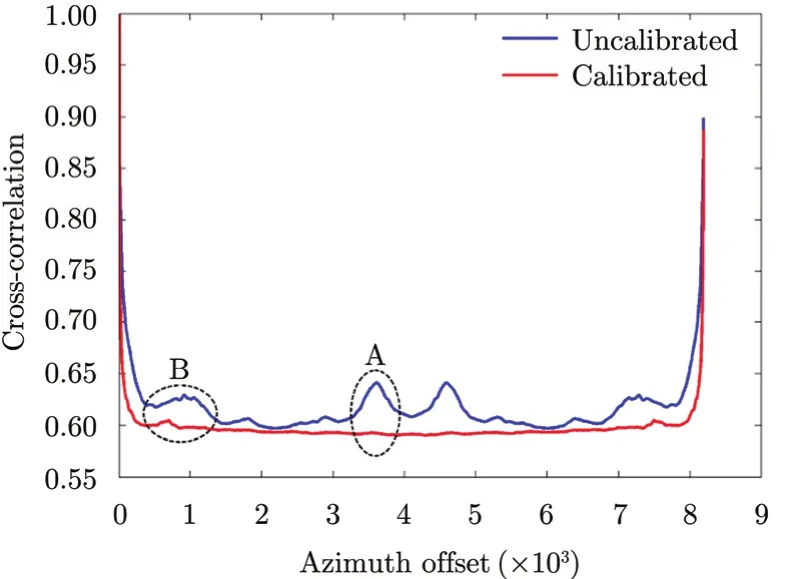
Fig. 6 The cost functions of C-band data
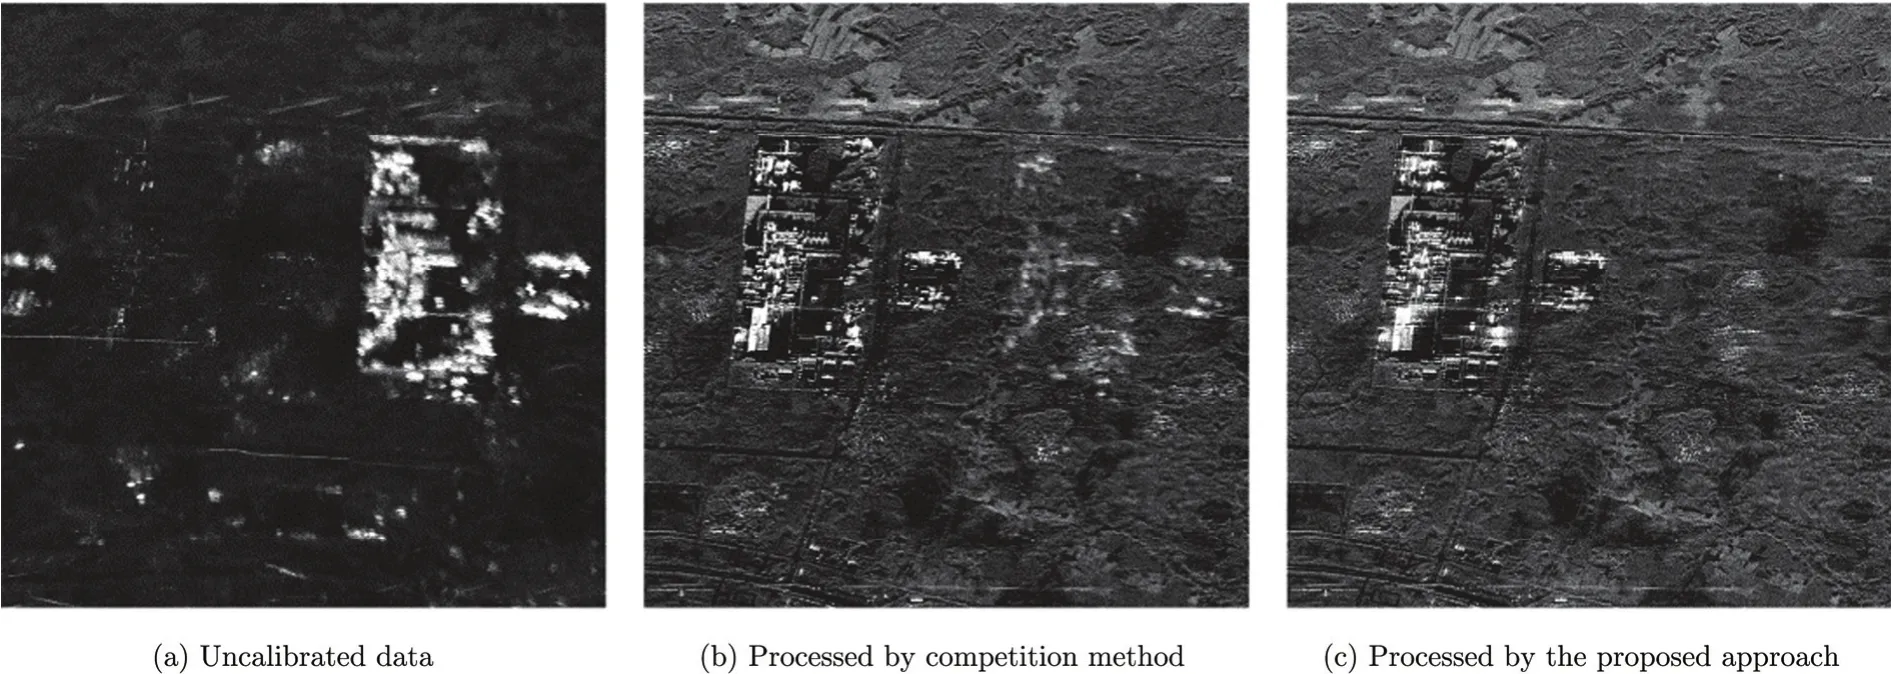
Fig. 7 Imaging results of C-band data
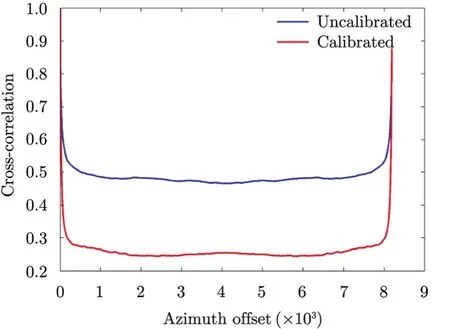
Fig. 8 The cost functions of L-band data

Fig. 9 Imaging results of L-band data
In the experiments above, the proposed method performs well and the improvement is shown obviously.
5 Conclusion
Channel imbalance is inevitable in multichannel system. In this paper, an improved approach for compensating channel imbalance in azimuth multi-channel SAR is proposed. The method calibrates not only the gain error but also the phase error. Point target simulations reveal the algorithm accuracy with different system SNR and shows that the proposed approach has high precision, and is less sensitive to the imaging scene as well as SNR. Real airborne SAR data are used to investigate the effectiveness, and the results show the validation of the approach at different wave bands. The proposed approach is proven to be working well. In the paper, only the range gain error is modeled. The algorithm considering azimuth antenna pattern error will be our future research focus.
[1] Currie A and Brown M A. Wide-swath SAR[J]. IEE Proceedings F: Radar and Signal Processing, 1992, 139(2): 122-135.
[2]邓云凯, 赵凤军, 王宇. 星载SAR技术的发展趋势及应用浅析[J]. 雷达学报, 2012, 1(1): 1-10.
Deng Yun-kai, Zhao Feng-jun, and Wang Yu. Brief analysis on the development and application of spaceborne SAR[J]. Journal of Radars, 2012, 1(1): 1-10.
[3] Curlander J C and McDonough R N. Synthetic Aperture Radar-Systems and Signal Processing[M]. New York: John Wiley & Sons, 1991.
[4]冯帆, 党红杏, 谭小敏. 基于Capon谱估计的星载SAR自适应DBF研究[J]. 雷达学报, 2014, 3(1): 53-60
Feng Fan, Dang Hong-xing, and Tan Xiao-min. Study on adaptive digital beamforming for spaceborne SAR based on Capon spatial spectrum estimation[J]. Journal of Radars, 2014, 3(1): 53-60.
[5]Malliot H. Wide swath SAR and radar altimeter[C]. IEEE Geoscience and Remote Sensing Symposium, Espoo, Finland, 1991: 87-97.
[6] Callaghan G D and Longstaff I D. Wide-swath space-borne SAR using a quad-element array[J]. IEE Proceedings-Radar, Sonar and Navigation, 1999, 146(3): 159-165.
[7] Goodman N A, Lin S C, Rajakrishna D, et al.. Processing of multiple-receiver spaceborne arrays for wide-area SAR[J]. IEEE Transactions on Geoscience and Remote Sensing, 2002, 40(4): 841-852.
[8]Martin M, Klupar P, Kilberg S, et al.. Techsat21 and revolutionizing spaee missions using microsatellites[C]. In 15th AIAA Conference on Small Satellites, UT, USA, 2001: 1-5.
[9] Kim J H, Younis M, Prats-Iraola P, et al.. First spaceborne demonstration of digital beamforming for azimuth ambiguity suppression[J]. IEEE Transactions on Geoscience and Remote Sensing, 2013, 51(1): 579-590.
[10]Jing W, Xing M, Qiu C W, et al.. Unambiguous reconstruction and high-resolution imaging for multiplechannel SAR and airborne experiment results[J]. IEEE Geoscience and Remote Sensing Letters, 2009, 6(1): 102-106.
[11]Renyuan C, Kai J, Yanmei Y, et al.. High resolution dual channel receiving SAR compensation technique[C]. 1st Asian and Pacific Conference on Synthetic Aperture Radar, Huangshan, China, 2007: 713-717.
[12]Yang T, Li Z, Liu Y, et al.. Channel error estimation methods for multichannel SAR systems in azimuth[J]. IEEE Geoscience and Remote Sensing Letters, 2013, 10(3): 548-552.
[13]Feng J, Gao C, Zhang Y, et al.. Phase mismatch calibration of the multi-channel SAR based on azimuth crosscorrelation[J]. IEEE Geosciences and Remote Sensing Letters, 2013, 10(4): 903-907.
[14]Krieger G, Gebert N, and Moreira A. Unambiguous SAR signal reconstruction from nonuniform displaced phase center sampling[J]. IEEE Geoscience and Remote Sensing Letters, 2004, 1(4): 260-264.
[15]Berizzi F and Corsini G. Autofocusing of inverse synthetic aperture radar images using contrast optimization[J]. IEEE Transactions on Aerospace and Electronic Systems, 1996, 32(3): 1185-1191.
[16]Kragh T J. Monotonic iterative algorithm for minimumentropy autofocus[C]. In Proceedings Adaptive Sensor Array Process (ASAP) Workshop, Lexington, MA, USA, 2006.

Zhang Lei was born in Jilin, China in 1985. He received her Ph.D. degree from the Institute of Electronics, Chinese Academy of Sciences in 2014. He is currently an assistant research fellow with the Institute of Electronics, Chinese Academy of Sciences. His research interests are signal process of high resolution SAR.
E-mail: 314forever@163.com

Deng Yun-kai was born in 1962. Professor, Ph.D. supervisor, major research in spaceborne SAR design.
E-mail: ykdeng@mail.ie.ac.cn

Robert Wang was born in 1980. He is now a Research Fellow and Ph.D. supervisor of Institute of Electronics, Chinese Academy of Science, he is a Senior Member of IEEE. His main research interest is Bistotic SAR (BiSAR) and signal processing of FMCW SAR.
E-mail: yuwang@mail.ie.ac.cn
Zheng Shi-chao was born in Rizhao, China in 1986, Ph.D. candidate, major research in signal process of wide area monitoring radar.
E-mail: jerryiszsc@163.com

Yang Liang was born in Yantai, China in 1984, Ph.D. candidate, major research in SAR raw data simulation.
E-mail: yangliang_mail@163.com
基于代价函数的通道误差校正方法
张 磊①②邓云凯①王 宇①郑世超①②杨 亮①②①(中国科学院电子学研究所 北京 100190)②(中国科学院大学 北京 100049)
方位多通道技术是合成孔径雷达(SAR)实现高分宽测的手段之一。在多通道系统中通道失配是不可避免的,这会导致SAR图像模糊。已有的通道失配校正方法大多依赖于系统参数以及场景内容。参数的不确定性将会大大降低校正算法的稳定性。该文提出了一种改进的通道失配校正方法,根据失配产生的原因,将通道失配分为距离增益误差、脉冲采样时钟误差和传输相位误差3项。前两项误差通过交替估计进行补偿,而传输相位误差则通过代价函数给予估计。该方法对成像场景的依赖较小,基于机载多通道验证平台实测数据的实验验证了该方法的有效性。
合成孔径雷达(SAR);多通道;通道误差校正
TN957.52
A
2095-283X(2014)05-0556-09
10.3724/SP.J.1300.2014.14052
Manuscript received March 19, 2014; revised July 8, 2014.
Published online September 12, 2014.
Supported by the National Natural Science Foundation of China (No. 61172122, 61422113).
*Corresponding author: Zhang Lei
E-mail: 314forever@163.com