Mixing Characteristics and Bubble Behavior in an Airlift Internal Loop Reactor with Low Aspect Ratio*
2014-07-18ZHANGWeipeng张伟鹏YONGYumei雍玉梅ZHANGGuangji张广积YANGChao杨超andMAOZaisha毛在砂KeyLaboratoryofGreenProcessandEngineeringNationalKeyLaboratoryofBiochemicalEngineeringInstituteofProcessEngineeringChineseAcademyofSciencesBeijing1001
ZHANG Weipeng (张伟鹏), YONG Yumei (雍玉梅), ZHANG Guangji (张广积), YANG Chao (杨超)** and MAO Zaisha (毛在砂)Key Laboratory of Green Process and Engineering, National Key Laboratory of Biochemical Engineering, Institute of Process Engineering, Chinese Academy of Sciences, Beijing 100190, China
Mixing Characteristics and Bubble Behavior in an Airlift Internal Loop Reactor with Low Aspect Ratio*
ZHANG Weipeng (张伟鹏), YONG Yumei (雍玉梅), ZHANG Guangji (张广积), YANG Chao (杨超)** and MAO Zaisha (毛在砂)
Key Laboratory of Green Process and Engineering, National Key Laboratory of Biochemical Engineering, Institute of Process Engineering, Chinese Academy of Sciences, Beijing 100190, China
The present study summarizes the results of macro- and micro-mixing characteristics in an airlift internal loop reactor with low aspect ratio (H/D≤5) using the electrolytic tracer response technique and the method of parallel competing reactions respectively. The micro-mixing has never been investigated in airlift loop reactors. The dual-tip electrical conductivity probe technique is used for measurement of local bubble behavior in the reactor. The effects of several operating parameters and geometric variables are investigated. It is found that the increase in superficial gas velocity corresponds to the increase in energy input, liquid circulation velocity and shear rate, decreasing the macro-mixing time and segregation index. Moreover, it is shown that top clearance and draft diameter affect flow resistance. However, the bubble redistribution with a screen mesh on the perforated plate distributor for macro-mixing is insignificant. The top region with a high energy dissipation rate is a suitable location for feeding reactants. The analysis of present experimental data provides a valuable insight into the interaction between gas and liquid phases for mixing and improves the understanding of intrinsic roles of hydrodynamics upon the reactor design and operating parameter selection.
airlift loop reactor, macro-mixing, micro-mixing, bubble behavior, hydrodynamics
1 INTRODUCTION
Airlift internal loop reactors with large ratio of height to diameter are commonly used in petrochemical [1], energy [2], and bio-engineering [3] processes due to their advantages of simple structure, high gas-liquid mass and heat transfer rates, good solid suspension, uniform shear distribution and especially good mixing. They have been adopted popularly in aerobic processes, but fewer can be found in anaerobic operations. With large scale alcohol fermentors without blending devices as example, problems of material charge and discharge, bacterial infection, large concentration gradient, and waste of effective reactor volume often take a fair part of effective fermentation time, wasting raw materials and reducing the yield of products [4]. For meeting the need of anaerobic engineering, application of loop reactors with low height-todiameter ratio has been taken into consideration. When applied to industrial processes, gas and liquid are mixed rapidly through relative short circulation path and shear strength becomes heavier compared to that in the loop reactor with large height-to-diameter ratio, lowering the concentration gradient along the flow direction in the entire reactor. Related researches on other applications such as leaching ores [5] and nitrifying treatment of wastewater [6] have also been reported. In practice, mixing is very important in chemical reaction engineering. Rao and Joshi [7] have pointed out that the knowledge of mixing is essential when the rate of mixing is comparable to or slower than that of chemical reaction or mass transfer. For the need of scale-up and operation optimization, the mixing mechanism in this kind of airlift reactors is necessary.
In spite of the demand in industries, mixing processes are far from being fully understood because of complex mechanisms prevailing in the reactors. The understanding of macro- and micro-mixing is urgently desired for the purpose of optimized operation and design of industrial loop reactors. For the optimum performance of reactors, considerable researches have been carried out to investigate the macro-mixing of loop reactors, relying on the knowledge related to hydrodynamics and design parameters such as flow pattern [8], gas input [9], liquid circulation [10], downcomer-to-riser cross-sectional area ratio [11], design of gas distributor [12] and gas-liquid separator [13], geometrical modifications [14, 15], volumetric mass transfer coefficient [16], residence time distribution [17], axial diffusion coefficient [18], turbulent diffusion coefficient [19], and Bodenstein number [20].
However, there remains wide scattering among the data and correlation predictions, which may be retrospectively attributed to insufficient understanding of the mixing in these systems. Gondo et al. [21] investigated the liquid mixing by large bubbles in a bubble column and found that the longitudinal dispersion coefficient of liquid phase depended on the column diameter, rather than the column height and mode of co- or counter-current contacts. Wilkinson et al. [22] pointed out that the influence of pressure on liquid mixing was opposite to that predicted by theoreticalequations in bubble columns. Hence, more phenomenological models and data are required for describing the mixing in a way that can relate it with the fundamental mechanisms of mixing in loop reactors. Meanwhile, most researches were focused on the study of the overall gas phase hydrodynamics in internal loop reactors with large height-to-diameter ratio, while fewer on those with low height-to-diameter ratio and even less focused on local mixing characteristics. The fundamental investigation and understanding of mixing based on local bubble behavior in loop reactors would be beneficial to optimization of operation, scale-up and design of high efficiency reactors and their applications.
Micro-mixing refers to essentially the ultimate mixing on the molecular scale. During the last decades, some work has been performed on developing experimental methods to characterize and intensify micro-mixing [23, 24], e.g., consecutive competing reactions [25], parallel competing reactions [26, 27] and other test reactions [28]. On the other hand, some micro-mixing models have been established, including the interaction by exchange with mean model, engulfment model, engulfment deformation diffusion model, multiple environment model, shrinking aggregate model, stochastic coalescence-redispersion model, and direct quadrature method of moments interaction by exchange with the mean model [29]. Numerous investigations of micromixing in a stirred reactor [30, 31] have been carried out utilizing these methods and models, with the impeller type and position, agitation speed, existence of baffle, feeding schedule and position of the limiting reactant taken into consideration. Besides, rotating packed bed [32], membrane reactor [33], tubular reactor [34], micro channel reactor [35], and impinging jet reactor [36] have been studied from a micro-mixing point of view. As far as our knowledge, the study on the micro-mixing in bubble columns and loop reactors has not been reported.
In this work, overall gas holdups in a gas-liquid loop reactor are measured using manometers, and macro-mixing time is determined by the tracer conductance response technique as conventionally adopted in many studies on airlift internal loop reactors. Although mixing and its impact on reaction have been studied by many researchers, the effect of local bubble behavior on mixing has received little attention. Thus the bubble behavior in the riser such as local gas holdup, bubble size and bubble rise velocity distribution are investigated by using a double-sensor conductivity probe. The effects of operation and structure parameters of the airlift loop reactor with low aspect ratio (H/D≤5) on gas-liquid two-phase flow and macro- and micro-mixing characteristics are investigated.

Table 1 Configuration and experimental parameters of the loop reactor
2 EXPERIMENTAL
2.1 Experimental setup
Measurements were made in an internal loop recirculation reactor, which consists of a gas-liquid sparger at the bottom, a main cylindrical vessel, and a concentric draft-tube. The geometric details of the reactor are shown in Table 1 and Fig. 1. Air and tap water are served as gas and liquid phases, respectively. The superficial gas velocity (based on the riser cross-section) varies from 0.01 m·s−1to 0.10 m·s−1, which is calculated as
All experiments were carried out with air and water at 25±1.0 °C. Hydrodynamic characteristics of gas phase were measured by using a dual-tip electrical conductivity probe. In order to ensure the sensitivity and accuracy, validation of the technique was conducted [37], with the maximum errors for gas holdup and bubble rise velocity less than 5%. The double-sensor electrical conductivity probe can be placed at any desired position so that gas holdup and bubble behavior can be determined at different axial and radial positions.
2.2 Measurement method
2.2.1 Determination of overall gas holdup
Gas holdup is related to the pressure drop in the loop reactor with the acceleration effects neglected. The pressure transducer setup is shown in Fig. 1, and points α and β represent two pressure transducers for the pressure inside the draft tube or in the annulus. The gas holdup in the riser εgris described by the recorded hydrostatic pressure as follows [38]:
where ΔPβαand ΔHrare the pressure difference and the vertical distance between two monitoring points respectively, and ρlis the density of liquid phase.
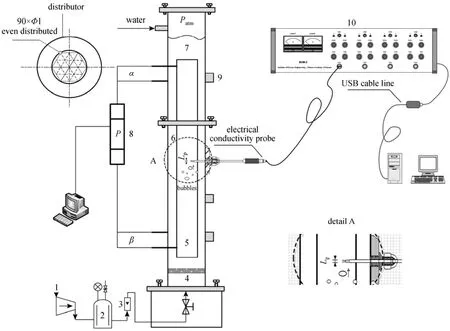
Figure 1 Schematic diagram of the loop reactor (not to scale) and conductance tracer response technique1—air compressor; 2—buffer tank; 3—gas mass flowmeter; 4—perforated distributor; 5—riser region; 6—downcomer region; 7—separator region; 8—pressure transducer; 9—electrical conductivity probe port; 10—BVW2 data acquisition system
The gas holdup in the downcomer can be obtained similarly. The cross-sectional mean gas holdup between points α and β in the reactor (εg) may be obtained from the measured εgrin the riser and εgdin the downcomer:
Here Arand Adare the cross-sectional areas of the riser and the downcomer, respectively.
2.2.2 Determination of local bubble behavior
The bubble characteristics were measured with a dual-tip electrical conductivity probe and data acquisition system (BVW2) developed by Institute of Process Engineering, Chinese Academy of Sciences. The measuring principle is based on different conductivities of liquid and gas phases, which correspond to different voltage signals as the probe contacts with different phases. The acquisition frequency is 20 kHz, which is high enough to capture the fastest bubbles. The dual electrical conductivity probe consists of two enamel-insulated wire tips of 0.20 mm in diameter. The tips are coated by epoxy resin and supported by a stainless steel tube of 4 mm in diameter. The distance between up-stream tip and down-stream tip, Lp, as shown in Fig. 1, is fixed at 2.0 mm for every probe. The dual-tip electrical conductivity probe can move flexibly for measurement at different axial and radial positions. In order to minimize its interference, the probe tips and their support are made as small as possible in contrast to the dimension of the reactor, and its obstruction to the flow can be neglected.
Local gas holdup is defined as the ratio of the residence time of the probe in gas phase to total measuring time as calculated by
For an effective bubble, the pair of signal patches must satisfy the following revised conditions initially proposed by Fan et al. [39]:
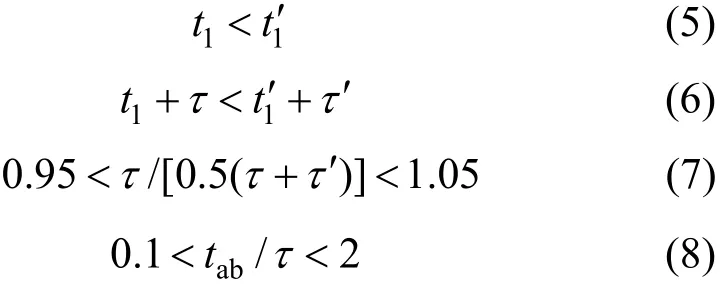
According to the criterion aforementioned, bubble rise velocity is obtained by

Then, the chord length of the bubble dican be calculated by

And the Sauter diameter is defined by the ratio of thethird to the second moment of the probability density function p(d), which depends on dmin, dmax, and the chord length distribution of bubbles:
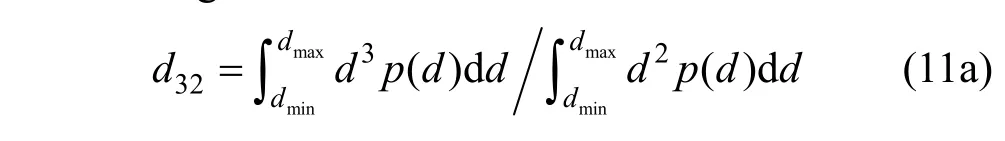
It relates to the area of the dispersed phase to its volume and hence to mass transfer rate. For any size distribution of discrete entities,
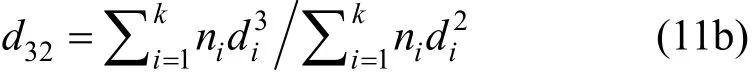
where niis the ith effective bubble taken into statistics, and other parameters,1t,1t′,2t,2t′, τ, τ′ andabt, are schematically shown in Fig. 2.
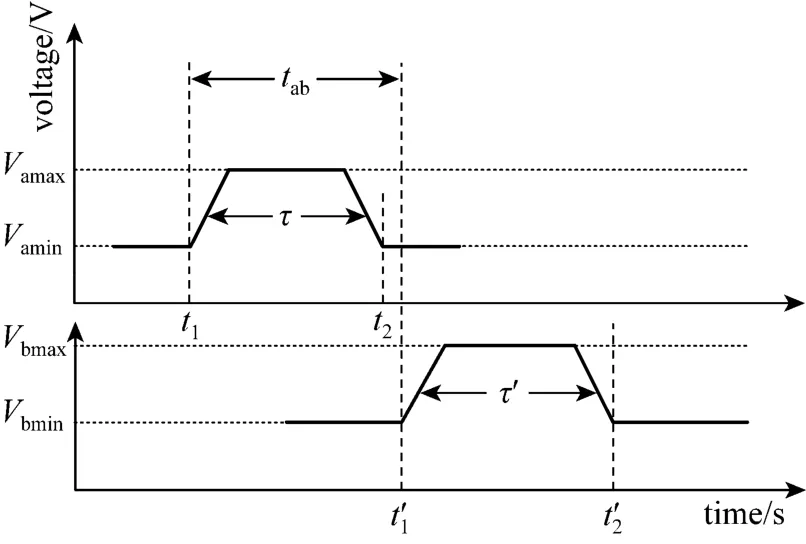
Figure 2 Schematic diagram of signals generated from up-stream and down-stream tips
2.2.3 Determination of macro miχing time
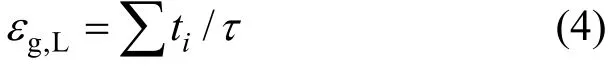
The conductivity response technique was used in this work for measurement of macro-mixing time (tm). The electrolyte solution with high concentration of tracer (250 g·L−1NaCl) was injected to the liquid surface near the wall as a pulse. A monitoring conductivity electrode was installed 0.06 m above the bottom at the opposite side wall for avoiding the short circuit of tracer-rich stream. As bubbles in the reactor would significantly affect the conductivity, the electrode was wrapped by non-metal gauze. The electric conductivity will fluctuate at the monitoring position until the electrolyte solution is uniformly dispersed throughout the reactor. The macro-mixing time is defined as the period of time necessary for a system to achieve the desired level of uniformity, expressed in terms of the degree of mixing:
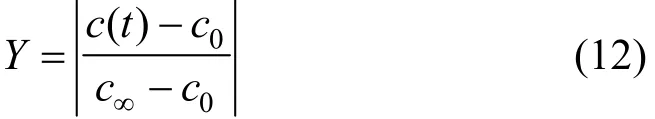
If Y remains henceforth in the range between 0.95 and 1.05, the mixing is considered complete and this period is taken as the macro-mixing time tm. Under each condition the experiment was repeated 6-10 times to get an average of tm.
2.2.4 Determination of segregation indeχ
In many industrial processes, many chemical reactions for desirable intermediates and end products are accompanied by side reactions producing undesirable by-products, decreasing reaction yield and complicate product separation. The simplest test system that quantifies this behavior consists of two parallel reactions with two reagents, B and C, being present in a homogeneous mixture and competing for another common reagent, A, to be fed into the reactor. Other species involved are the desired product R and the undesired product Q. A popular parallel competing test system proposed by Bourne and Yu [26] is the neutralization and alkaline hydrolysis of ethyl monochloroacetate:
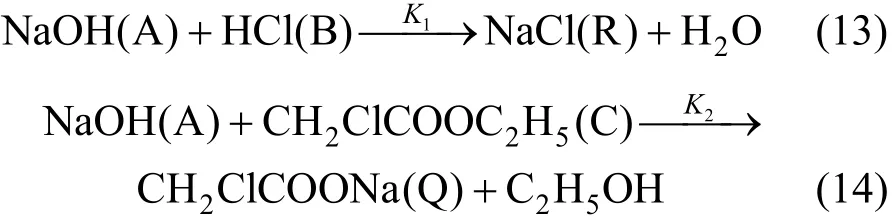
A weighted amount (0.05 m3) of hydrochloric acid (40 mol·m−3) and ethyl monochloroacetate (40 mol·m−3) were transferred into the reactor and mixed homogeneously with water inside by aerating with air for about 0.5 h before adding sodium hydroxide solution (2000 mol·m−3, 1000 ml) to test the micro-mixing. The segregation index XQis defined as the yield of Q relative to the amount of limited reagent A, i.e.,

The neutralization reaction is instantaneous relative to the mixing. If micro-mixing is efficient, A will be diluted immediately after its addition, and the slower reaction of hydrolysis will occur at very low rate.
In the present work, as in all micro-mixing studies referred here, a low value of the segregation index XQcorresponds to rapid mixing in fine scale and the greatest yield of the desired product. Further kinetic details of this system are available [26]. The product distributions were obtained by gas chromatography (GC) analysis of the residual ester and the formed ethanol.
3 RESULTS AND DISCUSSION
3.1 Flow regime and bubble behavior
Bubbles are distributed equally across whole riser volume for ug<0.06 m·s−1. The gas holdup in the riser increases linearly with ug. This corresponds to the homogeneous regime in Fig. 3. However, as ugincreases above 0.06 m·s−1, large bubbles form due to more frequent coalescence and aggregation. They move upward to the upper riser with higher rise velocities and shorter residence time, and increase the gas holdup slowly. Usually, the airlift loop reactor with high aspect ratio has a low critical velocity (0.03 m·s−1) for flow regime transition. For the airlift loop reactor with low aspect ratio, a wider range of homogenous regime is advantageous in benefit of higher circulation of liquid flow, intensified turbulence, shorter macro-mixing time and segregation index, and makes bubble distribution more uniform along axialand radial directions. Uniform bubby flow with gas superficial velocity of 0.01-0.06 m·s−1is adopted in the subsequent study.
Figures 4 and 5 show the radial profiles of gas holdups and the Sauter mean diameters in the riser, respectively, as a function of radial positions at various superficial gas velocities and axial heights. The local gas holdup and Sauter mean diameter increase with superficial gas velocity. At the bottom of the riser (h/D=0.86), the gas holdup in this region appears a little deviated core peaking distribution [Fig. 4 (a)] owing to the location of gas jet and original uniformly distributed bubble size [Fig. 5 (a)]. With the increase of axial distance from the distributor (h/D=1.94, 3.55), the static pressure in bubbles decreases. The breakage and coalescence of bubbles strengthen the interaction between bubbles and increase the bubble size. Based on the results of Tomiyama et al. [40], for the reason of shear-induced lift force, small bubbles incline to migrate toward the pipe wall and form a wall peaking distribution of gas holdup, while large bubbles tend to move to the central axis as they rise upward along the riser [Fig. 5 (b) to 5 (c)]. A corepeaking gas holdup distribution can be found in Fig. 4 (b) to 4 (c).
However, it should be noted that the phenomena appear a little different at the top of the riser (h/D=4.62), and the distribution of gas holdup becomes more flattened in Fig. 4 (d). Fig. 5 (d) indicates that at low superficial gas velocities, coalescence and ring vortex hardly occur at the top entrance of the downcomer. Small bubbles are still generated due to breakage near the riser wall, while at relatively high superficial gas velocities the Sauter mean diameter is more uniform in the whole top region. The same results can be convinced by the typical radial probability p(ub) histogram of the bubble rise velocity at h/D= 4.62 as shown in Fig. 6. However, the difference in values of central peak for each histogram appears unobvious due to the drastic and uniform turbulent energy in the top region.
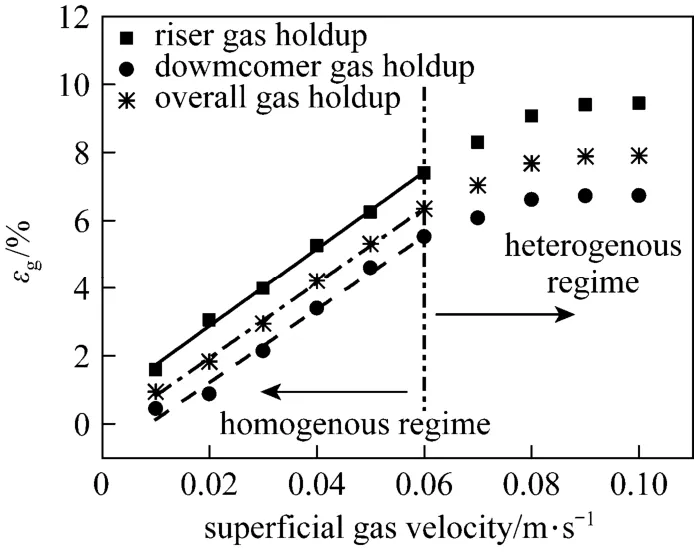
Figure 3 Gas holdup as a function of superficial gas velocity in a loop reactor (air-water, Hliquid=86 cm, Tc=0.10 m, Bc=0.06 m, Dr: Φ200×7 mm, unscreened perforated plate)
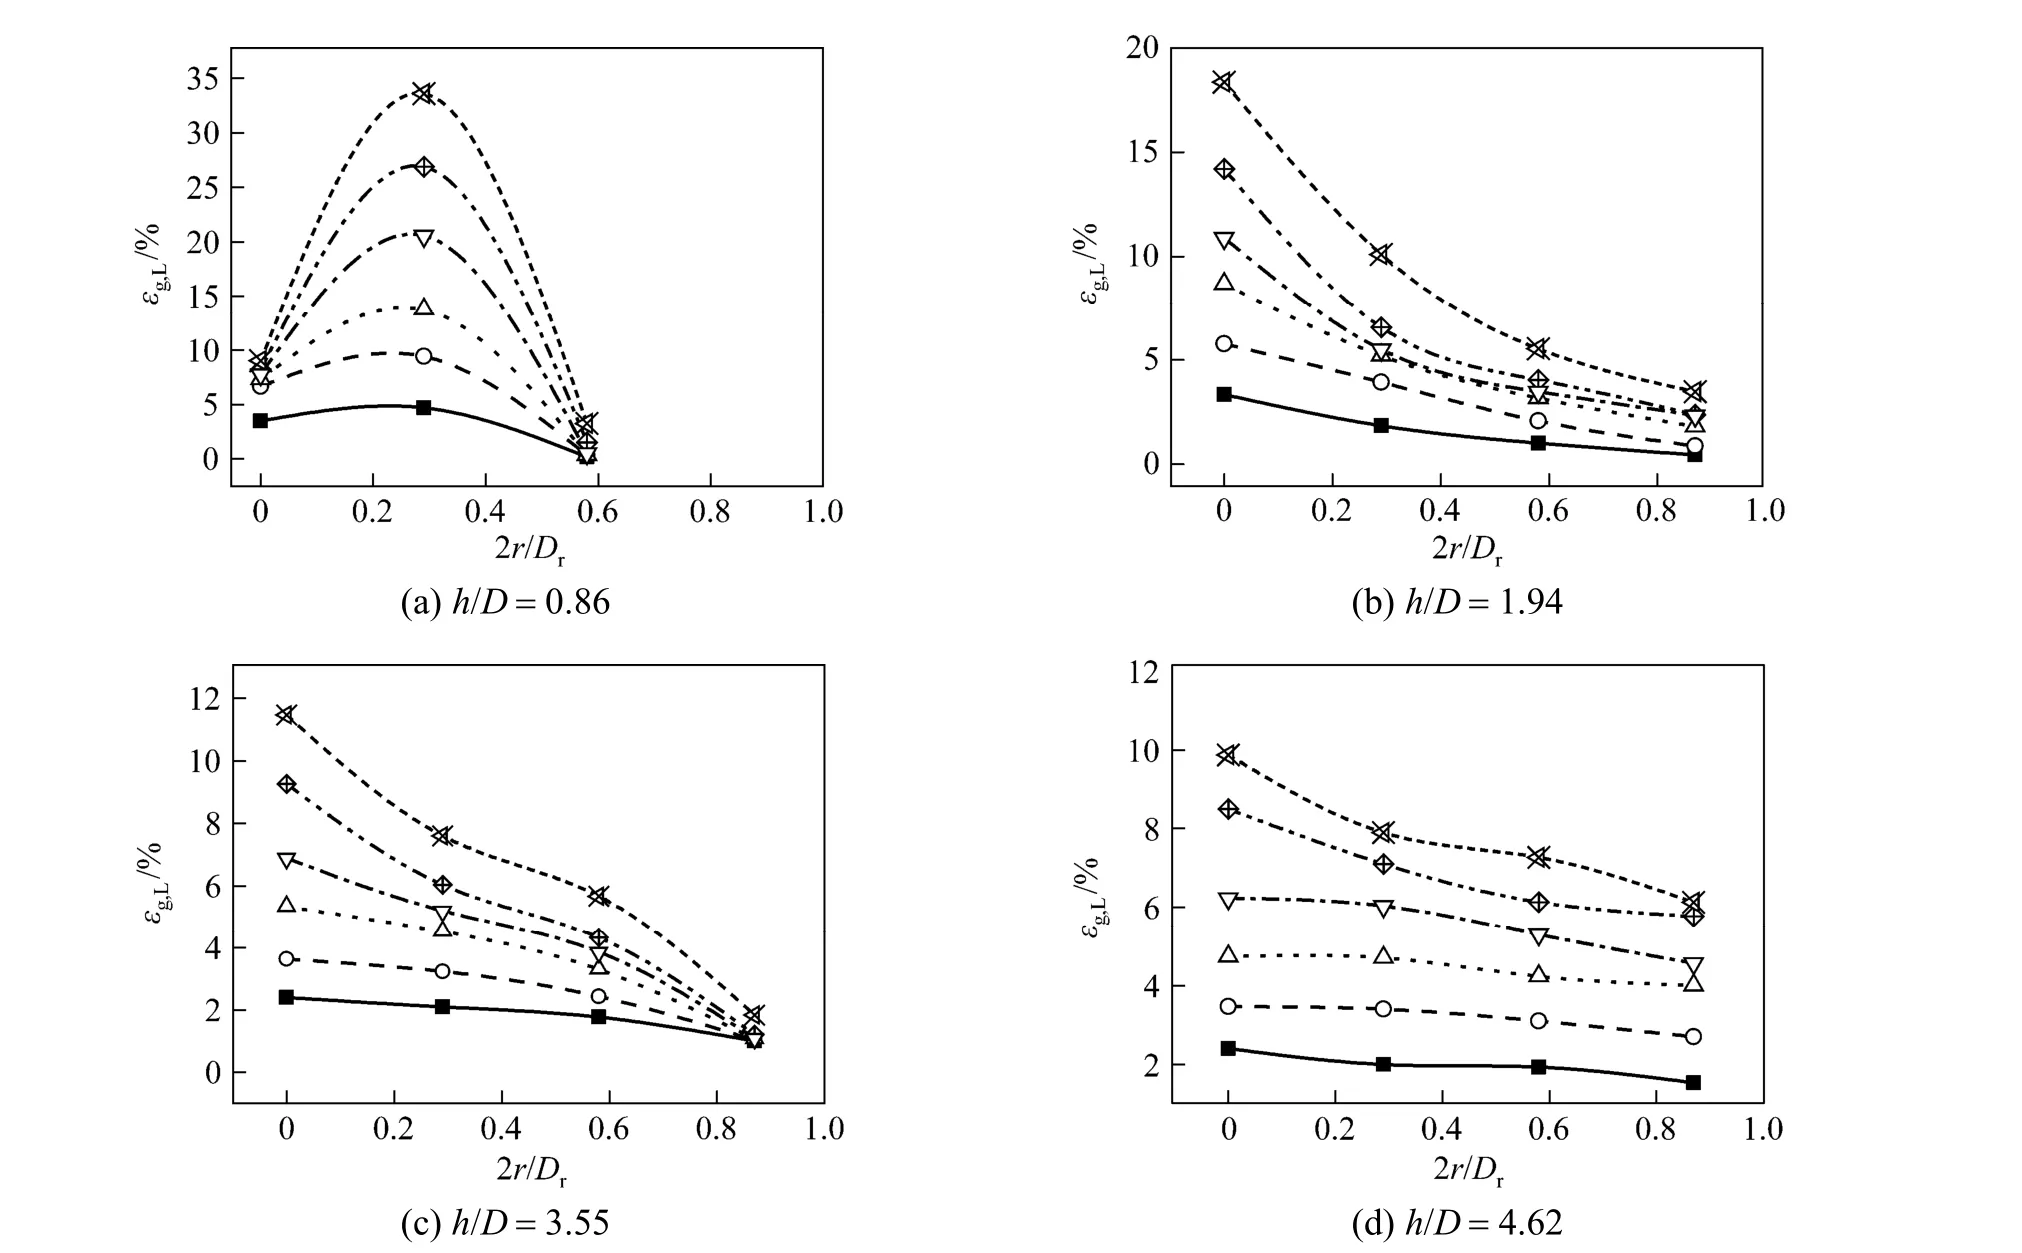
Figure 4 Radial profiles of local gas holdup in the riser (air-water, Hliquid = 86 cm, Tc = 0.10 m, Bc = 0.06 m, Dr: Φ200×7 mm, unscreened perforated plate)
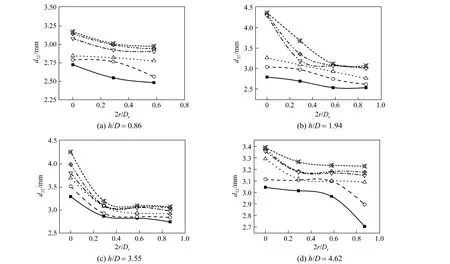
Figure 5 Radial profile of Sauter mean diameter in the riser (air-water, Hliquid=86 cm, Tc=0.10 m, Bc=0.06 m, Dr: Φ200×7 mm, unscreened perforated plate)
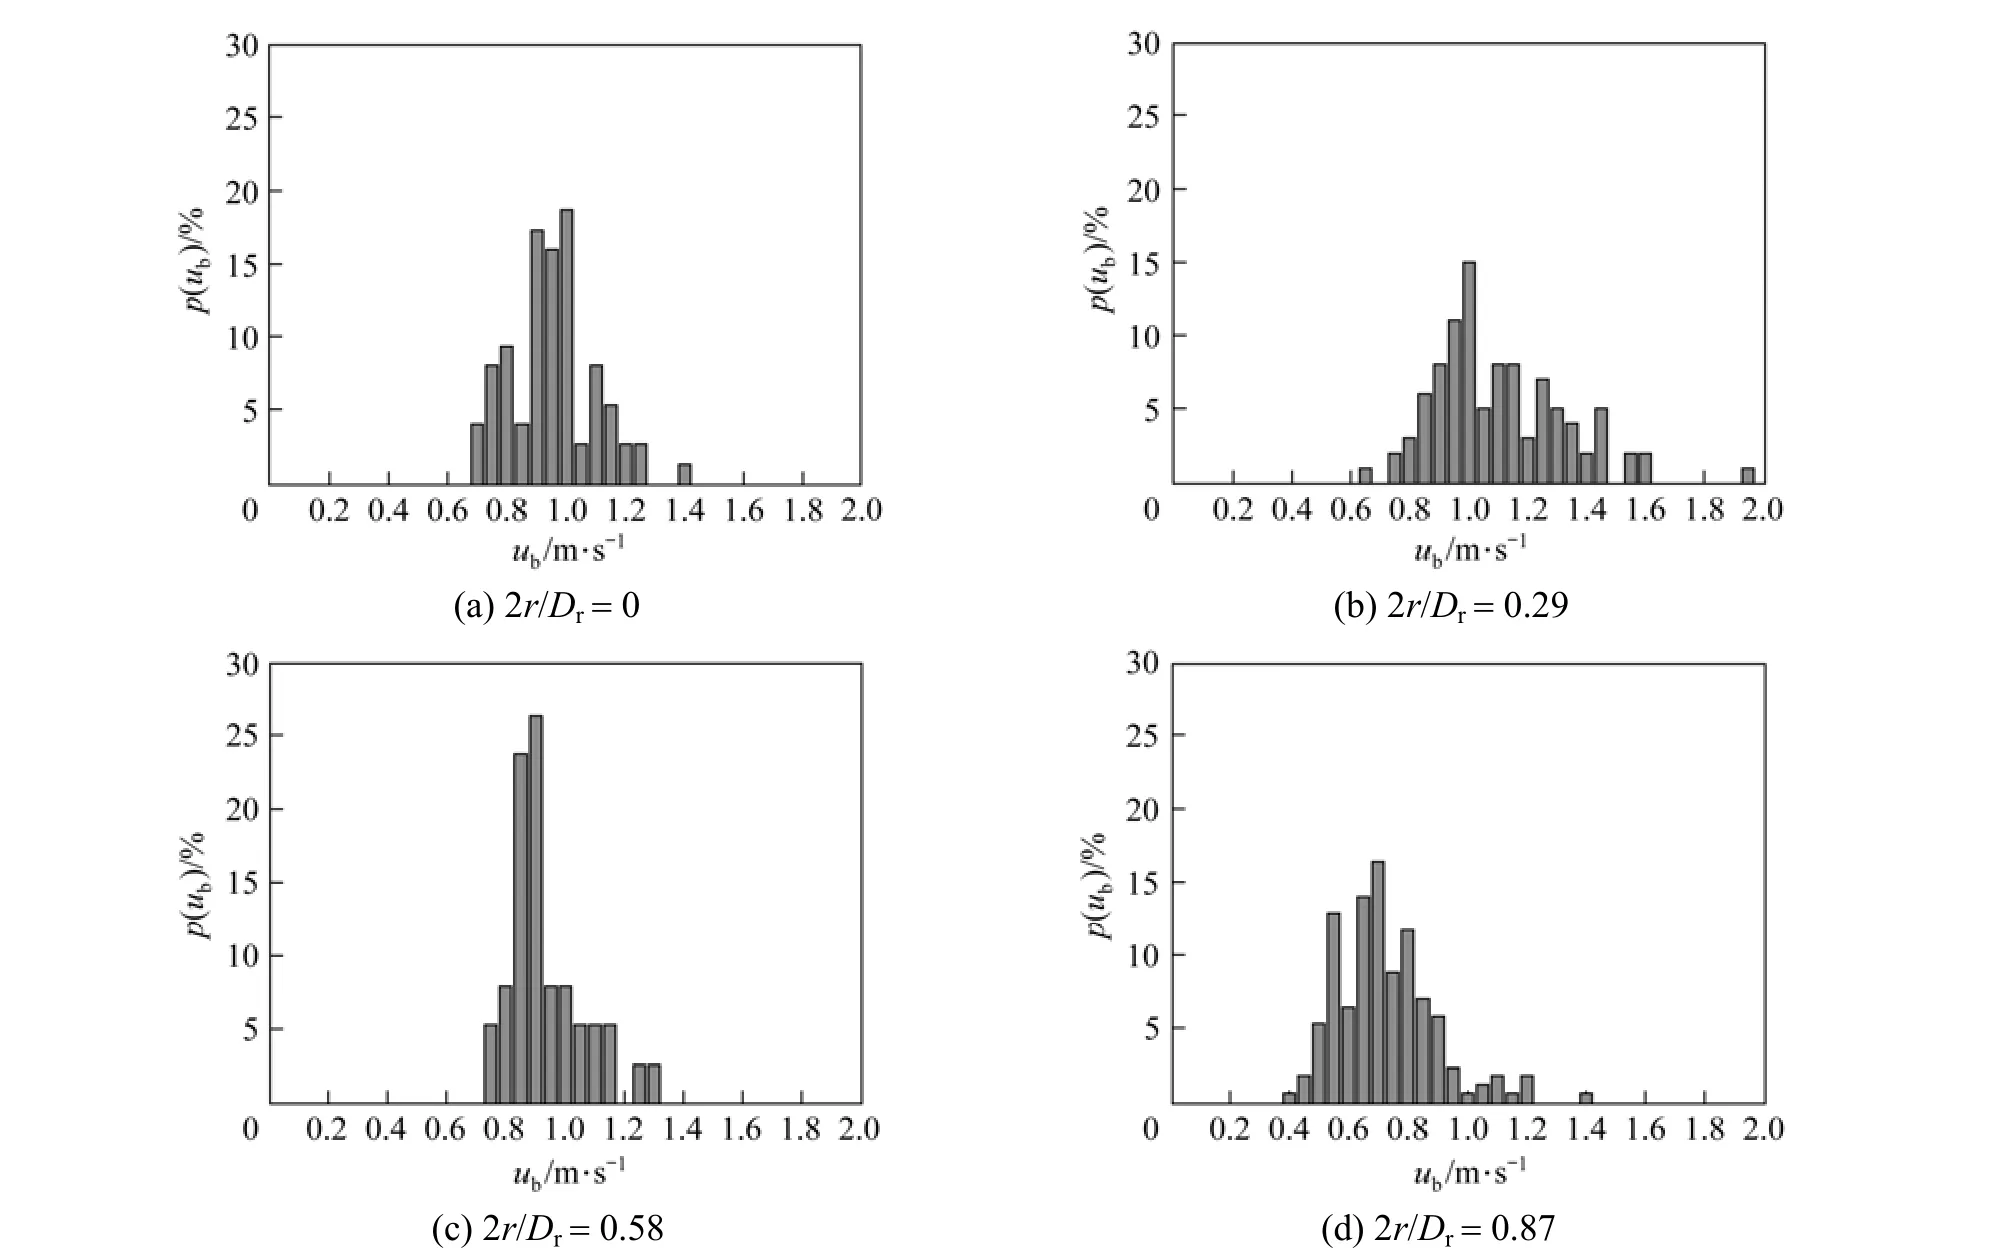
Figure 6 Radial profiles of bubble rise velocity at h/D=4.62 (air-water, Hliquid=86 cm, ug=0.03 m·s, Tc=0.10 m, Bc=0.06 m, Dr: Φ200×7 mm, unscreened perforated plate)
As we known, the rise velocity of a bubble depends mainly on its size, and the velocity affects the local turbulent kinetic energy and its dissipation rate. Luo and Al-Dahhan [41] utilized computational fluid dynamics approaches to point out that the riser center and the top region are the efficient mixing zone. These experimental observations provide further evidence in consistence with this conclusion.
3.2 Macro-mixing time
3.2.1 Effect of superficial gas velocity
Figure 7 macro-mixing time is obviously reduced by increasing the superficial gas velocity ug. The density difference between the riser and the downcomer increases with ug, enhancing the driving force for liquid circulation. The tracer elements break along the flow direction in a short time, which, in turn, enhances the macro-mixing in the loop reactor and decreases the macro-mixing time.
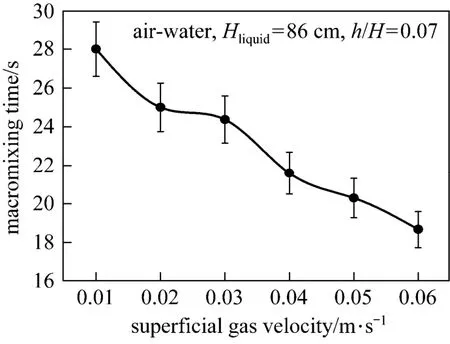
Figure 7 Macro-mixing time as a function of superficial gas velocity in a loop reactor (D=0.3 m, L=0.70 m, Tc=0.10 m, Bc=0.06 m, Dr: Φ200×7 mm, unscreened perforated plate)
3.2.2 Effect of top clearance
Top clearance is the distance between the upper end of draft tube and the static liquid level. It is an operation parameter that plays a decisive role in circulation resistance and liquid-gas separation. Fig. 8 shows that the macro-mixing time first declines and then increases with the increase of top clearance. There is an optimal value of top clearance at H=2.9D.
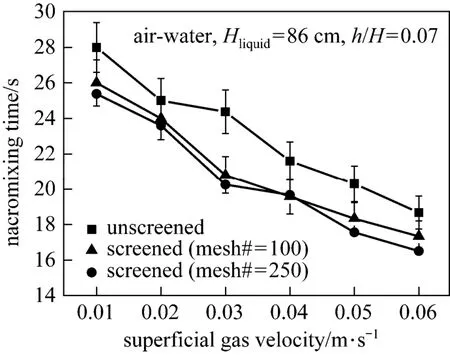
Figure 9 Macro-mixing time as a function of gas superficial velocity by different perforated plate distributor apertures (D=0.3 m, L=0.70 m, Tc=0.10 m, Bc=0.06 m, Dr: Φ200×7 mm)
The macro-mixing time is the longest when the top clearance in non-aerated liquid height coincides with or a little higher than the upper end of the draft tube. No ring vortex is found near the deflection zone from the riser to the downcomer. At low top clearances (Tc=10 cm), larger top clearance and static liquid height enlarge the top region significantly, which provides a larger space for gas-liquid separation and facilitates the bulk liquid flow deflected from the riser into the downcomer. The liquid circulation velocity increases as the size of top region increases. These results are consistent with the conclusion made by Luo and Al-Dahhan [41] and Chisti [42]. The improved macro-mixing reduces the overall macro-mixing time in the loop reactor. However, for too large top clearances, further increase of static liquid height only enlarges the liquid volume of top deflection zone for greater mixing burden, minimally improves the gas-liquid separation, and hardly facilitates the reversal of liquid flow. The turbulence extent of liquid at the top of reactor decreases with the increase of circulation resistance per unit volume, so does the macro-mixing.
3.2.3 Effect of perforated plate distributor apertures
Gas distributors are usually used for flow distribution to homogenize the energy input and to strengthen the mass transfer by bubble dispersion. Many researchers compared different kinds of sparger by their power consumption and dispersion characteristics. The feasibility of bubble redistribution by arranging a screen mesh above the perforated plate distributor is investigated in this study with respect to macro-mixing time.
The macro-mixing time is related to liquid circulation velocity determined by the energy balance on the reactor. The energy input into the riser occurs mainly due to isothermal expansion of the gas as it rises up along the riser. Energy is dissipated because of wall friction in the riser and the downcomer, turbulent energy dissipation due to internal liquid recirculation within the riser, and friction and drag loss in the gas-liquid interface. It can be seen from Fig. 9 that, compared with the unscreened plate, the screened plate has slightly better effect for macro-mixing. The screened plate plays a role in redistribution of bubbles.The kinetic energy component of the jet from the gas sparger is usually small and can be neglected. Thus there is no significant difference in the macro-mixing time with these two screened plates. These observations are in consistent with the liquid velocity and energy loss prediction results of García and Letón [43].
3.3 Microscopic mixing
3.3.1 Determination of feed time
Duration of feeding time is a critical parameter for micro-mixing experiments. If the feeding time is shorter than the reaction time, the segregation index XQbecomes a function of feed dispersion rate, and the plume of sodium hydroxide can not be well dispersed. This experiment is thus controlled by both macro- and micro-mixing mechanism, and leads to formation of more by-products and a high value of segregation index. Therefore, the feeding time must be sufficiently long (or feeding rate must be slow), so that the macro-mixing effect does not interfere and the micro-mixing is the controlling mechanism.
To test if the feeding time is long enough, the experimental conditions (such as unscreened perforated plate, low superficial gas velocity, and surface feeding) should produce relatively poor environment for macro-mixing capacity to make sure that such a macro-mixing environment is suitable for all subsequent micro-mixing experiments. In Fig. 10, the feeding rate is changed to keep a constant total feed amount. The increase in feed time makes XQdecrease to an asymptotic value. It shows that micro-mixing becomes dominating if the feed time of NaOH (2.0 mol·L−1) is longer than 45 min (at the feeding rate of 22.2 ml·min−1). This means that when the feeding time is longer than 35 min, macro-mixing effects are eliminated negligible and the selectivity of the by-product of fast reactions or XQis only micro-mixing relevant. Consequently, a little longer feeding time of 45 min is used for subsequent experiments with two parallel reactions in the reactor.
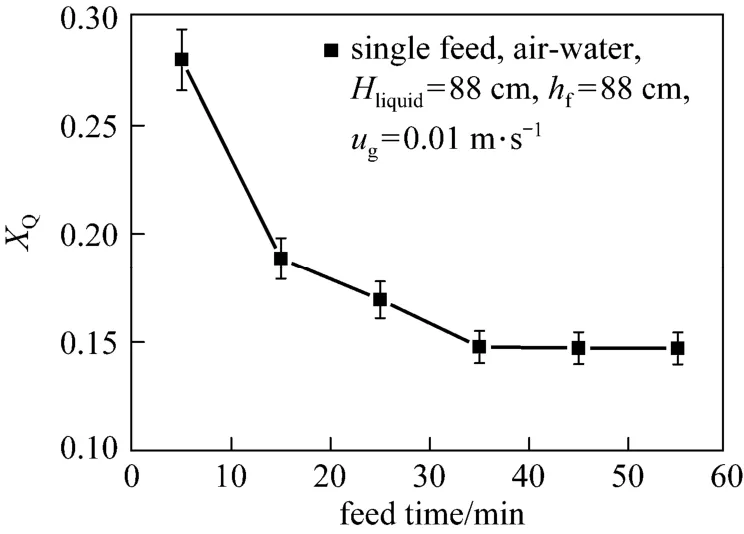
Figure 10 Segregation index as a function of feed time (Tc=0.12 m, Bc=0.06 m, Dr: Φ140×5 mm, feeding outside of the draft tube, unscreened perforated plate)
3.3.2 Effect of aχial feed position
For Hliquid=88 cm, eight axial feed positions are considered in order to investigate the effect of axial feed position on segregation index, as shown in Fig. 11. It can be explained by the widely varying energy dissipation rates throughout the loop reactor. The turbulent kinetic energy is especially large in the bottom (h= 16 cm) and top regions (h=66 cm), in which high turbulent kinetic energy corresponds to drastic energy dissipation.
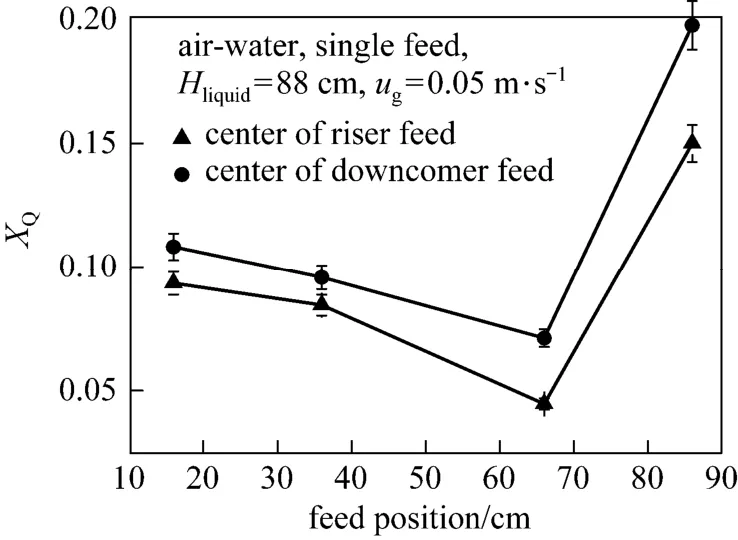
Figure 11 Segregation index as a function of feed position (Tc=0.12 m, Bc=0.06 m, Dr: Φ140×5 mm, tf=45 min, unscreened perforated plate)
When the feed position is located at h=66 cm inside the draft tube, the lowest segregation index is achieved. It is caused by the fast energy dissipation rates where vortexes form near the upper part of the riser. When the sodium hydroxide is injected just below the free surface of liquid (h=86 cm), the segregation index is the highest owing to the much smaller local energy dissipation rate than that in the other regions in the reactor. It is consistent with the result of the turbulent kinetic energy distribution analyses presented by Luo and Al-Dahhan [41, 44].
3.3.3 Effect of superficial velocity
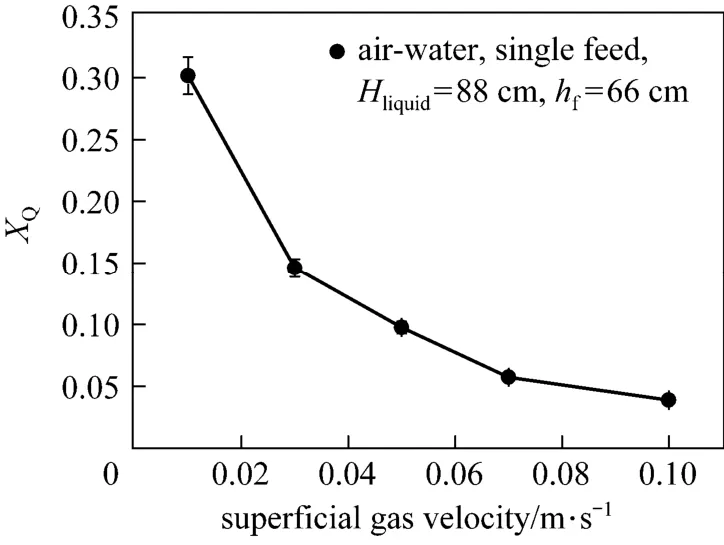
Figure 12 Segregation index as a function of superficial velocity (Tc=0.12 m, Bc=0.06 m, Dr: Φ140×5 mm, tf=45 min, feeding inside of the draft tube, unscreened perforated plate)
Figure 12 shows a general trend that segregation index declines with the increase of superficial gas velocity or power input into the fluid. When the gas is induced to the reactor, it strengthens the local mixing with its blending and shearing effects. The magnitude of turbulent kinetic energy increases with the increase of superficial velocity. By higher turbulence andbackmixing intensities [13], the micro-mixing in the reactor is enhanced. The specific power input to the reactor increases with superficial gas velocity. More bubbles are present at high superficial velocities. Due to the increase in liquid velocity, bubbles are dragged into the downcomer near the region of higher turbulent kinetic energy in the downcomer [45]. Decrease in the driving force for the circulation results in less increase of energy loss at the gas-liquid interface. Higher superficial liquid velocity counteracts the improvement of shear capacity and turbulence intensity by adding the same amount of gas [9]. It is also a reflection of decreased sensitive degree to the change of superficial gas velocity as seen in Fig. 12.
3.3.4 Effect of top clearance
The mixing process in loop reactors consists of combined effects occurring in the draft tube, annular space and in the top and bottom regions. Fig. 13 shows that as the top clearance (based on the static liquid height) increases from 0 to 18 cm, the change of XQis insignificant. The top region of the airlift loop reactor is usually assumed as complete mixing flow while the riser and the downcomer are considered as two plug-flow sections [13, 46]. However, this best-mixed hypothesis does not accord with our experiment. As the top clearance varies from 0 to 6 cm, no bubble is found to entrap into the downcomer by the vortices formed at the entrance of the downcomer. Disengagement of bubbles from the liquid phase, which occurs at the central top of the draft tube, leads to fast energy dispersion. The increase of the top clearance (6 to 18 cm) accounts for the bulk liquid circulation. The slight decrease of segregation index can be partly explained by the increase in the residence time of the fluid in the best-mixed region of the reactor. With further increase of the top clearance (24 to 30 cm), bubbles are easier to escape from the liquid phase, lowering gas holdups and liquid circulation velocities as we observed in the experiments. Circulation resistance increases simultaneously with the liquid level above the draft tube. Ultimately, disengagement of these bubbles leads to energy loss on the liquid surface. There is no enough turbulent energy in the bulk fluid to separate the reactant and product. Thus the entire selectivity of the reaction deteriorates.
3.3.5 Effect of area ratio of riser and downcomer
The change of diameter ratio affects the liquid circulation velocity directly. For a given H/D, the most unfavorable conditions are obtained at a low Ar/Adratio, because at this draft tube geometry the liquid velocity of the riser is too high, which offers more opportunities for bubbles to escape from the surface rather than being entrained by the downward liquid into the annual space. A proper increase in Ar/Adabates the above disadvantages and reduces the flow resistance of the riser so that the volumetric rate of liquid circulation is increased. Fig. 14 shows that, while the cross-sectional area for flow of the riser is approximately equal to the cross-sectional area of the downcomer (Ar/Ad≈1), coalescence of bubbles in the two-phase flow is almost inhibited [11]. The total resistance along the flow path is the smallest, leading to the lowest XQ. Continuous increase of Ar/Adratio further reduces liquid circulation velocity due to higher circulation resistance. Bubbles under this condition have more chances to escape from the surface rather than form an entraining swirl in the separated zone. Obviously, the decrease of micro-mixing efficiency is due to reduced turbulent level.
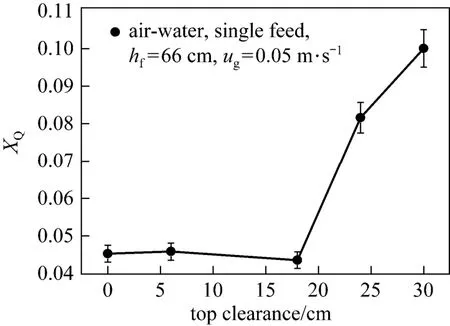
Figure 13 Segregation index as a function of top clearance (Bc=0.06 m, Dr: Φ140×5 mm, tf=45min, feeding inside the draft tube, unscreened perforated plate)
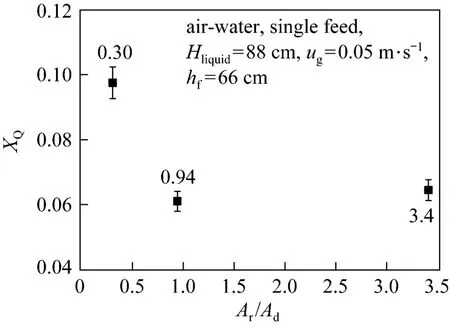
Figure 14 Segregation index as a function of area ratio of riser and downcomer (Tc=0.12 m, Bc=0.06 m, tf=45 min, feeding inside of the draft tube, unscreened perforated plate)
4 CONCLUSIONS
Gas-liquid macro- and micro-mixing in an airlift loop reactor with low aspect ratio (H/D≤5) have been investigated. The macro-mixing time of the continuous phase is determined by means of the electrical conductivity probe technique. For the sake of understanding the interaction between gas and liquid phases, local bubble behavior in the reactor are estimated by utilizing the dual-tip electrical conductivity probe. Moreover, the micro-mixing investigations in loop reactors are presented for the first time determined experimentally by segregation index. The following conclusions can be obtained.
(1) Different from the airlift loop reactor with high aspect ratio, for the low aspect ratio reactor, the maximum value of homogeneous superficial gas velocitycan reach 0.06 m·s−1, which is larger than 0.03 m·s−1reported in literature. Thus, the loop reactor with low aspect ratio has better operation flexibility in a wider range of the homogeneous regime.
(2) The experimental results on macro- and micro-mixing characteristics such as macro-mixing time and segregation index reveal that superficial gas velocity plays important role in mixing in loop reactors. Higher superficial gas velocity corresponding to higher energy input increases the driving force for circulation and overall energy dissipation rate as expected.
(3) Top clearance and Ar/Adsignificantly affect the macro- and micro-mixing characteristics since they alter the flow resistance and the dissipation of kinetic energy. The optimal values of Tcof 10 cm result in the lowest macro-mixing time while Tcof 16 cm and Ar/Ad≈1 result in the lowest segregation index in airlift loop reactors.
(4) Due to the small kinetic energy component of the jet from the gas sparger, there is slight improvement in the macro-mixing utilizing macro-mixing time as an indicator by arranging a screen mesh above the perforated plate distributor.
(5) From bubble behavior, it can be easily found that the riser center and the top region of the reactor are efficient mixing regions. The uppermost part of the draft tube is suitable for feeding of limiting reactant for better utilization of the micro-mixing capacity.
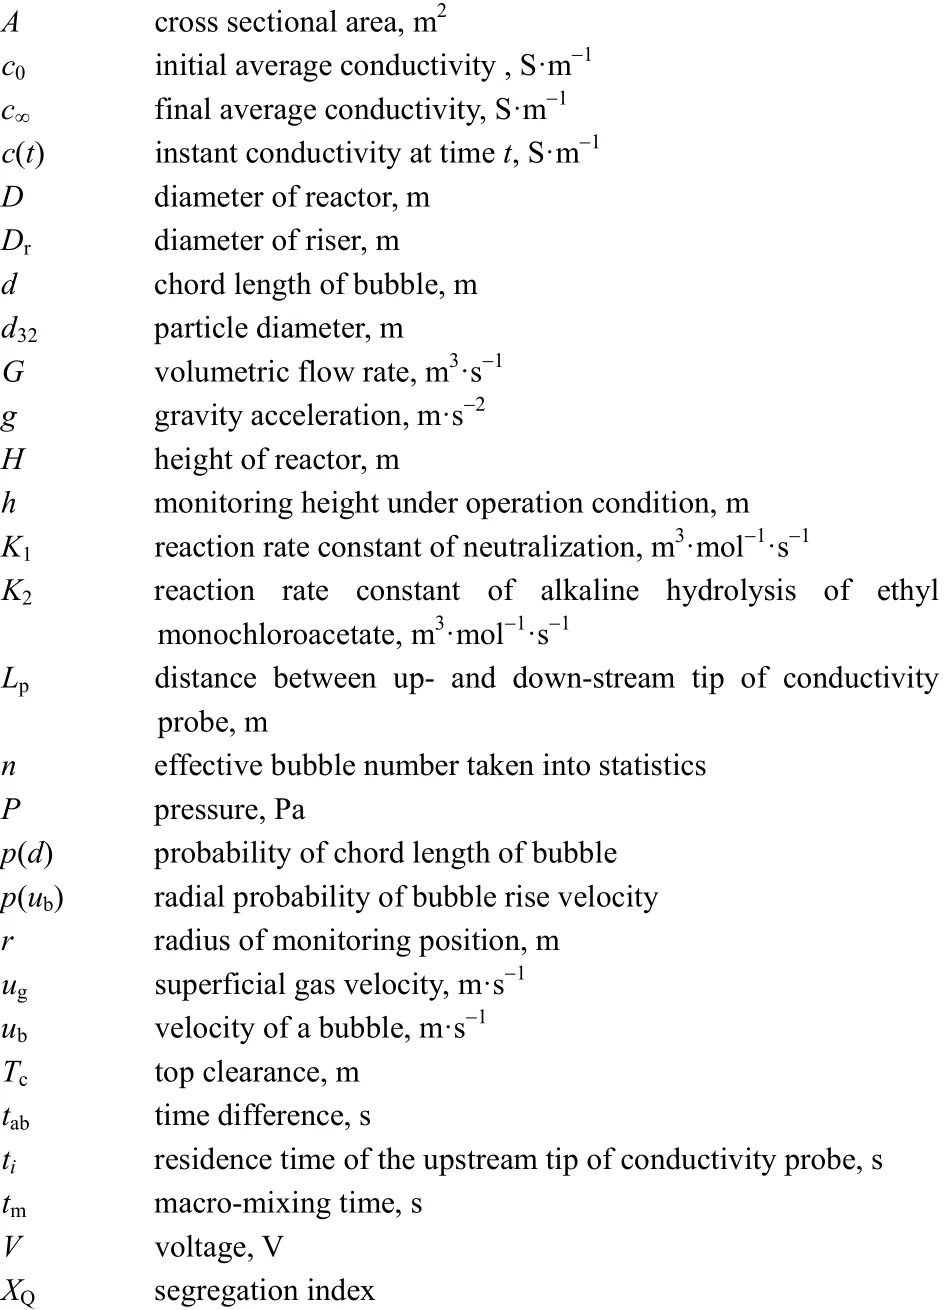
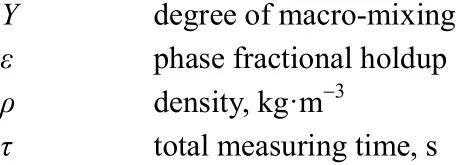
NOMENCLATURE
Subscripts
REFERENCES
1 Yan, C.Y., Lu, C.X., Liu M.X., “Hydrodynamics in airlift loop section of petroleum coke combustor”, Powder Technol., 192 (2), 143-151 (2009).
2 Hol, A., Weijden, R.D., Weert, G.V., Kondos, P., Buisman C.J.N.,“Bio-reduction of pyrite investigated in a gas lift loop reactor”, Int. J. Miner. Process., 94 (3-4), 140-146 (2010).
3 Boger, T., Roy, S., Heibei, A.K., Borchers, O., “A monolith loop reactor as an attractive alternative to slurry reactors”, Catal. Today, 79 (1-4), 441-451 (2003).
4 Liu, Y.N., Jin, D., Lu, X.P., “Treatment of dimethoate aqueous solution by using ultrasonic airlift loop reactor”, Chin. J. Chem. Eng., 16 (3), 361-364 (2008).
5 Koch, K., Wichern, M., Lübken, M., Horn, H., “Mono fermentation of grass silage by means of loop reactors”, Biosource Technol., 100 (23), 5934-5940 (2009).
6 Sun, Z., Zheng, S.L., Zhang, Y., “Investigation of efficient conditions for oxidative roasting of chromite ore to produce potassium chromate with KOH additive”, Steel Res. Int., 78 (7), 574-576 (2007).
7 Rao, K.S.M.S.R., Joshi, J.B., “Liquid-phase mixing and power consumption in mechanically agitated solid-liquid contactors”, Chem. Eng. J., 39 (2), 111-124 (1998).
8 Vial, C., Poncin, S., Wild, G., Midoux, N., “A simple method for regime identification and flow characterisation in bubble columns and airlift reactors”, Chem. Eng. Process., 40 (2), 135-151 (2001).
9 Fadavi, A., Chisti, Y., “Gas holdup and mixing characteristics of a novel forced circulation loop reactor”, Chem. Eng. J., 131 (1-3), 105-111 (2007).
10 Merchuk, J.C., Ladwa, N., Cameron, A., Bulmer, M., Berzin, I., Pickett, A.M., “Liquid flow and mixing in concentric tube air-lift reactors”, J. Chem. Technol. Biotechnol., 66 (2), 174-182 (1996).
11 Weiland, P., “Influence of draft tube diameter on operation behavior of airlift loop reactors”, Ger. Chem. Eng., 7, 374-385 (1984).
12 Merchuk, J.C., Contreras, A., García, F., Molina, E., “Studies of mixing in a concentric tube airlift bioreactor with different spargers”, Chem. Eng. Sci., 53 (4), 709-719 (1998).
13 Choi, K.H., Chisti, Y., Moo-Young, M., “Influence of gas-liquid separator design on hydrodynamic and mass transfer performance of split-channel airlift reactors”, J. Chem. Technol. Biotechnol., 62 (4), 327-332 (1995).
14 Fu, C.C., Lu, S.Y., Hsu, Y.J., Chen, G.C., Lin, Y.R., Wu, W.T., “Superior mixing performance for airlift reactor with a net draft tube”, Chem. Eng. Sci., 59 (14), 3021-3028 (2004).
15 Lu, X.P., Ding, J., Wang, Y.R., Shi, J., “Comparison of hydrodynamics and mass transfer characteristics of a modified square airlift reactor with common airlift reactors”, Chem. Eng. Sci., 55 (12), 2257-2263 (2000).
16 Huang, Q.S., Yang, C., Yu, G.Z., Mao, Z.S., “CFD simulation of hydrodynamics and mass transfer in an internal airlift loop reactor using a steady two-fluid model”, Chem. Eng. Sci., 65 (20), 5527-5536 (2010).
17 Gavrilescu, M., Tudose, R.Z., “Residence time distribution of the liquid phase in a concentric- tube airlift reactor”, Chem. Eng. Process., 38 (3), 225-238 (1999).
18 Gavrilescu, M., Tudose, R.Z., “Mixing studies in external-loop airlift reactors”, Chem. Eng. J., 66 (2), 97-104 (1997).
19 Vial, C., Poncin, S., Wild, G., Midoux, N., “Experimental and theoretical analysis of axial dispersion in the liquid phase in external-loop airlift reactors”, Chem. Eng. Sci., 60 (22), 5945-5954 (2005).
20 Mirón, A.S., García, M.C.C., Camacho, F.G., Grima, E.M., Chisti, Y.,“Mixing in bubble column and airlift reactors”, Chem. Eng. Res. Des., 82 (A10), 1367-1374 (2004).
21 Gondo, S., Tanaka, S., Kazikuri, K., Kusunoki, K., “Liquid mixing by large gas bubbles in bubble columns”, Chem. Eng. Sci., 28 (7), 1437-1445 (1973).
22 Wilkinson, P.M., Haringa, H., Stokman, F.P.A., “Liquid mixing in a bubble column under pressure”, Chem. Eng. Sci., 48 (10), 1785-1791 (1993).
23 Assirelli, M., Bujalski, W., Eaglesham, A., Nienow, A.W., “Intensifying micromixing in a semi-batch reactor using a Rushton turbine”, Chem. Eng. Sci., 60 (8-9), 2333-2339 (2005).
24 Nouri, L., Legrand, J., Benmalek, N., Imerzoukene, F., Yeddou, A.R., Halet, F., “Characterisation and comparison of the micromixing efficiency in torus and batch stirred reactors”, Chem. Eng. J., 142 (1), 78-86 (2008).
25 Bourne, J.R., Kozicki, F., Rys, P., “Mixing and fast chemical reaction (I): Test reactions to determine segregation”, Chem. Eng. Sci., 36 (10), 1643-1648 (1981).
26 Bourne, J.R., Yu, S.Y., “Investigation of micromixing in stirred tank reactors using parallel reactions”, Ind. Eng. Chem. Res., 33 (1), 41-55 (1994).
27 Villermaux, J., Fournier, M.C., “Potential use of a new parallel reaction system to characterize micromixing in stirred reactors”, AIChE Symp. Ser., 299, (90), 50-54 (1994).
28 Zhao, D., Müller-Steinhagen, H., Smith, J.M., “Micromixing in boiling and hot sparged systems: Development of a new reaction pair”, Chem. Eng. Res. Des., 80 (A8), 880-886 (2002).
29 Öncül, A.A., Janiga, G., Thévenin, D., “Comparison of various micromixing approaches for computational fluid dynamics simulation of barium sulfate precipitation in tubular reactors”, Ind. Eng. Chem. Res., 48 (2), 999-1007 (2009).
30 Cheng, J.C., Feng, X., Cheng, D., Yang, C., “Retrospect and perspective of micro-mixing studies in stirred tanks”, Chin. J. Chem. Eng., 20 (1), 178-190 (2012).
31 Han, Y., Wang, J.J., Gu, X.P., Feng, L.F., “Numerical simulation on micromixing of viscous fluids in a stirred-tank reactor”, Chem. Eng. Sci., 74 (9-17), 9-17 (2012).
32 Yang, H.J., Chu, G.W., Xiang, Y., Chen, J.F., “Characterization of micromixing efficiency in rotating packed beds by chemical methods”, Chem. Eng. J., 121 (2-3), 147-152 (2006).
33 Jia, Z.Q., Zhao, Y.Q., Liu, L.Q., He, F., Liu, Z.Z., “A membrane reactor intensifying micromixing: Effects of parameters on segregation index”, J. Membrane Sci., 276 (1-2), 295-300 (2006).
34 Meyer, T., Renken, A., “Characterization of segregation in tubular polymerization reactor by a new chemical method”, Chem. Eng. Sci., 45 (8), 2793-2800 (1990).
35 Yang, K., Chu, G.W., Shao, L., Xiang, Y., Zhang, L.L., Chen, J.F.,“Micromixing efficiency of viscous media in micro-channel reactor”, Chin. J. Chem. Eng., 17 (4), 546-551 (2009).
36 Schaer, E., Guichardon, P., Falk, L., Plasari, E., “Determination of local energy dissipation rates in impinging jets by a chemical reaction method”, Chem. Eng. J., 72 (2), 125-138 (1999).
37 Zhu, S., Bao Y.Y., Chen, L., Gao Z.M., Wang, D.S., “Bubble size distributions measurement in a gas-liquid multi-impeller stirred tank by using dual-conductivity probe”, J. Chem. Eng. Chinese Univ., 25 (6), 977-984 (2011). (in Chinese)
38 Chisti, M.Y., Airlift Bioreactors, Elsevier Applied Biotechnology Series, Elsevier, London, 125-130 (1989).
39 Fan, L.S., Kitano, K., Krescher, B.E., “Hydrodynamics of gas-liquidsolid annular fluidization”, AIChE J., 33 (2), 225-231 (1987).
40 Tomiyama, A., Tamai, H., Zun, I., Hosokawa, S., “Transverse migration of single bubbles in simple shear flow”, Chem. Eng. Sci., 57 (11), 1849-1858 (2002).
41 Luo, H.P., Al-Dahhan, M.H., “Macro-mixing in a draft tube airlift bioreactor”, Chem. Eng. Sci., 63 (6), 1572-1585 (2008).
42 Chisti, Y., “Pneumatically agitated bioreactors in industrial and environmental bioprocessing: Hydrodynamics, hydraulics and transport phenomena”, Am. Soc. Mech. Eng., 51, 33-122 (1998).
43 García, C.E., Letón, P., “Prediction of gas hold-up and liquid velocity in airlift reactors using two-phase flow friction coefficients”, J. Chem. Tech. Biotechnol., 67 (4), 338-396 (1996).
44 Luo, H.P., Al-Dahhan, M.H., “Local characteristics of hydrodynamics in draft tube airlift bioreactor”, Chem. Eng. Sci., 63 (11), 3057-3068 (2008).
45 Oey, R.S., Mudde, R.F., Portela, L.M., Akker, H.E.A.V.D., “Simulation of a slurry airlift using a two-fluid model”, Chem. Eng. Sci., 56 (2), 673-681 (2001).
46 Merchuk, J.C., Yunger, R., “The role of gas-liquid separator of airlift reactors in the mixing process”, Chem. Eng. Sci., 45 (9), 2973-2975 (1990).
2012-12-21, accepted 2013-03-13.
* Supported by the National Basic Research Program of China (2012CB224806), the National Science Fund for Distinguished Young Scholars (21025627), and the National Natural Science Foundation of China (21206166, 20990224), the National High Technology Research and Development Program of China (2012AA03A606) and Beijing Natural Science Foundation (2112038).
** To whom correspondence should be addressed. E-mail: chaoyang@ipe.ac.cn
猜你喜欢
杂志排行

Chinese Journal of Chemical Engineering的其它文章
- Roles of Biomolecules in the Biosynthesis of Silver Nanoparticles: Case of Gardenia jasminoides Extract*
- Modeling and Optimization for Short-term Scheduling of Multipurpose Batch Plants*
- Symbiosis Analysis on Industrial Ecological System*
- Phase Behavior of Sodium Dodecyl Sulfate-n-Butanol-Kerosene-Water Microemulsion System*
- Photochemical Process Modeling and Analysis of Ozone Generation
- Unified Model of Purification Units in Hydrogen Networks*