Wave-induced flow and its influence on ridge erosion and channel deposition in Lanshayang channel of radial sand ridges*
2014-06-01XUZhuo徐卓ZHANGWei张玮
XU Zhuo (徐卓), ZHANG Wei (张玮)
College of Harbor, Coastal and Off-shore Engineering, Hohai University, Nanjing 210098, China,
E-mail: feiwenzhuo1980@sina.com
LU Pei-dong (陆培东)
Nanjing Hydraulic Research Institute, Nanjing 210029, China
AN Xiang (安翔)
China Communication Planning and Design Institute for Water Transportation LTD, Beijing 100007, China CHEN Ke-feng (陈可峰)
Nanjing Hydraulic Research Institute, Nanjing 210029, China
Wave-induced flow and its influence on ridge erosion and channel deposition in Lanshayang channel of radial sand ridges*
XU Zhuo (徐卓), ZHANG Wei (张玮)
College of Harbor, Coastal and Off-shore Engineering, Hohai University, Nanjing 210098, China,
E-mail: feiwenzhuo1980@sina.com
LU Pei-dong (陆培东)
Nanjing Hydraulic Research Institute, Nanjing 210029, China
AN Xiang (安翔)
China Communication Planning and Design Institute for Water Transportation LTD, Beijing 100007, China CHEN Ke-feng (陈可峰)
Nanjing Hydraulic Research Institute, Nanjing 210029, China
(Received May 3, 2013, Revised December 17, 2013)
Very limited modeling studies were available of the wave-induced current under the complex hydrodynamic conditions in the South Yellow Sea Radial Sand Ridge area (SYSRSR). Partly it is due to the difficulties in estimating the influence of the waveinduced current in this area. In this study, a coupled 3-D storm-surge-wave model is built. In this model, the time-dependent varying Collins coefficient with the water level method (TCL) are used. The wave-flow environment in the Lanshayang Channel (LSYC) during the “Winnie” typhoon is successfully represented by this model. According to the modelling results, at a high water level (HWL), the wave-induced current similar to the long-shore current will emerge in the shallow area of the ridges, and has two different motion trends correlated with the morphological characteristics of the ridges. The wave-induced current velocity could be as strong as 1 m/s, which is at the same magnitude as the tidal current. This result is verified by the bathymetric changes in the LSYC during the “Matsa” typhoon. Thus, the wave-induced current may be one of the driven force of the ridge erosion and channel deposition in the SYSRSR. These conclusions will help to further study the mechanism of the ridge erosion and channel deposition in the SYSRSR.
typhoon wave, radiation stress, wave-induced current, South Yellow Sea Radial Sand Ridges, ridges erosion and channel deposition
Introduction
The strong erosion of dunes or sand ridges under storm waves is a worldwide problem, which might induce a serious channel deposition and has been a research focus of many scholars in the world[1]. In the South Yellow Sea Radial Sand Ridge area (SYSRSR), the ridge erosion and channel deposition caused by the storm waves are a threat to the reclamation and the port building. Extra protection facilities are usually necessary to control the erosion of tidal flats and ridges[2]. However, these cannot stop the worries about the ridge erosion and channel deposition in this area.
The coastal hydrodynamic field under a storm includes the wave, the tide, the wind driven flow and the wave induced current. The wave-induced current widely existing in the sandy coast has many types, such as the long-shore current, the rip current and the undertow. Field surveys and flume tests suggest that the wave-induced current is closely related to the sediment transport and the morphological responding, especially, the long-shore current and the undertow[1,3,4].
For instance, the bed materials in the SYSRSR area came originally from the discharging sediment of the abandoned Yellow River, transported southward by the long-shore current, and finally deposited in the SYSRSR area.
According to many wave flume studies and field observations, after the incipient stage, the fine sediments move in the offshore direction following the wave induced residual flow (undertow) or the tidal current. And when the significant wave height (Hs)>2.5 m, the undertow near the top of bar is close to 0.5 m/s, and the sediment will move seaward. Hill et al.[4]also had similar observations in Maine coast, but both Hsand undertow are higher than above mentioned.
Due to the pioneer work of Longuet-Higgins and Stewart, the depth-averaged radiation stress was implemented in mathematical models and widely applied to compute the long-shore current and the rip current and their effects on the sediment transport[5].
In real situations, many dynamical factors, e.g., the radiation stress, the wave breaking, the wave-induced mass flux, the turbulence and the eddy viscosity, and the wave-induced streaming above the boundary layer, determine the varying depth of the averagewave velocity profiles. Thus, the depth-averaged radiation stress concept is not enough to describe such varying depth of the velocity profiles in a 3-D model e.g., the undertow. However, the mechanisms of these dynamical factors are extremely complicated and need more studies to gain a concise picture[6].
Generally, the radiation stress is related to the gradient of the wave-induced period-averaged residual momentum flux. Due to the interactions of the dynamical factors mentioned above, especially, the waveinduced turbulence and the wave-flow boundary layer, the residual momentum varies in the vertical direction[6]. Many depth-dependent radiation stress methods were proposed to obtain this depth varying residual momentum e.g., the GLM method, the vertical mapping method, the vortex force method and the Eulerian mean method[7].
These methods were implemented in 3-D hydrodynamic models. Xie[7,8]implemented the depth-dependent radiation stress formula proposed by Lin and Zhang[9]in a coupled model to simulate the long-shore current, the rip current and the undertow with considerable good results.
Kumor et al.[10]implemented the updates of Mellor[11]formula in the ROMS model and compared the results of the original and the modified versions of Mellor formula. It seems that the modified version gives more accurate results for the onshore drift at the surface and the undertow at the bottom.
In the most applied models as the Delft 3D and the Mike, only the radiation stress term at the top layer of the water body was used since the major radiation stress is concentrated at the top layer. Drønen and Deigaard[5]built a quasi-3-D flow mathematical model based on the Mike to simulate the sediment transport and the long-shore bar moving by the undertow under the wave action. However, the bottom velocity may be underestimated without the consideration of the depth-dependent radiation stress in the shallow water area.
In a muddy coast, the waves in normal weather days are small, and the wave-induced current is usually neglected in the observation. Based on a waveflow coupled model, Xie[12]found that the wave-induced current would emerge during storms in the Lianyungang coast. And this wave-induced current has the same magnitude as the tidal current during the flooding and the ebbing in this area.
During the normal calm days, the tidal current provides the dominant energy to shape the terrain in the SYSRSR. Zhang et al.[13]set up a wave model and a surge model separately to analyze the dynamics under storms in this area. They suggested that the big wave is the major reason for serious erosion in ridges and tidal flats and the wind-driven flow is the major energy for sediment transport from ridges to channels. But the wave-flow interaction and the wave-induced current were not taken into account.
Due to the fact that the bed materials at channels are also mud in the SYSRSR, the wave is small in normal days. When the storm affects the SYSRSR, the waves are smaller at the middle and low water levels (MWL and LWL), and larger at a high water level (HWL). Xu[14]suggested a time-dependent Collins coefficient with the water level method (TCL) to simulate the mud damping effects at the LWL and the MWL and the bed friction effects at the HWL.
A 3-D storm-surge-wave coupled model is built in this study based on the storm wave model of Xu[14]. The coupled model is first verified by the long-shore current and the undertow wave flume study. Then, the TCL method is applied in the model, and the waveflow environment during the “Winnie” in the Lanshayang Channel (LSYC) is successfully represented. The characteristics of the wave-induced current in the LSYC are analyzed and the sediment transport by the wave-induced current is further discussed. This study will help to gain a full understanding of the mechanism of the ridge erosion and the channel deposition in the SYSRSR area and similar complex bathymetric changes in estuarine and coast areas.
1. Storm-surge-wave coupled model
The complicated hydrodynamic situation under storms requires to model the storm-surge-wave interactions especially the wave-current interactions. The Delft Open Source and the SWAN are applied here tomodel such storm-surge-wave interactions. The water depth in the most study area is larger than 5 m, thus the SWAN is enough for the wave computation (Delft 3D and SWAN manual).
1.1Storm-surge model
1.1.1 Governing equations
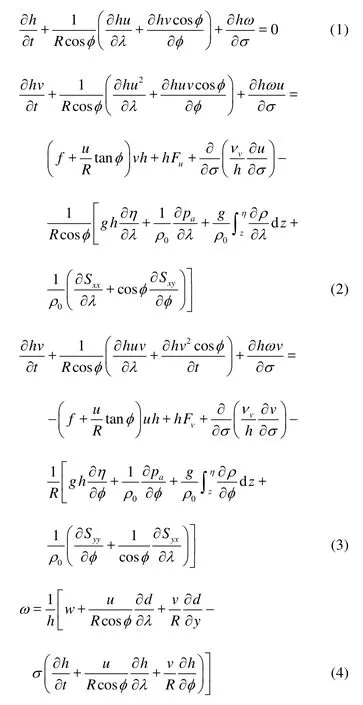
where λ is the longitude, φ is the latitude and R is the radius of the Earth, u, v are the tidal current velocities in λ, φ directions respectively, h=d+η, d is the still water depth, η is the water level, t is the time, f is the Coriolis parameter, g is the gravity acceleration, ρ is the water density,0ρ is the reference density of water, νvis the vertical eddy viscosity computed by the k-ε formula, σ is the scaled vertical co-ordinate, σ =(z -η)/(d + η), z is the vertical coordination in the computation area, Z= η- - d, Sxx, Sxy, Syx, Syyare the wave radiation stress gradients,
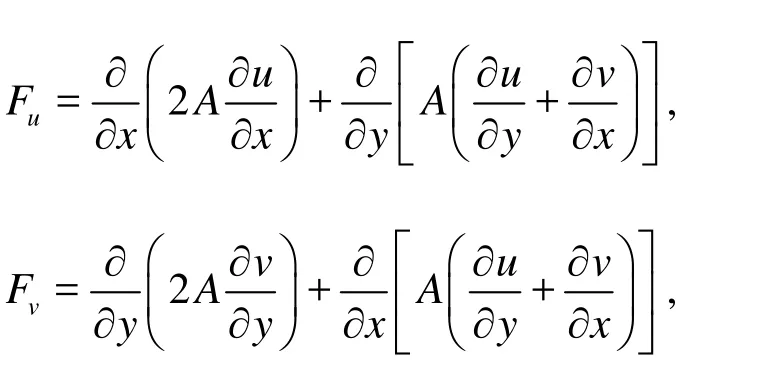
A is the horizontal eddy viscosity.
1.1.2 Initial and boundary conditions
On the open boundaries, the water level is given, and on the solid boundary there is no normal flow. Flood and dry check is applied, and the threshold limitation is 0.05 m. Non-slide condition is imposed on the bottom boundary. At the upper boundary, the wind and air pressure are assumed. Based on the hydrostatic pressure assumption and the assumption that the water density is uniform, we have

1.2Wave model
The typhoon wave model is built by the SWAN (40.85), and the water level and the tidal current obtained by the storm-surge model (sector 2.1) are considered.
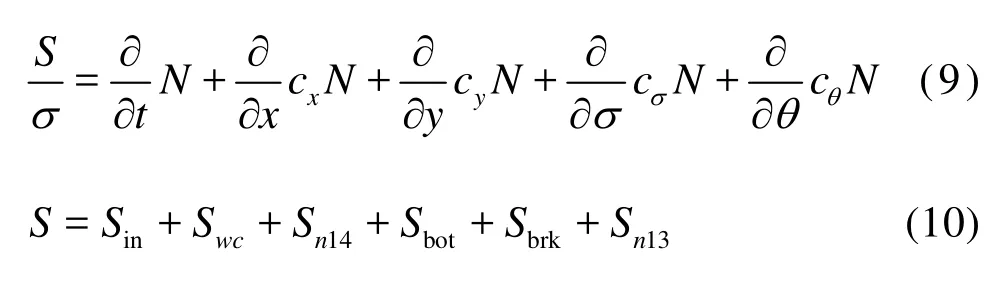
where N(α, )θ is the action density spectrum, α and θ are the angular frequency and the direction of a component wave, cx, cyare the wave group velocities in x and y directions, cσ, cθare the characteristic velocities in σ, θ directions. S is the source term, Sinis the wave growth by the wind, Sn13is the three-wave interaction, Sn14is the four-wave interaction, Swcis the wave decay due to whitecapping, which are used as the default setting of the SWAN, Sbotand Sbrkare the bottom friction and depth-induced wave breaking.
1.3Strom-surge-wave coupled model
1.3.1 The data transferring between the wave and the
tidal current model
The calculated wave data (Section 1.2) will be transferred into the storm-surge model (Section 1.1), then the coupled model is built. The GLM method is applied to solve the momentum equation over the wave period. Meanwhile the hydrodynamic equation is also obtained and solved by the GLM method.
1.3.2 Wave-flow interactions
As mentioned above, the wave-flow interactions are considerably complicated. In this study, only three parts are considered: (1) the enhanced vertical mixing by the eddy due to white-capping, the wave breaking at the top layer and bottom dissipation, (2) the onshore and offshore water motions under the gradient of the radiation-stress, (3) the variations of the bed shear stress .
The gradient of the radiation-stress can be divided into two parts, one part is related to the wave dissipation around the breaking zone and the other is directly related to the driving water motion.
Then the depth-averaged momentum equations in X, Y directions can be expressed as:

U, V are the wave-induced current velocity in X, Y directions, C2Dis the 2-D Chezy coefficient. Fxand Fyare the depth-averaged gradients of the radiation stress in X and Y directions, respectively:
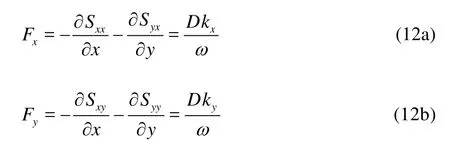
where D is the wave energy dissipation, ω is the wave frequency, kx, kyare the wave numbers in X and Y directions, respectively.
In the 3-D computation, the gradients of the radiation stress are only applied on the top layer of water and the roller effects are considered in the computation.

Fig.1 The long-shore current wave flume research of Visser
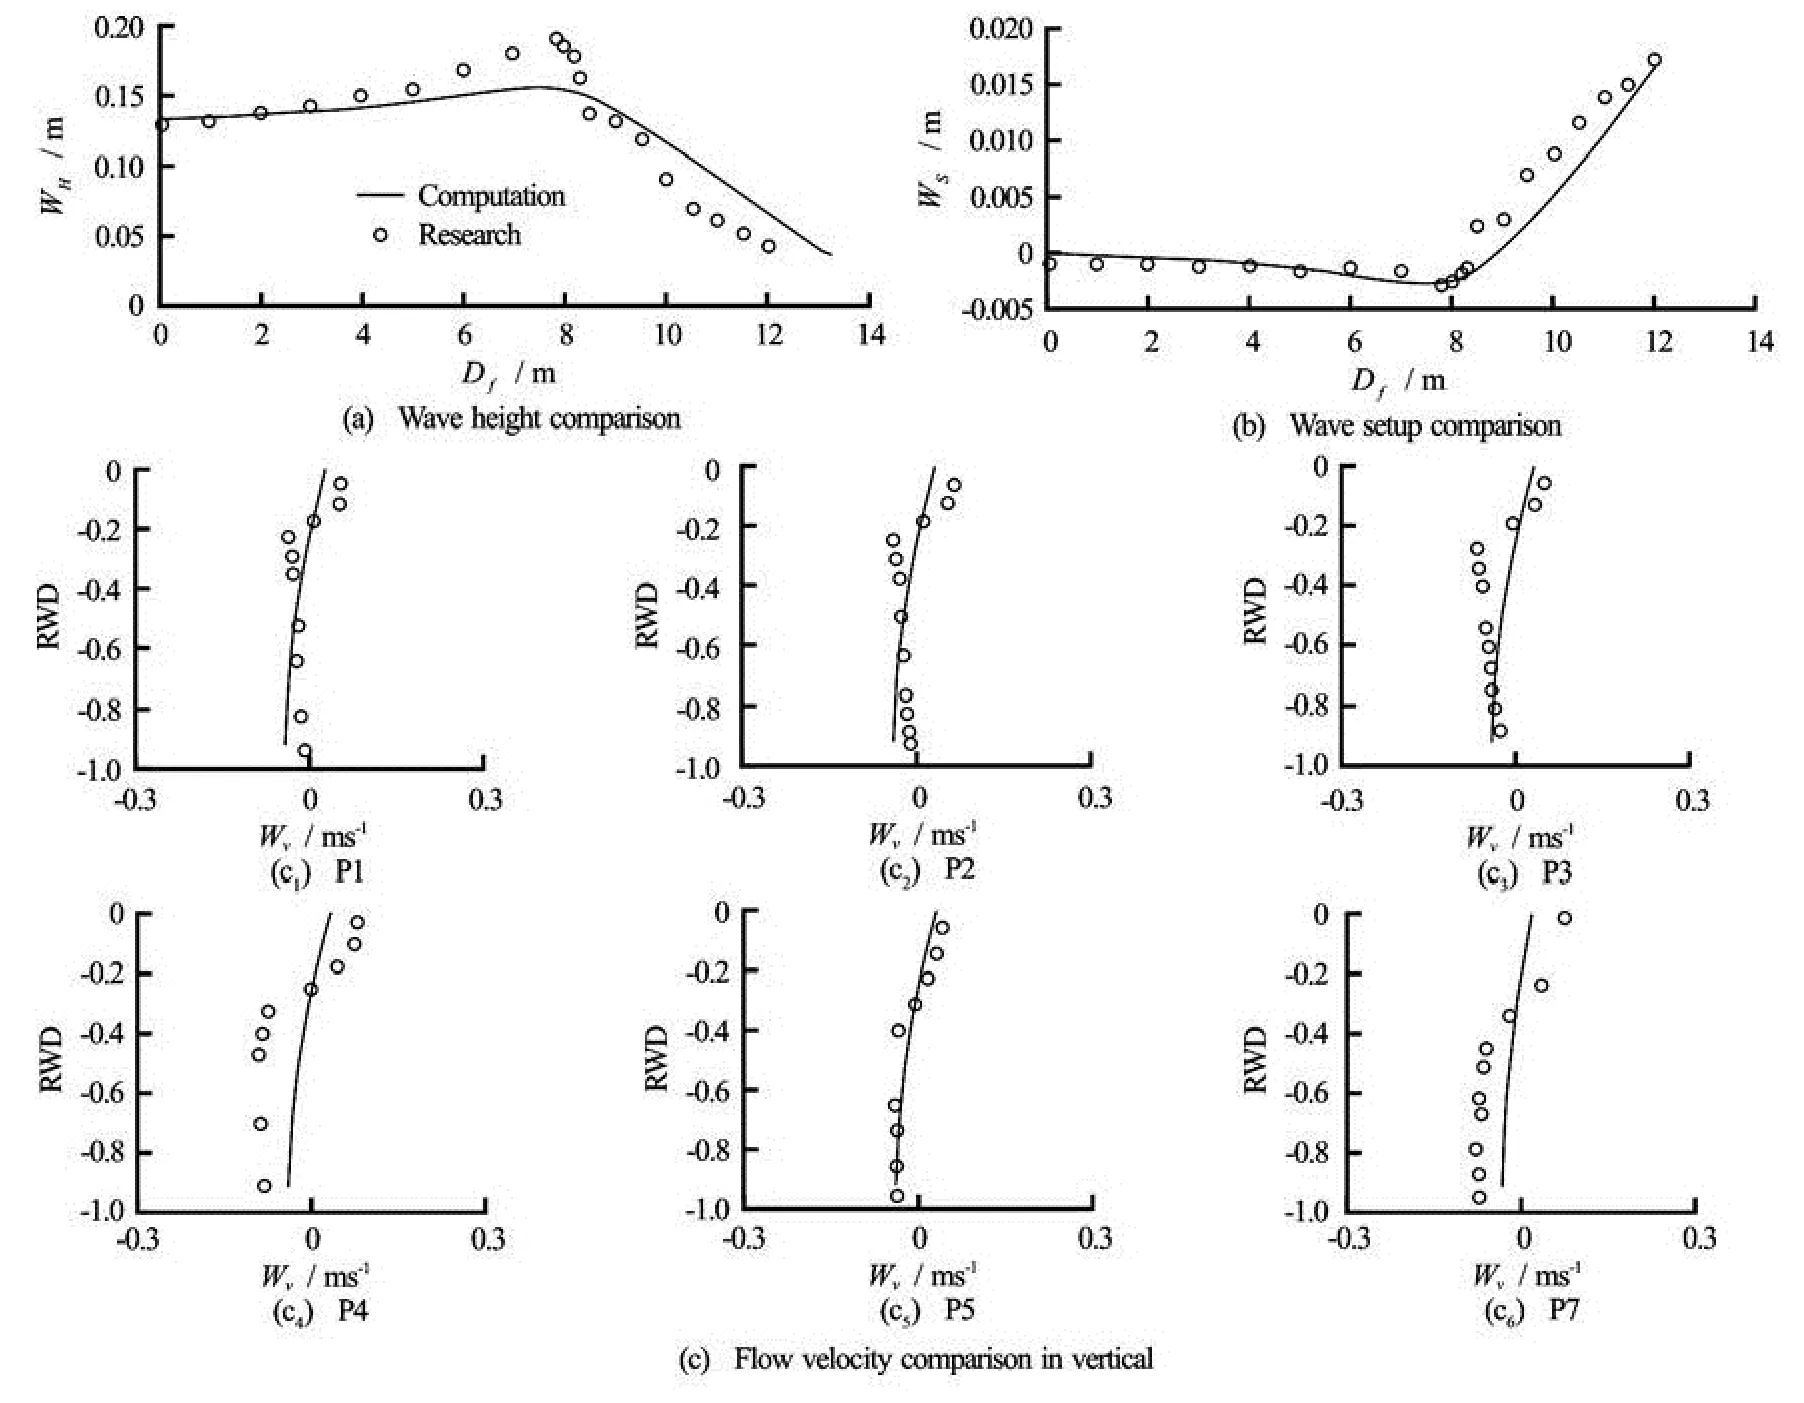
Fig.2 Plunger wave flume research by Ting-Kirby (1994)
2. Model verification
The long-shore current wave flume research by Visser[15]and the undertow wave flume research by Ting and Kirby[16]are used for the model validation. The major computation parameters in the coupled model can be checked in Xu[14]. In these computations, the bottom friction has not been taken into account, other parameters are the default parameters of the SWAN.
The comparison between the coupled model and the wave flume studies are shown in Fig.1 (WHis the wave height, WDis the wave direction, Wvis the water velocity, Dfis the distance in the flume) and Fig.2 (Wsis the wave setup, RWD is the relative water depth in vertical). It is shown that the model results are in fairly good agreement with the wave flume studies, however, the velocity at the bottom is still underestimated at the undertow in the flume studies.
The application of the depth-dependent radiation stress formula in the model may improve the accuracy of the undertow simulation. But except the momentum flux, the undertow is also determined by the wave-induced turbulence, and the bed roughness on the waveflow boundary layer. Therefore, more studies and tests are required to concisely describe these dynamic processes in the 3-D model.
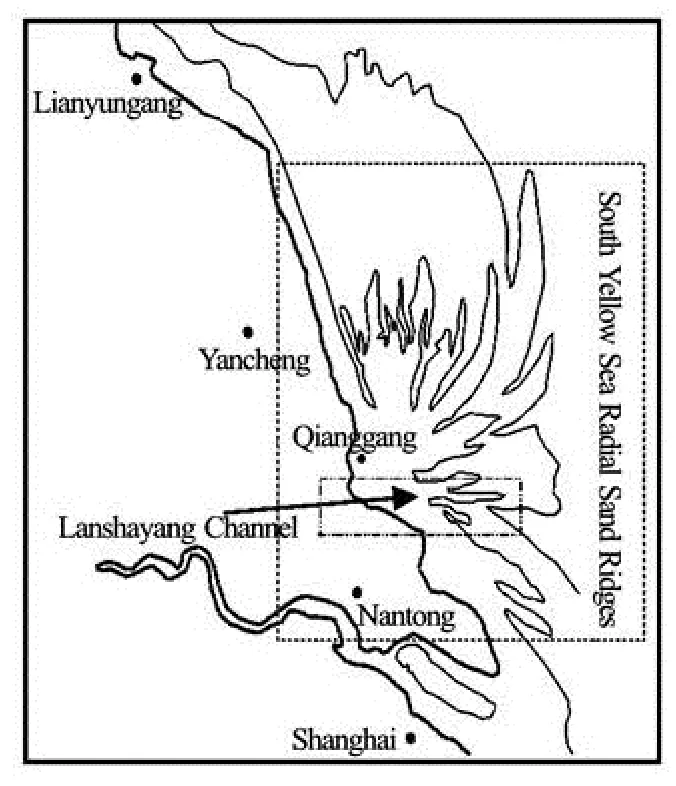
Fig.3(a) The location of the radial sand ridges
However, the aim of this paper is to estimate the wave-induced current in the SYSRSR. Adding the radiation stress on the top layer of the water body is enough for such a purpose. The wave-induced currentmodel will be used to compare different formula of the depth-dependent radiation stress, the roller effects and the bed roughness in the wave-flow boundary layer in our further study.
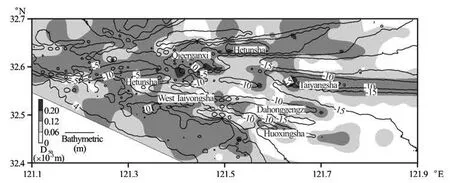
Fig.3(b) The sediment distribution and terrain characteristics of the LSYC

Fig.4 The bathymetric changes in LSYC during “Matsa”[2]
3. The study area and model’s major parameters
3.1An introduction of the model area
The LSYC is located in the southern part of the SYSRSR (Fig.3(a)), with a complex terrain (Fig.3(b)). In the north, the sand ridges like Leyusha, Qieerganzi, and Qieeryezi separate the LSYC from the Huangshayang channel. In the south, the West Taiyangsha (WTYS), Huoxingsha (HXS) and Dahonggengzi (DHGZ) divide the LSYC into three sub channels. In east, the WTYS and Hetunsha (HTS) are at the entrance of the LSYC. It has irregular semidiurnal tides, and the tidal range is quite large, the average tidal range is 4.61 m (field survey from October, 1996, October, 1997). The tidal current is quite large, and the maximum current happens at the MWL. During the spring tide, the whole tidal averaged velocity is 1.09 m/s, and the maximum tidal current is 1.82 m/s (field survey in May, 2005).

Fig.5 Model area and space step
The waves in the LSYC channel are mixed waves. In normal days, the waves are small. But under the typhoon influence, the typhoon waves will emerge. During the “Winnie” typhoon, the maximum U10is 23.4 m/s at 23:00, August 18, 1997, the wind directionis ENE, and meanwhile the largest Hsis 4.2 m, the corresponding average wave period T is 6.0 s, the wave direction is NE.
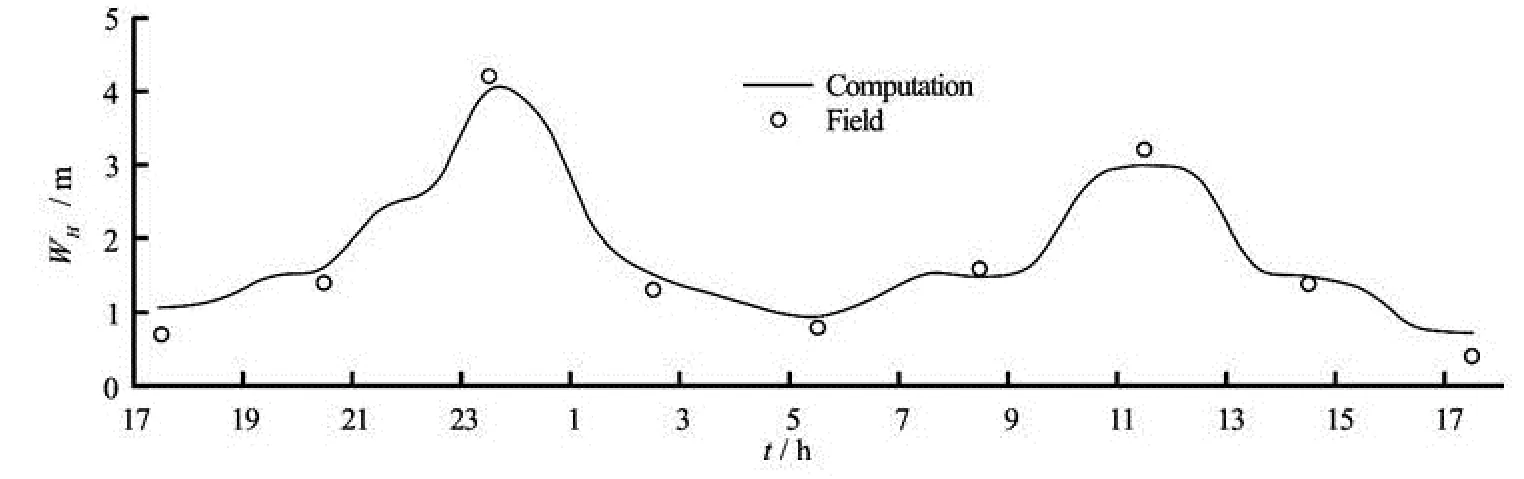
Fig.6 Wave height validation
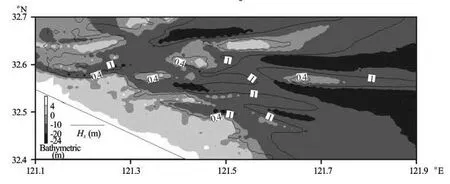
Fig.7 Significant wave height distribution in the LSYC under “Winnie” at LWL (black line indicates contour line of Hs, Grayscale bar is bathymetric changes (theoretical depth datum, similar in Figs.8-9)).
The bottom materials are very fine sand and mud in the area deeper than -5 m (theoretical depth datum or LLWL), in the area shallower than -5 m is fine sand. N and ESE direction waves of the 50 years return period can have an incipient bottom sediment of between -6 m--11 m and induce serious ridge erosions and channel depositions in the WTYS area[2].
The bathymetric changes caused by the “Matsa”typhoon in the WTYS are an excellent instance of the ridge erosion and channel deposition (Fig.4). During the “Matsa” typhoon, in the northern part of the WTYS a strong erosion appears in the area shallower than –5 m, the largest erosion around 1 m-2 m happens between -1 m--3 m. Meanwhile, a larger deposition appears in the deep channel on the north side of the WTYS. Moreover, the west neighboring area of the northern part of the WTYS also sees a strong deposition, and the maximum deposition is near 1 m-2 m, but this area is small.
3.2Parameters and model area
The range of the surge model covers nearly the whole South Yellow Sea. The grid is refined in the LSYC channel where the space resolution is around 100 m (Fig.5), the time step is 15 s. The terrain data come mainly from two parts, one is obtained in the years 2005-2006, the field survey in the SYSRSR and the neighboring area, the other is the 1979 coast map, and they all are adjusted to the mean sea level.
The air pressure and wind field data are provided by the NCEP FNL model (space resolution 1° ×1°, time step 6 h, 10 m below the water level). These data are further interpolated based on the field survey in the LSYC. UA10=0.001225 when U10=7 m/s , and UB10=0.002425 when U10=25 m/s , both are the de-fault values of the MIKE21. The bottom roughness is computed by the Manning formula, and the Manning numbers are 0.015 in both U and V directions. The tidal wave boundary is provided by the East China Sea tidal wave model[17].
Traditionally, the constant wave friction coefficient is applied in the wave model. But more and more studies show that the wave friction coefficient varies in space and is time-dependent e.g., Arora and Bhaskaran[18]suggested that the wave friction coefficient is a variable, related with the tidal motion.
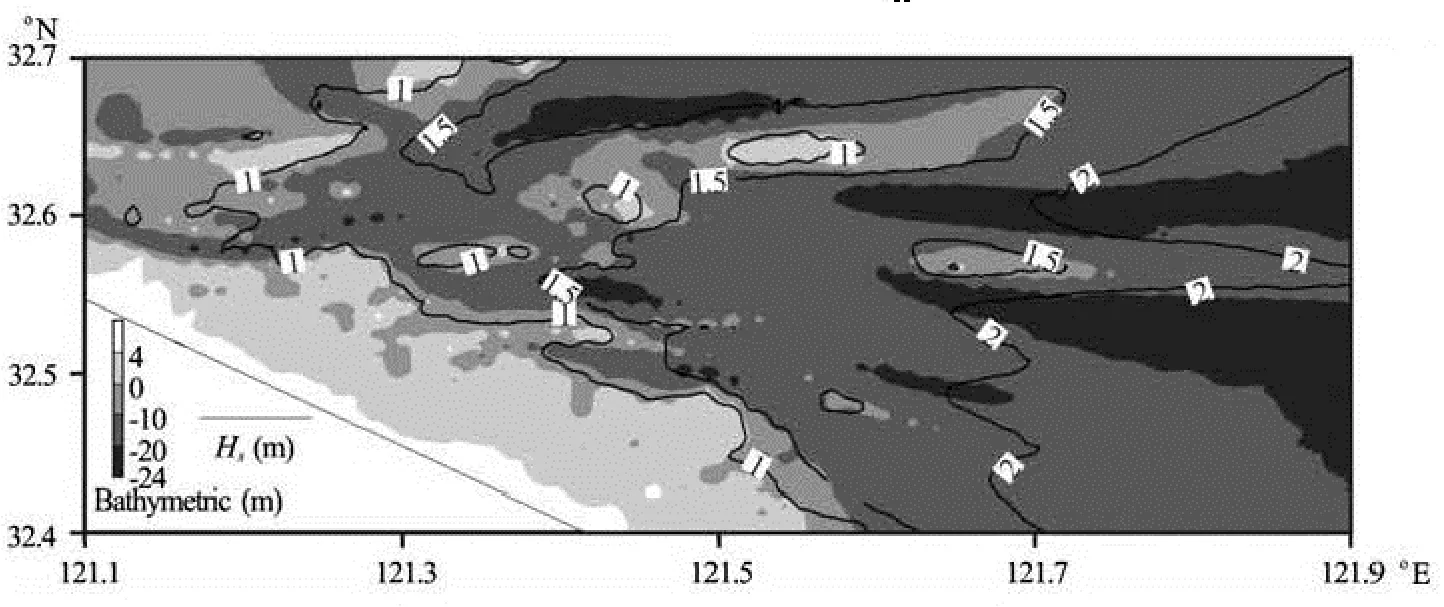
Fig.8 Significant wave height distribution in LSYC under “Winnie” at MWL

Fig.9 Significant wave height distribution in LSYC under “Winnie” at HWL
In our study area, the bottom materials at the channel are mud. Under the moderate wave condition (significant wave height Hs: 1 m-1.5 m), the mud layer at the bottom will keep a certain thickness[19]. It can be inferred that the mud damping will happen and the wave energy will be significantly damped. Under the“Winnie” typhoon, the measured Hsis moderate at the MWL and the LWL. Thus, it is necessarily to consider the mud damping effects in the model.
However, in the SWAN-MUD module, the thickness, the viscosity and the density of the mud layer have to be set, which is not an easy task for the applications in a real situation. Herein, the Collins module, which was originally applied under the rigid bed condition, is extended to the mud area. And the Collins coefficient for the mud damping computation is around 1. The detailed discussions are made in Xu[14]. The breaking coefficient in the typhoon wave model is 0.78. Other parameters are the default values in the SWAN. Figure 6 shows the original field data and the model results (t is the “9711” typhoon influence time).
4. Results
4.1Characteristics of “Winnie” typhoon wave in LSYC
At the LWL and the MWL, the waves in the LSYC are generally small (Figs.7-8), with Hsbeing less than 1.5 m. It seems that the waves are effectively damped in the outer area of the channel, which is also covered by mud[11], thus, the incident wave is not strong at the entrance of the LSYC at the LWL and the MWL.
Due to the small water depth at these stages, the waves mainly propagate along the deep channel to the near shore tidal flat or from the channel to ridges. The contour lines of the wave height are therefore close to the terrain undulation. At the LWL, 1.0 m contour line of Hsis close to that of -5 m, at the MWL, 1.5 m contour line of Hsis close to that of -5m. Because the Collins coefficients are identical in the whole computation area at each time step[14], the bottom dissipation may be overestimated in the shallow area, and therefore, the computed wave height may be underestimated in these areas at the LWL and the MWL.
But at the HWL, the wave is considerably larger (Fig.9). Due to a larger water depth, the wave in the outer area of the channel is quite high and Hs> 5 m . Therefore, the mud damping effects may gradually disappear in the whole area, only the bed friction needs to be considered. Meanwhile, the wave propagates along both the channel and ridges which are already covered by the seawater except a few larger rid-ges i.e., Hetunsha, Qieerganzi and Taiyangsha, thus most contour lines of the wave height are across ridges and channels. After continuous diffractions and refractions, the wave direction near the WTYS is NE. 4 m and 3.5 m contour lines ofHsare across the WTYS and 3.5 m contour lines ofHsacross the Leyusha. This might induce a large amount of sediment incipient in the shallow area of ridges.
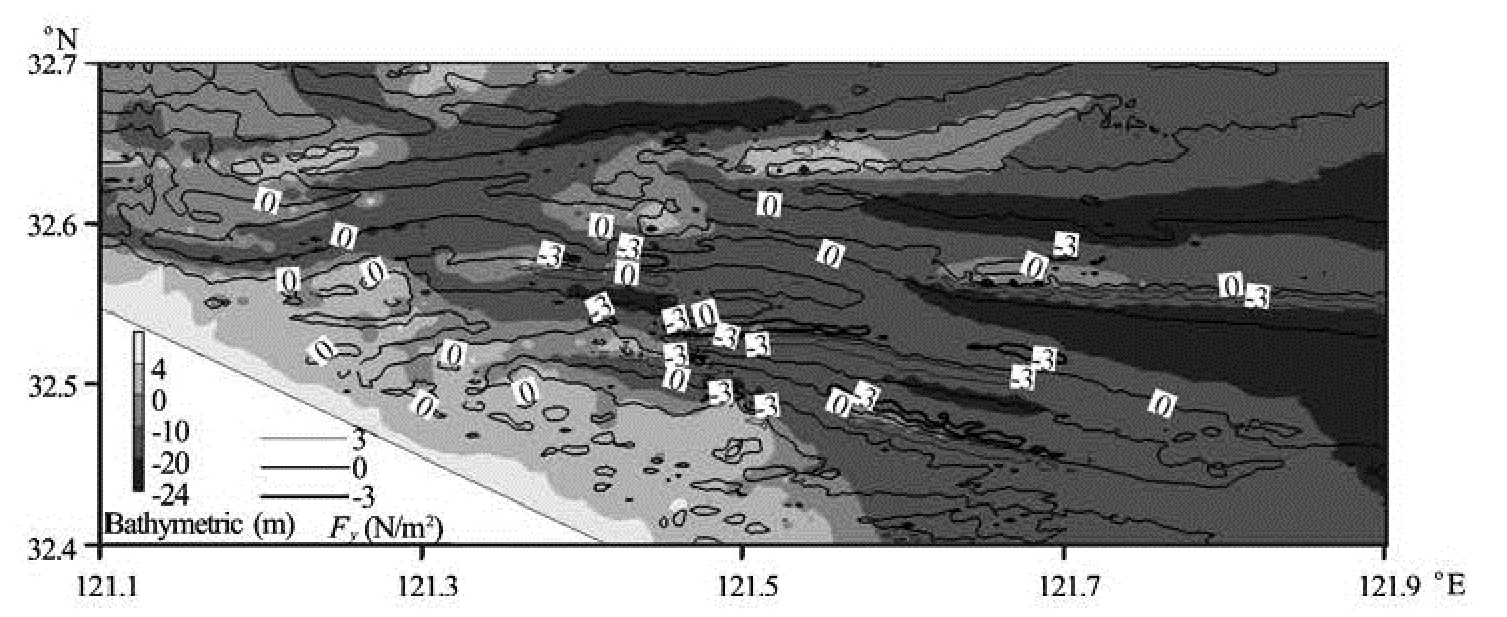
Fig.10(a) Distribution of radiation stress gradient inYdirection under “Winnie” at HWL (black lines indicate contour line of gradient of shear stress, Grayscale bar is the bathymetric changes (theoretical depth datum, similar as Fig.10(b))

Fig.10(b) Distribution of the gradient radiation stress inXdirection under “Winnie” at HWL
4.2The gradient of radiation stress emergence along the both sides of ridges at HWL
The depth-averaged radiation stress will help to judge the existence of the wave induced current. In a mud coast, the wave is usually weak under the normal weather conditions. That is the major reason why there is no direct observation of the wave induced flow in the mud coast. However, in the SYSRSR, with big waves emerging, a strong radiation stress gradient will emerge along both sides of the sand ridges between -5 m--10 m at the HWL. It seems that the gradient of the radiation stress is close to 0 in the area deeper than -10m (Fig.10(a), Fig.10(b)).
Due to the incident wave direction and the wave breaking effects, the gradient of the radiation-stress on the northern side of the sand ridges is positive, meanwhile it is negative on the southern side. In the WTYS, the gradient of the radiation stress inX-direction assumes a discontinuous-point form distribution, with its absolute value larger than 2 N/m2, and the gradient of the radiation stress inY-direction distributes along the sand ridges, with its absolute value larger than 3 N/m2. Especially, in the northern salient area of the WTYS, the gradient of the radiation stress in bothX,Ydirections are quite large (Fig.10(a), Fig.10(b), inside the black dash line).
4.3Temporal and spatial variations of wave induced current
Figure 11 is an eclipse of the velocity vector graph during a typhoon. In this figure, the black eclipse of the velocity vector includes the wave-induced current and the tidal current, and the gray eclipse of the velocity vector only includes the tidal current.
During a typhoon, if the wave-induced current is not taken into account, the current will be considerable small at the HWL in the study area. But if the wave-induced current is taken into account, the situation might be different. The current vectors will be totally changed at the HWL in the shallow area (Fig.11), in other stages, the current vectors change but a little. The WTYS area is an excellent example. Once thewave-induced current is considered, the current direction at the HWL significantly changes to point northwestward and the current velocity increases to around 1 m/s in the shallow area of the ridges. Such current velocity is as great as the magnitude of the tidal current during flooding and ebbing.
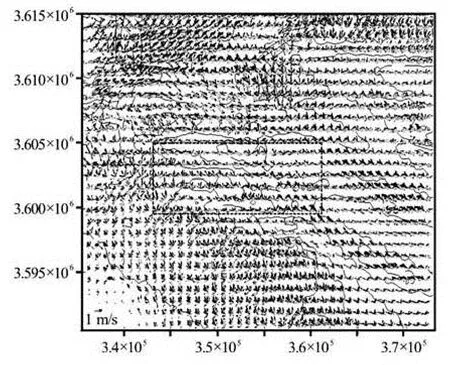
Fig.11 The influence of wave-induced current under “Winnie”(Gray vector is the case without considering the waveinduced current, black vector is the case with the considerations the wave-induced flow, black dash line indicates WTYS, HXS and DHGZ areas, the same as Fig.12)
5. Discussions
5.1The wave-induced current on the shallow ridges similar to the long-shore current
It seems that the wave-induced current at the HWL in the shallow area have two different motion trends correlated to the local morphological characteristics of the sand ridges (Fig.12).
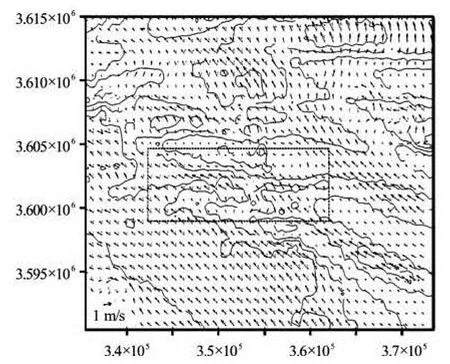
Fig.12 The bottom wave-induced flow under “Winnie” at HWL
As one motion trend, the wave-induced current at the shallow area of the ridges moves along the ridge, and finally disappears at the near-shore shallow flat which connects the land and the ridges. The wave induced current in the WTYS is a good example (Fig.12). In the WTYS area, the incident wave direction is NE, the direction of the ridge is east-west and the ridge connects with the land. Thus, the wave induced current in this area is the long-shore current.
In the DHGZ and the HXS (Fig.12), the situation is different. These two ridges do not connect with the land. At the beginning, the wave-induced current moves along the ridges. At the end of the ridges, the flow keeps moving toward the neighboring channel and finally disappears in this channel. It seems that the inertia effects induce such a motion trend. Thus, this wave-induced current is still a long-shore current.
Due to the bottom friction, the current may change its velocity and direction a bit in different layers (Fig.12). Compared to the top layer, the velocity at the bottom layer is smaller, but is still close to 1 m/s. However, because the depth variation of the radiation stresses is not considered in this study, the current velocity in the bottom layers may be underestimated especially in the area near the wave breaking zone. But the characteristics of the wave-induced current as a long-shore current will not change.
5.2 The wave induced current is one of the driven force for sediment transport between ridges and channels
In normal days, the wave is small in the SYSRSR, and the wave-induced current is too small and is ignored in observations. At the MWL, the tidal current is high, and directly affects the sediment transport. But at the HWL, the tidal current is small and has little influence. Under a typhoon, the situation changes.
Without doubt, the sediment on the shallow ridges will be largely incipient under a big wave at the HWL. Without the wave-induced current, the tidal current at the HWL is small, thus the potential of the sediment transport is also small. In fact, the magnitude of the wave-induced current at the HWL is similar to the flooding and ebbing current. It means that at the MWL and the HWL, the current velocity in the shallow areas of the ridges will be around 1 m/s for almost 6 h under a typhoon. Both the potential and the time of the sediment transport between ridges and channels largely increase.
Thus, the wave-induced current is one of the driven force for the sediment transport between ridges and channels, and very important for the ridge erosion and channel deposition.
5.3The ridge erosion and channel deposition caused by “Matsa” is an indirect proof for the existence of wave-induced flow
Although, no direct observed data can support the existence of the wave-induced current. But, the si-mulation results can provide a proof by the ridge erosion and channel deposition caused by the “Matsa”(Fig.4).
In Fig.4, two strong deposition areas are consistent with the motion routes of the wave-induced current mentioned above. One deposition area is the west neighboring area of the northern part of the WTYS. The deposition is mainly from the suspending coarse sediment carried by the wave-induced current. The sediment is originally incipient in the wave breaking zones (the northern part of the WTYS). Due to the large settling velocity, the coarse sediment firstly deposits in this neighboring area, and this kind of deposition is not large. Due to the strong turbulence induced by the wave, the muddy sediments which cannot easily flocculate only have a small settling velocity and cannot deposit.
The other strong deposition area is in the deep channel near the northeastward side of the WTYS. The deposited sediment in this area has two major sources. One is the suspending muddy sediments originally incipient in the shallow area of the WTYS, and they are successively transported with the wave induced current and the ebbing current, and finally deposited in this area. The other is the incipient sediment in the shallow area of the DHGZ and the HXS by typhoon waves. These suspended sediments move to the neighboring deep channel directly with the wave induced current and its inertial flow.
Therefore, the channel deposition and ridge erosion under a storm can be considered as an indirect proof of the existence of the wave induced current.
6. Conclusions
(1) The time-dependent Collins coefficient with the water level method (TCL) are applied to build a 3-D storm-surge-wave coupled model to simulate the hydrodynamic changes of the Lanshayang Channel (LSYC) in the South Yellow Sea Radial Sand Ridges (SYSRSR) caused by the "Winnie" typhoon.
(2) According to the simulation results, the waveinduced current emerges at a high water level (HWL) and has significant temporal and spatial characteristics correlated with the morphological characteristics of the ridges in the SYSRSR. At the HWL, the wave-induced current emerges in the ridges area shallower than -5 m, the current velocity and direction are then changed. The current velocity will be around 1 m/s, which is consistent with the magnitude of the tidal current during flooding and ebbing. Meanwhile, the near bottom current velocity is also near 1 m/s.
(3) The morphological characteristics of the sand ridges may determine different motion trends of the wave-induced current. In the ridges connected to the land, the wave-induced current will move along the ridges and disappear in the connecting area of the ridges and the shallow tidal flat. And the wave-induced current in the ridges offshore will directly influence the neighboring deep channel. Both of these two wave-induced currents are similar to the long-shore currents.
(4) The motion route of the wave-induced current at the HWL is consistent with the sediment deposition in the deep channel during the “Metha”. Thus, the ridge erosion and the channel deposition during the“Metha” is an evidence to support the suggestion that the wave induced current is enhanced by the storm.
(5) The wave-induced current may be one of the driven force for the ridge erosion and channel deposition. These conclusions will help understanding the morphological changes in the SYSRSR and other complex bathymetric area.
[1] Van RIJN L. C. Coastal erosion and control[J]. Ocean and Coastal Management, 2011, 54(12): 867-887.
[2] LU P. D., DOU X. P. Hydrodynamics research and application of the Radial Sand Ridge in South Yellow Sea, China[C]. The 6th International Conference on Asian and Pacific Coasts. Hong Kong, China, 2011, 43-51.
[3] WANG P., EBERSOLE B. A. and SMITH E. R. et al. Temporal and spatial variations of surf-zone currents and suspended sediment concentration[J]. Coastal Engineering, 2002, 46(3): 175-211.
[4] HILL H. W., KELLEY J. T.and BELKNAP D. F. et al. The effects of storms and storm-generated currents on sand beaches in Southern Maine, USA[J]. Marine Geology, 2004, 210(1-4): 149-168.
[5] DRØNEN N., DEIGAARD R. Quasi-three-dimensional modeling of the morphology of longshore bars[J]. Coastal Engineering, 2007, 54(3): 197-215.
[6] CHRISTENSEN E. D., WALSTRA D. and EMERAT N. Vertical variation of the flow across the surf zone[J]. Coastal Engineering, 2002, 45(3-4): 169-198
[7] XIE M. Establishment, validation and discussions of a three dimensional wave-induced current model[J]. Ocean Modeling, 2011, 38(3-4): 230-243.
[8] XIE Ming-xiao. Three-dimensional numeral modeling of the wave-induced rip currents under irregular bathymetry[J]. Journal of Hydrodynamics, 2012, 24(6): 864-872.
[9] LIN P., ZHANG D. The depth-dependent radiation stresses and their effect on coastal currents[C]. Proceedings of the 6th International Conference of Hydrodynamics: Hydrodynamics VI Theory and Applications. Perth, Australia, 2004, 247-253.
[10] KUMOR N., VOULGARIS G. and WARNER J. C. Implementation and modification of a three-dimensional radiation stress formulation for surf zone and ripcurrent applications[J]. Coastal Engineering, 2011, 58(12): 1097-1117.
[11] MELLOR G. Wave radiation stress[J]. Ocean Dynamics, 2011, 61(5): 563-568.
[12] XIE Ming-xiao. Three dimensional modeling of current and sediment transport for muddy coasts coupling with waves and tidal flow[D]. Doctoral Thesis, Nanjing, China: Hohai University, 2010(in Chinese).
[13] ZHANG Chang-kuan, ZHANG Dong-sheng and ZHANG Jun-lun et al. Tidal current-induced formation-strom-induced change-tidal current-induced recovery-interpretation of depositional dynamics of formation and evolution of radial sand ridges on the Yellow Sea seafloor[J]. Science in China: Series D, 1999, 42(1): 394-402.
[14] XU Zhuo. Modeling the wave-flow environment under the typhoon in the Lanshayang Channel of the South Yellow Sea Radial Sand Ridges[D]. Doctoral Thesis, Nanjing, China: Hohai University, 2014(in Chinese).
[15] VISSER P. J. Laboratory measurements of uniform longshore currents[J]. Coastal Engineering, 1991, 15(5-6): 563-593.
[16] TING F .C. K., KIRBY J. T. Observation of undertow and turbulence in a laboratory surf zone[J]. Coastal Engineering, 1994, 24(1-2): 51-80.
[17] CHEN Ke-feng, WANG Yan-hong and ZHENG Jin-hai et al. Effects of coastline changes on tide system of Yellow Sea off Jiangsu Coast, China[J]. China Ocean Engineering, 2009, 23(4): 741-750.
[18] ARORA C., BHASKARAN P. K. Parameterization of bottom friction under combined wave-tide action in the Hooghly estuary, India[J]. Ocean Engineering, 2012, 43: 43-55.
[19] GRATIOT N., GRADEL A. and ANTHONY E. J. Trade-wind waves and mud dynamics on the French Guiana coast, South America: Input from ERA-40 wave data and field investigations[J]. Marine Geology, 2007, 236(1-2): 15-26.
10.1016/S1001-6058(14)60097-4
* Project supported by the National High Technology Research and Development Program of China (863 Program, Grant No. 2012AA112509), the National Natural Science Fundation of China (Grant No. 41373112).
Biography: XU Zhuo (1980-), Male, Ph. D.
ZHANG Wei,
E-mail: zhangweihhu@vip.sina.com
猜你喜欢
杂志排行

水动力学研究与进展 B辑的其它文章
- Non-spherical multi-oscillations of a bubble in a compressible liquid*
- Wind-wave induced dynamic response analysis for motions and mooring loads of a spar-type offshore floating wind turbine*
- Theoretical and experimental studies of the transport process of micro-particles in static water*
- Experimental study of flow field in interference area between impeller and guide vane of axial flow pump*
- An analysis of dam-break flow on slope*
- Performance of the bio-inspired leading edge protuberances on a static wing and a pitching wing*