单分散PtNi纳米粒子特殊的红外光学性能
2014-02-18周新文杜娟娟孙世刚
周新文 杜娟娟 孙世刚
(1三峡大学生物与制药学院,湖北宜昌443002;2厦门大学固体表面物理化学国家重点实验室,化学化工学院化学系,福建厦门361005)
1 Introduction
Platinum-nickel(PtNi)alloy nanoparticles have a potential application in high density data storage1and are used as anode catalysts and cathode catalysts in fuel cell.2For example,PtNi nanoparticles were frequently used as an anode catalyst for electrooxidation of methanol in direct methanol fuel cell(DMFC),3,4and as a cathode catalyst for electro-reduction of oxygen.5,6These electrocatalytic properties are highly dependent on the size,shape,and composition of the PtNi nanoparticles.Geometry of a nanomagnet has great impact on its magnetic properties resulting from the interplay among different types of magnetic energies.Then syntheses of PtNi nanoparticles with controllable mor-phology and composition are crucial for progress in this field of data storage,fuel cell and so on.
Until now,rod-shaped superparamagnetic PtNi nanoalloy and PtNi/C nanoparticles have been synthesized through different methods.7,8Weller and coworkers9have reported the synthesis of NixPt1-xnanoparticles with tunable composition and size by a hot organometallic synthesis,but the method needs a high temperature and expensive poisonous reactants.PtNi hollow spheres prepared by a template-replacement route as catalysts for hydrogen generation from ammonia borane have been investigated by Chenet al.10This method consists of the removal of the template after the synthesis,which may destroy the structure of the products.Except for the above synthetical methods,glvanic displacement reaction is a special template method,in which one substance is served as a suitable sacrificial template and reacts with other appropriate metal ions according to their different standard reduction potentials,resulting in the controlled formation of nanomaterials.11-13Bai and coworkers12have reported the synthesis of Pt hollow nanospheres using Co nanoparticles as a sacrificial template.Co@Pt nanoalloy,14hollow superparamagnetic CoPt nanospheres,15and necklace-like noble-metal hollow nanoparticle chains(Au,Pd,Pt)16were also prepared using the similar method.The galvanic displacement reaction has also been used for the synthesis of PtNi nanoparticles with a hollow structure.17,18
The adsorbed molecules on thesenanomaterials′surfaces yield anomalous IR features named the abnormal IR effects(AIRES),19enhanced IR absorption(EIRA),20and the Fano-like IR effects.21,22Further investigation has showed that nanostructured Ni,Co thin film and CoPt nanorods also display anomalous IR properties.23-25It is important to note that the study of anomalous IR properties of nanomaterials with different morphologies and composition is of great importance in revealing the fundamentals of nanomaterials.26
In this paper,we report the synthesis of PtNi nanoparticles by galvanic displacement reaction.Electrocatalytic and IR optical properties are studied in detail.The results ofin situIR spectra show that the adsorbed CO on monodispersed PtNi nanoparticles exhibit characteristics of bipolar IR feature with a strong enhancement.
2 Experimental
2.1 Prepration of PtNi nanoparticles
All chemicals used in this experiment were analytical grade and were used without further purification.The growth of the PtNi nanoparticles was carried out in a solution-phase system reported in the literature.17In brief,9.5 mg NiCl2,60 mL H2O,and 100 mg poly(vinylpyrrolidone)(PVP)were mixed in a three-necked flask equipped with a heat controller.The mixture was kept at 75°C with vigorous stirring.Then,25 mL of 0.01 mol∙L-1freshly prepared NaBH4solution was added dropwise.The solution turned dark,indicating the formation of Ni.Once the NaBH4is completely dropped into the solution,20 mL of 4 mmol∙L-1K2PtCl6was added dropwise.To avoid oxidation of the Ni nanoparticles,high-purity N2was bubbled into the solution during the whole procedure.The obtained black solution was stirred for 2 h at the constant temperature of 75°C and cooled to room temperature.The obtained PtNi nanoparticles were separated,washed thoroughly,and redispersed in Millipore H2O for following studies.
Transmission electron microscopy(TEM)images were obtained on instruments of JEM-100CX-II electron microscopy.
2.2 Electrochemical in situ FTIR spectroscopy
Glassy carbon(GC)electrode,polycrystalline Pt(bulk Pt)electrode,and polycrystalline Au(bulk Au)electrode were polished mechanically using sandpaper and alumina powders of sizes 5 and 1 μm down to 0.3 μm to obtain a clean electrode surface.A prescribed quantity of suspension of PtNi nanomaterials was applied to the surfaces of GC and Au electrodes,upon which a drop of 0.5%(V/V)Nafion solution was dispersed to fix the nanomaterials on the surface.The electrodes thus prepared are denoted as PtNi/GC and PtNi/Au electrodes,respectively.The cyclic voltammetric(CV)studies were carried out with a CHI631C electrochemical work station(CH instruments,Inc.),at a potential scan rate 50 mV∙s-1.Electrochemical experiments were carried out in a standard three-electrode cell at room temperature.The counter electrode was a Pt flake and reference electrode was a saturated calomel electrode(SCE).
The IR optical properties of the PtNi nanomaterials were studied and CO was selected as a probe molecule.The multistep FTIR(MS-FTIR)procedure27was used in the present study.In brief,a series of single-beam spectra were collected first at sample potentials(ES),where adsorbed CO is stable,and a single-beam spectrum was collected finally at the reference potential(ER),at which adsorbed CO has been removed completely by electrooxidation.In ourin situFTIR measurements,the reference potential(ER)was setted as 1.2 V,the sample potentials were setted as-0.2,-0.1,0.0,0.1,0.2,and 0.3 V based on the results of CO oxidation on PtNi/GC electrode.The resulting spectra were calculated using the following equation:

whereR(ES)andR(ER)are single-beam spectra of reflection collected at sample potentialESand reference potentialER,respectively.Each single-beam spectrum was recorded by collecting and co-adding 400 interferograms at a spectral resolution of 8 cm-1.In situFTIR spectroscopic measurements were carried out on a Nexus 870 FTIR spectrometer(Nicolet)equipped with an Ever-Glo IR source and a liquid nitrogen-cooled MCT-A detector.A CaF2disk was used as the IR window,and a thin layer of solution was formed by moving the electrode toward the CaF2window during FTIR measurements.
3 Results and discussion
TEM images in Fig.1 illustrate that large-scale monodispersed PtNi nanomaterials have been synthesized.The structural details are revealed in high-magnification TEM images.The PtNi nanomaterials are solid,spherical,and highly monodispersed with an average diameter of about 52.2 nm.
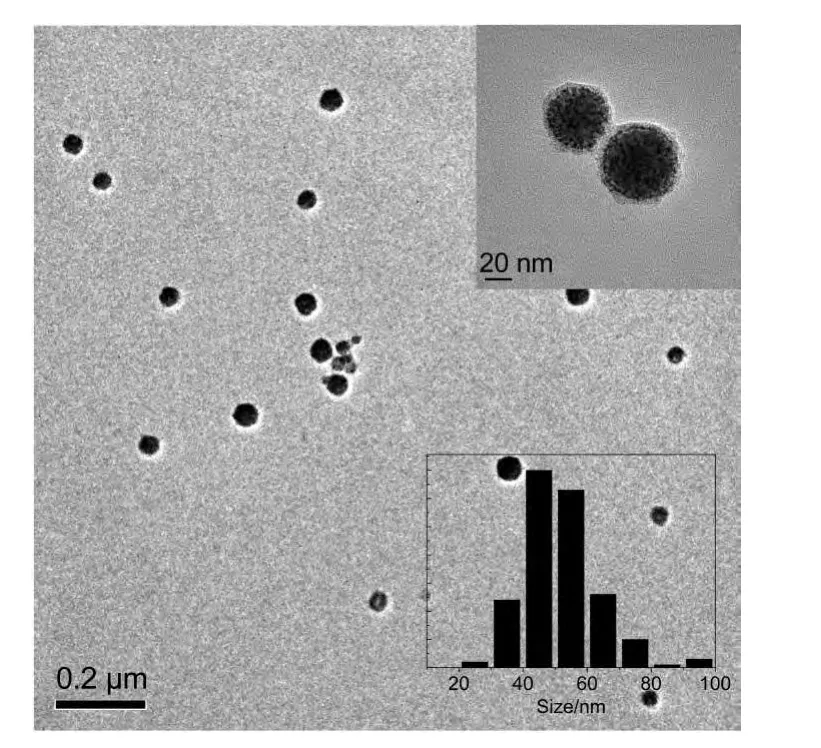
Fig.1 TEM images and the size distribution of PtNi nanoparticles
Fig.2 shows the cyclic voltammograms of adsorbed CO oxidation on the PtNi/GC electrode in 0.1 mol∙L-1H2SO4solution.It can be seen that the hydrogen adsorption-desorption current is completely suppressed when the electrode surface is covered with CO.The onset potential of CO oxidation is measured at about 0.12 V,and the main oxidation current peak appears around 0.51 V.It is worthwhile to note that,under the same conditions,the onset potential of CO oxidation on PtNi/GC electrode has been shifted negatively by 300 mV in comparison with that on bulk Pt,and the peak potential(Ep)on PtNi/GC electrode has been shifted negatively by 75 mV referring to the value measured on bulk Pt.In the reverse scan,a reduction current peak of Pt oxide is recorded at 0.36 V.The results demonstrated that the PtNi nanomaterials exhibit better electrocatalytic properties for the CO oxidation in 0.1 mol∙L-1H2SO4solution than bulk Pt does.
Fig.3 shows the MS-FTIR spectrum of CO adsorbed on the PtNi/GC and bulk Pt electrodes in 0.1 mol∙L-1H2SO4solution.The negative-going band around 2072 cm-1is assigned to IR absorption of linearly bonded CO(COL).Except for the band of COL,a positive-going band located near 2341 cm-1is ascribed to IR absorption of CO2species that are uniquely derived from the oxidation of adsorbed CO2(COad)atER,because no CO2and CO species presented initially in solution inside the thin layer between the electrode and IR window.It is necessary to note that the IR band of COadon a bulk Pt electrode always appears in the opposite direction to the CO2band under the same conditions,which is in accordance with the predication of Eq.(1),which shows that the adsorbed CO on bulk Pt electrode exhibits a normal IR adsorption.25From the results of Fig.3,we can see that the IR features of PtNi nanoparticles are different from those of COadon the bulk Pt electrode and shown a typical IR features of AIREs,19,25which have three distinct anomalous features:(1)the inversion of the direction of adsorbed CO;(2)the significant enhancement of IR absorption;and(3)the broadening of the width of adsorbed CO bands.
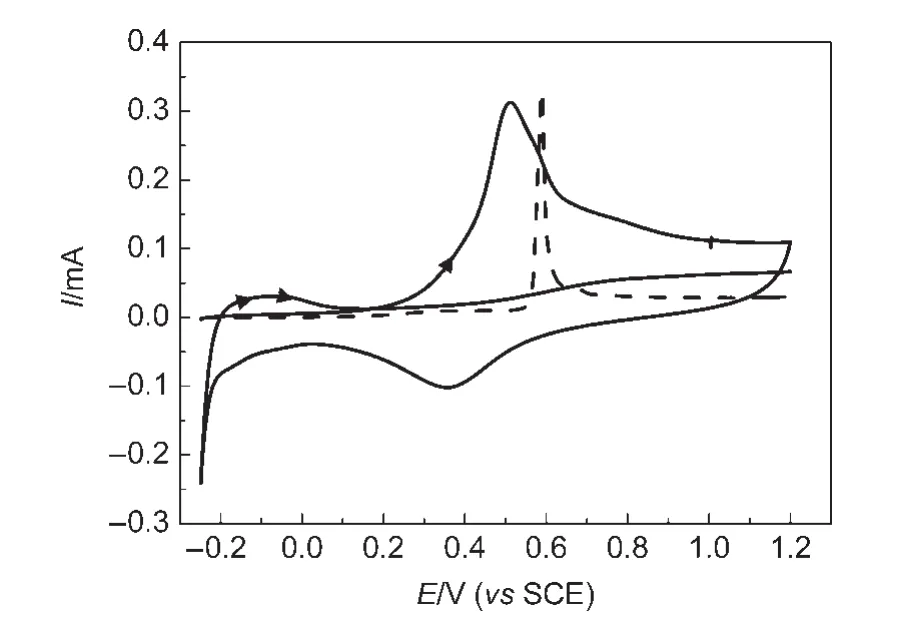
Fig.2 Cyclic voltammograms of adsorbed CO oxidation on the PtNi/GC(solid line)and bulk Pt(dash line)electrodes in 0.1 mol∙L-1H2SO4solution with a scan rate of 50 mV∙s-1
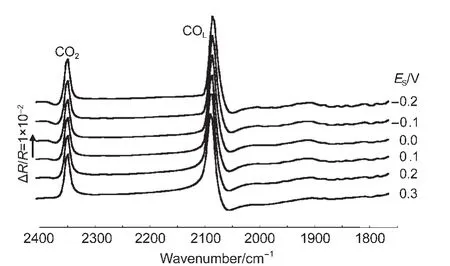
Fig.3 In situ FTIR spectra of CO adsorbed on NiPt/GC electrode in 0.1 mol∙L-1H2SO4solution
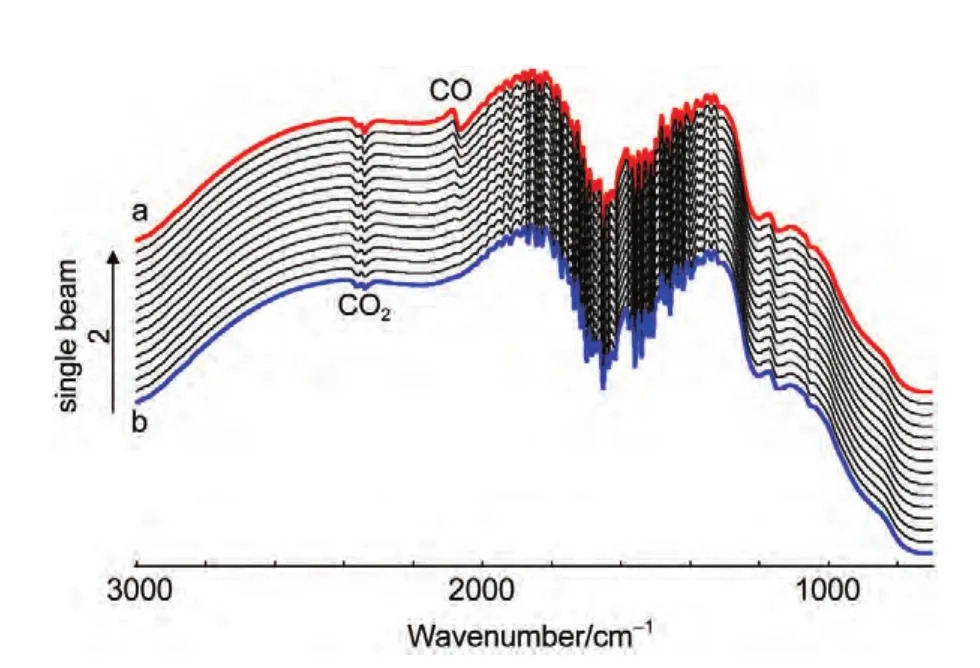
Fig.4 In situ single-beam spectra of reflection collected at ER
In thein situFTIR spectroscopic measurements,we have emphasized that the adsorbed CO will be removed completely by electrooxidation at reference potential(ER=1.2 V).Fig.4 shows thein situsingle-beam spectra of reflection collected at reference potential.In Fig.4(line a),a bipolar band near 2100 cm-1is assigned to IR adsorption of COL,which means that the adsorbed CO was not electrooxidized completely at reference potential.So the results obtained from Fig.3,which were calculated from Eq.(1)using the line a in Fig.4 as theR(ER),is questionable.Then we continue collecting the single-beam spectra of reflection atER.At last,the bipolar band near 2100 cm-1was disappeared indicating that the adsorbed CO was electrooxidized completely(line b).Then we can obtain the final resulting spectra using the line b in Fig.4 as theR(ER-2)from Eq.(1)based on the above analyses.Fig.5 shows the finalin situFTIR spectra of CO adsorbed on NiPt/GC electrode in 0.1 mol∙L-1H2SO4solution.TheERis 1.2 V,ESare indicated for each spectrum.The dash line is thein situFTIR spectra of CO adsorbed on bulk Pt electrode obtained under the same condition(ER=1.2 V,ES=0.0 V).For the PtNi/GC electrode,remarkably enhanced symmetric bipolar band with its positive peak near 2050 cm-1and negative band near 2100 cm-1is assigned to IR adsorption of COLadsorbates atESthat is varied from-0.2 to 0.3 V.It is worthwhile to point out that the bipolar band observed in the current studies shows opposite direction in the positive and negative peaks in comparison to our previous studies of nanostructured Co thin films24and shows uniform direction to our previous studies of nanostructured Pt thin films.26The obtained results demonstrate that the bipolar IR feature of the COadbands is a particular IR property of nanostructured materials.
The obtained IR feature is obviously different from the normal absorption on the bulk Pt electrode(Fig.5,dash line).The intensity,directions,and the broadening of the width of COLare different.This kind highly symmetric bipolar IR feature is also different from the Fano-like line shape,which is asymmetric and has been observed in transmission IR spectra of CO adsorbed on smooth iron ultrathin films supported on Mg(001)under ultrahigh-vacuum conditions by Pucci and co-workers.28The Fano-like line shape has also been observed in attenuated total reflectance(ATR)spectra of CO adsorbed on ultrathin film of Pt substrated on silicon under electrochemical conditions29and nanostructured Ni,23Co,24Pt,26and Ru film.30This kind Fano-like asymmetric spectrum was ascribed to the Fano effects,21and interpreted as the non-adiabatic interaction of adsorbate vibrations with electronic excitations by Pucci and co-workers.28
In Fig.5,except for the adsorbed band of COL,a positive-going band located near 2341 cm-1is ascribed to IR absorption of CO2species.The intensity of CO2species adsorbed on PtNi/GC electrode is much more weak than that of bulk Pt electrode.The reasons can be explained as follows.It has been testified that the CO2species derived from COadoxidation can remain in the thin layer solution between the electrode and IR window for a relatively longer time due to large transporting resistance of the dispersion of CO2between the bulk solution and the thin layer.31In our case,the time remains atERon the PtNi/GC electrode is long enough to allow CO2to diffuse from the thin layer to the bulk solution.As a result,the intensity of CO2decreased,which can be seen from the different intensities of IR absorption band of CO2in Fig.5.Except for the band of COLand CO2,the absorption band around 1800-1900 cm-1in Fig.5 is the IR absorption of the existence of a relatively high level of gas water molecules in the beam path due to a poor purging of the spectrometer.
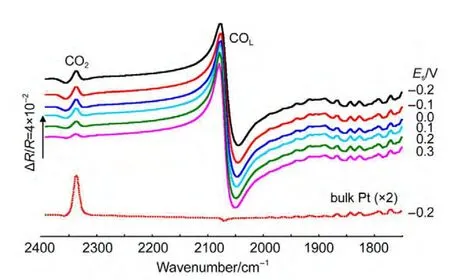
Fig.5 Final in situ FTIR spectra of CO adsorbed on NiPt/GC electrode in 0.1 mol∙L-1H2SO4solution
Except for the directions of COL,we also noted that the intensity of the IR absorption of CO adsorbed on PtNi/GC electrode is significantly enhanced.It is convenient to define an enhancement factor to systematically study this IR property.The quantitative parameter of enhancement factor(ΔIR)is calculated using the following equation:26
WhereACO(Pt)signifies the integrated intensity of COLband measured in the spectrun of bulk Pt electrode,i.e.,the spectrum(dash line)in Fig.5.ACO(PtNi)is the integrated intensity of COLband measured in the spectrum of PtNi/GC electrode.The surface relative roughness(Rr)measured in cyclic voltammetric studies is introduced in Eq.(2)to calibrate the difference of real surface area of PtNi nanoparticles.The enhancement factorΔIRhas been measured on PtNi/GC electrode to be 73.6.The value of the enhancement factor is much greater than others we obtained previously.19,20,23-26It is important to point out that the calculation of enhancement factorΔIRis glancing because it is hard to define the baseline of the bipolar IR feature of the COadbands exactly.But the adsorbed CO shows a strong enhancement,which will be approved clearly from the nextin situsingle beam spectra.
Because the intensity of the IR absorption of CO adsorbed on PtNi/GC electrode is strong enough,we even can observe the optical properties in thein situsingle beam spectra.Fig.6 shows thein situsingle beam spectra of CO adsorbed on NiPt/GC electrode in 0.1 mol∙L-1H2SO4solution atESthat is varied from-0.2 to 0.3 V.It can observe clearly that bipolar band with its positive peak near 2050 cm-1and negative band near 2100 cm-1is assigned to IR adsorption of COLadsorbates.In our previous work,13,19,23-27it is impossible to observe the peaks of adsorbed CO in thein situsingle beam spectra because of their weak enhancement.Then we have to obtain the resulting spectral equation(1)in the former studies.In Fig.6,we observe clearly that either the positive peak or the negative peak of the bipolar COadbands shifts positively and linearly with increasingESdue to Stark effect,19,26which indicated that the COLwas the adsorbed CO molecule,not the CO molecule dissolved in the solution.The Stark tuning rate can be then determined from the plot of the variation of wavenumbers withESin thein situsingle beam spectra in Fig.6.The results are shown in Fig.7.It is interesting to notice that the Stark tuning rate of the positive peak and that of the negative peak of the bipolar COLbands are not equal.The values of the Stark tuning rate were measured as 6.6 and 10.2 cm-1∙V-1for the COLbipolar bands,respectively.The value of the Stark tuning rate is closely correlated with the nanostructured materials,24,26the concentration of electrolyte,32and solution molecule.33When theESis above 0.2 V,the variation of wavenumbers withESclearly deviated from the linear relationship and decreased slightly.This is obviously due to a partial oxidation of CO adsorbed on the PtNi nanoparticles,as also can be elucidated in CV curves(Fig.2).
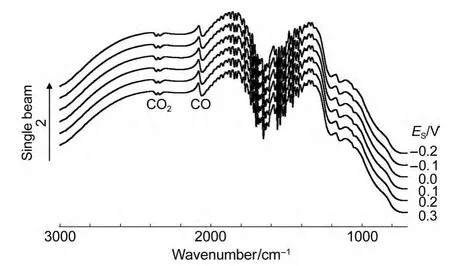
Fig.6 In situ single beam spectra of CO adsorbed on NiPt/GC electrode in 0.1 mol∙L-1H2SO4solution
It is known that the reflectivity of substrate may influence IR optical features.34Glassy carbon is a moderately reflecting substrate,while bulk Au electrode belongs to a high reflecting one.We also studied the IR properties of the PtNi/Au electrode under the same conditions as above.It can be seen that the IR bands of COLand CO2in Fig.8 are appeared in the same direction as those seen in Fig.6,indicating clearly that CO adsorbed on the PtNi/Au electrode also exhibits bipolar IR feature.The values of the Stark tuning rate were measured as 20.1 and 21.8 cm-1∙V-1for the COLbipolar bands,respectively(Fig.9).The results demonstrate that the bipolar IR feature of COadis a particular IR property of PtNi nanoparticles,and that the influence of the substrate materials on the IR spectral features may be neglected in the present study.

Fig.7 Plots of COLband centre versus E for CO adsorbed on NiPt/GC electrode obtained from the single beam spectra
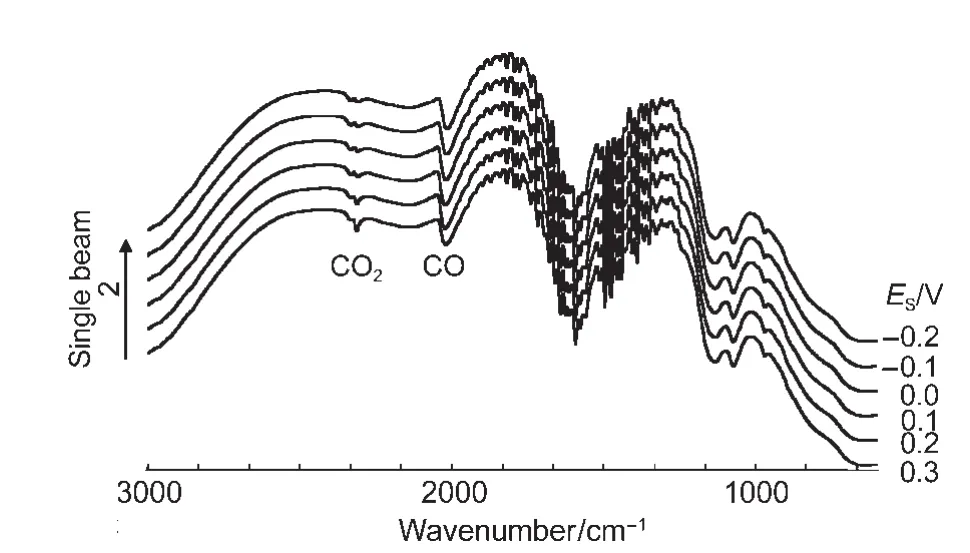
Fig.8 In situ single beam spectra of CO adsorbed on NiPt/Au electrode in 0.1 mol∙L-1H2SO4solution

Fig.9 Plots of COLband centre versus E for CO adsorbed on NiPt/Au electrode obtained from the single beam spectra
A bipolar band of linearly chemisorbed CO with anomalous shape was reported in 1994 in potential-difference FTIR spectra of a basal plane graphite disc covered with Pt particles in a 1.0 mol∙L-1H2SO4+1.0 mol∙L-1aqueous methanol solution.35They explained the anomalous bipolar CO band by a potential-induced migration of chemisorbed CO molecules from terraces at the reference potential to edge or kink sites at the sample potentials.It was assumed that the CO stretching is higher for terraces than for edge or kink sites.Later,Ortizet al.36thought the explanation of the anomalous bipolar bands is simple and should be interpreted by the laws of reflectance,which means that the moderately reflecting substrate(GC)was the origin of the anomalous shape of the bipolar bands.Actually,it has been reported that the anomalous IR properties including surface enhanced IR absorption,Fano-like IR effects,and abnormal IR effects,are strongly correlated to the structure and size of nanomaterials.We have observed the transformation among the three anomalous IR properties from experimental results30,37and provided reasonable theoretical explanations38,39.The strong interaction between the nanoparticles,and the collective interaction between CO adsorbates and the nanoparticles may be the origins of the anomalous IR properties of low-dimensional nanomaterials.It is evident to understand the origins of the anomalous IR properties of lowdimensional nanomaterials,further studies involving not only experimental approaches but also theoretical analysis would be worthwhile.
4 Conclusions
In summary,well monodispersed PtNi nanoparticles were synthesized by the galvanic displacement reaction and chemical reduction.The PtNi alloy nanoparticles are spherical and with an average diameter of about 52.2 nm,which have been approved by the results of TEM.Cyclic voltammetric results demonstrate that the PtNi nanomaterials display a better catalytic property than a bulk Pt for CO oxidation.It has been measured that the current peak potential of COadoxidation on PtNi/GC electrode is shifted negatively by 75 mV in comparison with the value measured on a bulk Pt electrode.In situelectrochemical FTIRs employing CO adsorption as probe reaction demonstrate that the PtNi nanomaterials exhibit characteristics of bipolar IR feature of the COadbands with an enhancement factor(ΔIR)as high as 73.6.The intensity of the IR absorption of CO adsorbed on PtNi nanoparticles is so strong that we can observe and study the asymmetrical bipolar IR spectrum in thein situsingle beam spectra clearly.The substrate materials do not affect significantly the anomalous IR features,as illustrated by the similar anomalous IR features observed for CO adsorbed on both PtNi/GC and PtNi/Au electrodes.These results described in this paper are of importance in controlled-synthesis of nanomaterials and understanding the fundamental of anomalous IR properties of low-dimensional nanomaterials.
(1) Cheng,A.;Holt-Hindle,P.Chem.Rev.2010,110,3767.doi:10.1021/cr9003902
(2) Ghosh,T.B.;Leonard,M.;Zhou,Q.;Disalvo,F.Chem.Mater.2010,22,2190.doi:10.1021/cm9018474
(3) Liu,F.;Lee,J.Y.;Zhou,W.J.Small2006,2,121
(4) Liu,F.;Lee,J.Y.;Zhou,W.J.J.Phys.Chem.B2004,108,17959.doi:10.1021/jp0472360
(5) Jayasayee,K.;Van Veen,J.A.R.;E.Hensen,J.M.;de Bruijn,F.A.Electrochim.Acta2011,56,7235.doi:10.1016/j.electacta.2011.03.043
(6) Hasche,F.;Oezaslan,M.;Strasser,P.J.Phys.Chem.C2012,159,25
(7) Deivaraj,T.C.;Chen,W.;Lee,J.Y.J.Mater.Chem.2003,13,2555.doi:10.1039/b307040a
(8)Mandal,M.;Kundu,S.;Sau,T.K.;Yusuf,S.M.;Pal,T.Chem.Mater.2003,15,3710.doi:10.1021/cm030246d
(9) Ahrenstorf,K.;Albrecht,O.;Heller,H.;Kornowski,A.;Görlitz,D.;Weller,H.Small2007,3,271
(10) Cheng,F.;Ma,H.;Chen,J.Inorg.Chem.2007,46,788.doi:10.1021/ic061712e
(11)Sun,Y.;Wiley,B.;Li,Z.;Xia,Y.J.Am.Chem.Soc.2004,126,9399.doi:10.1021/ja048789r
(12) Liang,H.P.;Zhang,H.M.;Hu,J.S.;Guo,Y.G..;Wan,L.J.;Bai,C.L.Angew.Chem.Int.Edit.2004,43,1540.
(13) Zhou,X.W.;Chen,Q.S.;Zhou,Z.Y.;Sun,S.G.J.Nanosci.Nanothch.2009,9,2392.doi:10.1166/jnn.2009.SE34
(14) Park,J.I.;Cheon,J.J.Am.Chem.Soc.2001,123,5743.doi:10.1021/ja0156340
(15)Vasquez,Y.;Sra,A.K.;Schaak,R.E.J.Am.Chem.Soc.2005,127,12504.doi:10.1021/ja054442s
(16)Zeng,J.;Huang,J.;Lu,W.;Wang,X.;Wang,B.;Zhang,S.;Hou,J.Adv.Mater.2007,19,2172
(17)Zhou,X.W.;Zhang,R.H.;Zhou,Z.Y.;Sun,S.G.J.Power Sources2011,196,5844.doi:10.1016/j.jpowsour.2011.02.088
(18)Wang,J.X.;Ma,C.;Choi,Y.M.;Su,D.;Zhu,Y.M.;Liu,P.;Si,R.;Vukmirovic,M.B.;Zhang,Y.;Adzic,R.R.J.Am.Chem.Soc.2011,133,13551.doi:10.1021/ja204518x
(19) Zhou,X.W.;Gan,Y.L.;Sun,S.G.Acta Phys.-Chim.Sin.2012,28,2071.[周新文,甘亚利,孙世刚.物理化学学报,2012,28,2071.]doi:10.3866/PKU.WHXB201205031
(20) Jiang,Y.X.;Sun,S.G.;Ding,N.Chem.Phys.Lett.2001,344,463.doi:10.1016/S0009-2614(01)00812-0
(21) Fano,U.Phys.Rev.1961,124,1866.doi:10.1103/PhysRev.124.1866
(22) Krauth,O.;Fahsold,G.;Pucci-Lehmann,A.J.Mol.Struct.1999,483,237
(23)Wang,H.C.;Sun,S.G.;Yan,J.W.;Yang,H.Z.;Zhou,Z.Y.J.Phys.Chem.B2005,109,4309.doi:10.1021/jp046313o
(24) Chen,Q.S.;Sun,S.G.;Yan,J.W.;Li,J.T.;Zhou,Z.Y.Langmuir2006,22,10575.doi:10.1021/la0615037
(25)Zhou,X.W.;Zhang,R.H.;Zeng,D.M.;Sun,S.G.J.Solid State Chem.2010,183,1340.doi:10.1016/j.jssc.2010.04.003
(26) Gong,H.;Sun,S.G.;Li,J.T.;Chen,Y.J.;Chen,S.P.Electrochim.Acta2003,48,2933.doi:10.1016/S0013-4686(03)00358-X
(27) Lin,W.F.;Sun,S.G.Electrochim.Acta1996,41,803.doi:10.1016/0013-4686(95)00331-2
(28) Priebe,A.;Fahsold,G.;Pucci,A.Surf.Sci.2001,90,482
(29) Zhu,Y.;Uchida,H.;Watanabe,M.Langmuir1999,15,8757.doi:10.1021/la990835r
(30) Gong,H.;Sun,S.G.;Li,J.T.;Chen,Y.J.;Chen,S.P.Electrochim.Acta2003,48,2933.doi:10.1016/S0013-4686(03)00358-X
(31) Lin,Y.;Sun,S.G.Electrochim.Acta1998,44,1153.doi:10.1016/S0013-4686(98)00218-7
(32) Russell,J.W.;Severson,M.;Scanlon,K.;Overend,J.;Bewick,A.J.Phys.Chem.1983,87,293.doi:10.1021/j100225a024
(33) Kunimatsu,K.;Seki,H.;Golden,W.G.;Golden,J.G.;Philpott,M.R.Surf.Sci.1985,158,596.doi:10.1016/0039-6028(85)90332-2
(34) Pecharromán,C.;Cuesta,A.;Gutiérrez,C.J.Electroanal.Chem.2004,563,91.doi:10.1016/j.jelechem.2003.09.013
(35) Christensen,P.A.;Hamnett,A.;Munk,J.;Troughton,G.L.J.Electroanal.Chem.1994,370,251.doi:10.1016/0022-0728(93)03168-O
(36) Ortiz,R.;Cuesta,A.;Márquez,O.P.;Márquez,J.M.;Méndez,J.A.;Gutiérrez,C.J.Electroanal.Chem.1999,465,234.doi:10.1016/S0022-0728(99)00099-6
(37) Bjerke,A.E.;Griffiths,P.R.;Theiss,W.Anal.Chem.1999,71,1967.doi:10.1021/ac981093u
(38)Wu,C.X.;Lin,H.;Chen,Y.J.;Li,W.X.;Sun,S.G.J.Chem.Phys.2004,121,1553.doi:10.1063/1.1763135
(39) Su,Z.F.;Sun,S.G.;Wu,C.X.;Cai,Z.P.J.Chem.Phys.2008,129,044707.doi:10.1063/1.2953441
