Tempo-spatial Variation of Nutrient and Chlorophyll-a Concentrations From Summer to Winter in the Zhangzi Island Area (Northern Yellow Sea)
2013-07-29YINJiehui1ZHAOZengxia1ZHANGGuangtao1WANGShiwei1andWANAiyong1
YIN Jiehui1), 2), ZHAO Zengxia1), ZHANG Guangtao1), , WANG Shiwei1), and WAN Aiyong1)
Tempo-spatial Variation of Nutrient and Chlorophyll-Concentrations From Summer to Winter in the Zhangzi Island Area (Northern Yellow Sea)
YIN Jiehui, ZHAO Zengxia, ZHANG Guangtao*, WANG Shiwei, and WAN Aiyong
1),,,266071,.2),100049,..
Nutrient and Chlorophyll-(Chl-) concentrations were investigated monthly along three transects extending from a mariculture area to open waters around the Zhangzi Island area from July to December 2009. The objective of this study is to illustrate food availability to the bottom-sowed scallopunder the influences of the Yellow Sea Cold Water Mass (YSCWM), freshwater input and feedbacks of cultivated scallops. Significant thermal stratification was present in open waters from July to October, and salinity decreased in July and August in surface layers in the mariculture area. Nutrient concentrations increased with depth in both areas in summer, but were similar through water column in November and December. On average, nutrient increased from summer to autumn in all components except ammonia. Nutrient concentrations lower than the minimum thresholds for phytoplankton growth were present only in upper layers in summer, but stoichiometric nitrogen limitation existed in the entire investigation period. Column-averaged Chl-concentration was lower in open waters than in mariculture area in all months. It increased significantly in mariculture area in August and October, and was less variable in open waters. Our results show that nutrients limitation to phytoplankton growth is present mainly in upper layer in association with stratification caused by YSCWM in summer. Freshwater input and upwelling of nutrients accumulated in YSCWM can stimulate phytoplankton production in mariculture area. Farming activities may change stoichiometric nutrient ratios but have less influence on Chl-concentration.
Zhangzi Island; Chlorophyll-; nutrients; scallop farming; the Yellow Sea Cold Water Mass
1 Introduction
Mariculture plays an important role in filling the gap between the increasing aquatic product demands and the shrinking natural resources due to overfishing (Naylor., 2000). Cultivation of shellfish, such as mussels, oysters and scallops, has undergone a rapid expansion over recent decades. As no exogenous food input is added, shellfish farming can exert significant top-down control on standing stock of phytoplankton (Newell, 1988), and its production is consequently determined by natural food supply (Cranford., 1998). Increasing shellfish pro- duction was reported with increasing primary production (Nixon and Pilson, 1983), as well as increasing dissolved nutrient supply, which can stimulate phytoplankton production through cascading effects (Andersen., 1993; Reitan., 2002). Thereafter, understanding the spatial and temporal variation of phytoplankton biomass and nutrient recruitment within the farming region is essential for sustainable shellfish production.is a Pacific-Asian low-boreal scallop, commonly cultivated in Northern China since its introduction from Japan in the 1980s (Wang, 1984; Zhang., 1984). In the Zhangzi Island area, it is cultured by sowing year-old seed freelyon bottom layer. Its total production reached 12000 tons in 2005, accounting for 46% of the total bottom-cultured.production in coastal areas of the northern Yellow Sea (Zhang., 2008a). The most important factors influencing nutrient and phytoplankton regimes in these areas are the Yellow Sea Cold Water Mass (YSCWM), freshwater input and feedbacks of the cultivation activities. YSCWM is a < 10℃ bottom water mass occupying a large area in the central Yellow Sea in summer (He., 1959). It has been established that inter-annual variation of bottom temperature in the study area, as well as summer mortality of., is determined by the northward extension of YSCWM (Du., 1996). Simultaneously, vertical nutrient flux is blocked by strong thermal stratification associated with YSCWM, and phytoplankton growth in surface layer is limited by net nutrient depletion (Wang, 2000). Nutrients accumulate in bottom layers in summer, and in turn become sources for vertical and horizontal transportation in autumn when vertical mixing is strengthened (Zang, 2009). Summer is also the main rainy season in this area, and nutrient supply in surface layer might be influenced by rainfall-induced runoffs from the islands and the diluted water from the Yalu River. Despite significant removal of food particles, increased nutrient regeneration and therefore regenerated phytoplankton production have been recorded in shellfish farming due to accelerated biodeposition in forms of faeces and pseudofaeces (Kautsky and Evans, 1987; Widdows., 1998; Peterson and Heck, 1999; Giles and Pilditch, 2004). Bottom-up effects of.had been investigated in suspension-culture systems in the coastal Northern Yellow Sea (Yuan., 2010), but not yet in bottom-sowing areas.
For this study, spatial-temporal variability in nutrient and Chlorophyll-(Chl-) concentrations were investi- gated monthly along three transects from the mariculture area to open waters from July to December 2009, a period covering the rainy season and existence-fading process of the YSCWM. Temporal variation of nutrients and Chl-concentrations was compared between the mariculture and open water areas, and the nutrient limits were then studied in these two areas. Our specific objectives include: (1) illustrating the possibility of food limit to scallop farming and nutrient limit to phytoplankton production; (2) defining the influences of the YSCWM and rainfall on nutrient and Chl-regimes; (3) estimating the magnitude of bottom-up and top-down effects of bottom-sowed scallops.
2 Materials and Methods
Investigations were carried out at the end of each month at the same set of stations from July to December in 2009 (Fig.1). The mariculture area covered stations with water depths shallower than 50 m,.., stations A1-5, B1-5 and C1-5, while stations A6, B6 and C6 were located in open waters. All the sample collections andmeasurements were finished in daytime. Temperature and salinity in water column were measured with AAQ 1183-1F CTD (Alec Electronics Co., Japan). Water samples were collected with Niskin bottles every 10 m from the surface to 2 m above the bottom.
Fig.1 Location of investigation area (rectangular in the upper map) and sample sites in the Zhangzi Island area with isobaths (sites in mariculture area;sites in open water area).
2.1 Nutrient and Chl-Measurements
In each layer, samples for dissolved nutrient analysis were prepared by filtering 500 mL of natural seawater through pre-combusted(450℃, for 6 hs) Whatman GF/F filter. Another 500-mL natural seawater for total Chl-measurement was filtered through 0.45μm Cellulose Acetate (CA) membrane. Samples for fractionated Chl-measurement were collected only in the surface and bottom layers, by filtering 1000 mL seawater through 20 μm bolting-silk, 2 μm and 0.45 μm CA membranes in turn. The filtered seawater and the membranes were wrapped with aluminum foil and frozen at-20℃ immediately. In the laboratory, dissolved inorganic nutrients (nitrate, nitrite, ammonia, phosphate and silicate) were analyzed using a QuAAtro-SFA Analyzer (Bran-Lubbe Co., Germany). The concentrations of nitrate, nitrite and ammonia were measured using the cadmium-copper reduction method, Griesse-Ilosvay method and salicylic acid method, respectively. The concentration of phosphate was measured by the molybdenum blue method, and that of silicate by the silicon-molybdenum blue method. The analytical detection range was 0.02–250µmolLfor nitrate, 0.01–40µmolLfor nitrite, 0.01–5µmolLfor ammonium, 0.01–4µmolLfor phosphate and 0.01–165µmolLfor silicate, respectively. The precision estimated with repeated measurements of selected samples was better than 3% in this study. After the membranes being extracted with 90% acetone solution (v/v) in a refrigerator (≤0℃) for 24 h, the Chl-concentrations were measured with a Turner Designs Model 7200 fluorometer.
2.2 Data Analysis
Nutrient limitations were determined following the mi- nimum thresholds for phytoplankton growth and stoichio- metry ratios, respectively (Fisher., 1992; Justic., 1995; Dortch., 1992). Dissolved inorganic nitrogen (DIN, sum of the concentration of nitrate, nitrite and ammonia) concentrations of < 2µmolL, phosphate concentrations of <0.2µmolL, and silicate concentrations of <2µmolLwere considered limiting to phytoplankton growth. Stoichiometric limitations were determined with atomic ratios as follows: N/P<10 and N/Si<1 for nitrogen limitation; N/P>22 and Si/P>22 for phosphate limitation; and N/Si>1 and Si/P<10 for silicate limitation. Difference of nutrient concentration of samples from various depths was tested with one-way ANOVA, and the spatial difference between the mariculture and open water areas was analyzed with independent samplestest. Both statistics were run with software SPSS V16.0.
3 Results
3.1 Temperature and Salinity
According to the temperature profiles obtained, thermal stratification existed from July through October, and disappeared completely in November and December (Fig.2). During its existence, thermocline was evident in open waters, where it appeared in 15-20m layer in July and August, in 20-30m layer in September, and in 27-32 m layer in October. Across the thermocline, water temperature decreased by about 10℃ from July to September and less than 5℃ in October. In the surface layer, mon- thly averaged temperature varied between 6.25 and 23.52℃ and reached the highest in August, while in the bottom layer it ranged from 7.49 to 15.70℃ and reached the highest in September. Bottom temperatures lower than 10℃ were only observed in July at stations in open waters. In November and December, the temperature was invariable through water columns and increased seawards.

Fig.2 Vertical distribution profiles of temperature along transects A, B, and C from July to December, with vertical lines showing the water column measured.

Fig.3 Spatial variation of seawater salinity in surface layers around Zhangzi Island from July to December, with black dots showing the investigation sites.
During the investigation period, salinity increased seawards in surface layers (Fig.3). Monthly averaged salinity ranged from 30.7‰ to 31.9‰ in surface layers, and from 31.7‰ to 32.0‰ in bottom layers. Obvious surface dilution was observed in July and August near the Islands. The lowest salinity of 29.72‰ and 29.87‰ in July and August was recorded at station B2 and C1, respectively.
3.2 Nutrients
On average, nutrient concentrations in both areas increased from summer to autumn for all components but ammonia (Fig.4). Monthly averaged concentrations of ammonia in both areas were higher in summer (2.77–3.14 μmolL) than those in autumn (0.81-2.73μmolL), whereas those of nitrate, phosphate and silicate increased from 0.45–2.57, 0.30–0.39 and 2.40–6.52μmolLin summer to 3.14–5.65, 0.50–0.88 and 8.87–10.36μmolLin autumn. Nitrite concentration increased from July to November, when the highest of 0.96 and 0.33μmolLwas observed in the mariculture area and in open waters, but decreased dramatically to 0.30 and 0.19μmolLin December, respectively.
Vertical difference in nutrient concentrations was more evident in summer than that in autumn in both areas. According to one-way ANOVA analysis, concentrations of nitrate, silicate and phosphate at different depths varied significantly (<0.05) from July through October in both areas, with the lowest concentration in surface or sub- surface layers and highest in bottom layers. Significant vertical difference for ammonia (<0.05) was observed only in July, when the lowest concentration appeared in 10 m layer and increased downwards with depth. For nitrite, vertical difference was significant (<0.01) in both areas in July, whereas significant difference (<0.05) was observed only in August and October in mariculture area and in September in the open waters. Nitrite concentration increased from the surface to bottom layers in mariculture area in summer, whereas in open waters the highest concentration in August was observed in the 20m layer.
Spatial difference of nutrient concentrations varied with components, and different patterns were identified in the surface and bottom layers. Concentrations of nitrate and phosphate in bottom layer were significantly (<0.05) higher in open waters than that in mariculture area, but in surface layer both of them were significantly higher in mariculture area in October (<0.01) and lower in November (<0.01). Silicate concentration in surface layer of the mariculture area was significantly (<0.05) higher in July, August and October, but lower (<0.01) in November and December. In bottom layer, it was significantly higher (<0.01) in July, but lower (<0.01) in October and November in the mariculture area. In bottom layer, nitrite concentration in mariculture area was significantly (<0.01) lower in July, and higher (<0.01) in August and October. It was higher in mariculture area in all months in bottom layer that in surface layer, with significance (<0.05) presented from September to October. Significant difference in ammonia concentration was only observed in bottom layer in August (<0.05), when it was 2.87μmolLin mariculture area and 0.87 μmolLin open waters. According to the column-ave- raged concentrations, nitrate and phosphate was higher in open waters than that in mariculture area in all months, and the difference was significant (<0.05) except in September and December. Silicate concentrations in mariculture area were higher in summer with significance in July and August (<0.05), but lower in autumn with significance in November (<0.01). Nitrite concentration was significantly lower in mariculture area in July (<0.05), but higher in the other months with significance (<0.05) except in September and December. The differences between these two areas were 4 times higher than in August and October. No spatial difference was detected for ammonia in column-averaged concentration.
Nutrient concentrations lower than the minimum thresholds for phytoplankton growth appeared always in summer and mainly in the upper layers (Table 1). Silicate limitation was present only in July and August, with higher proportion observed in open waters. In these two months, silicate concentrations in open waters were lower than 2μmolLin all the samples from the 0-10m layer and only one sample from the 20-30m layer, whereas in mariculture area silicate limitation was recorded in the 0-10m layer with proportion of 30.0 and 5.3 %. Nitrogen and phosphate limitations appeared from July to September. The highest proportion was recorded in the 0–10m layer, but concentrations lower than the thresholds were observed also in bottom layers in mariculture area. According to stoichiometric ratios, nitrogen limitation existed all through the investigation period, especially in autumn, with occurrence proportion varying between 15%–95% in mariculture area and between 16.7%–100% in open waters. Phosphate limitations were only observed in August and September. It appeared in all depth layers in September in both areas with proportions less than 27.3%, but only in August in the surface layer of mariculture area. Si limitations were observed mainly in summer, with higher proportion in open waters (33.3%– 100%) than that in mariculture area (5.0%–35.0%). In au- tumn, it appeared only in December in mariculture area.
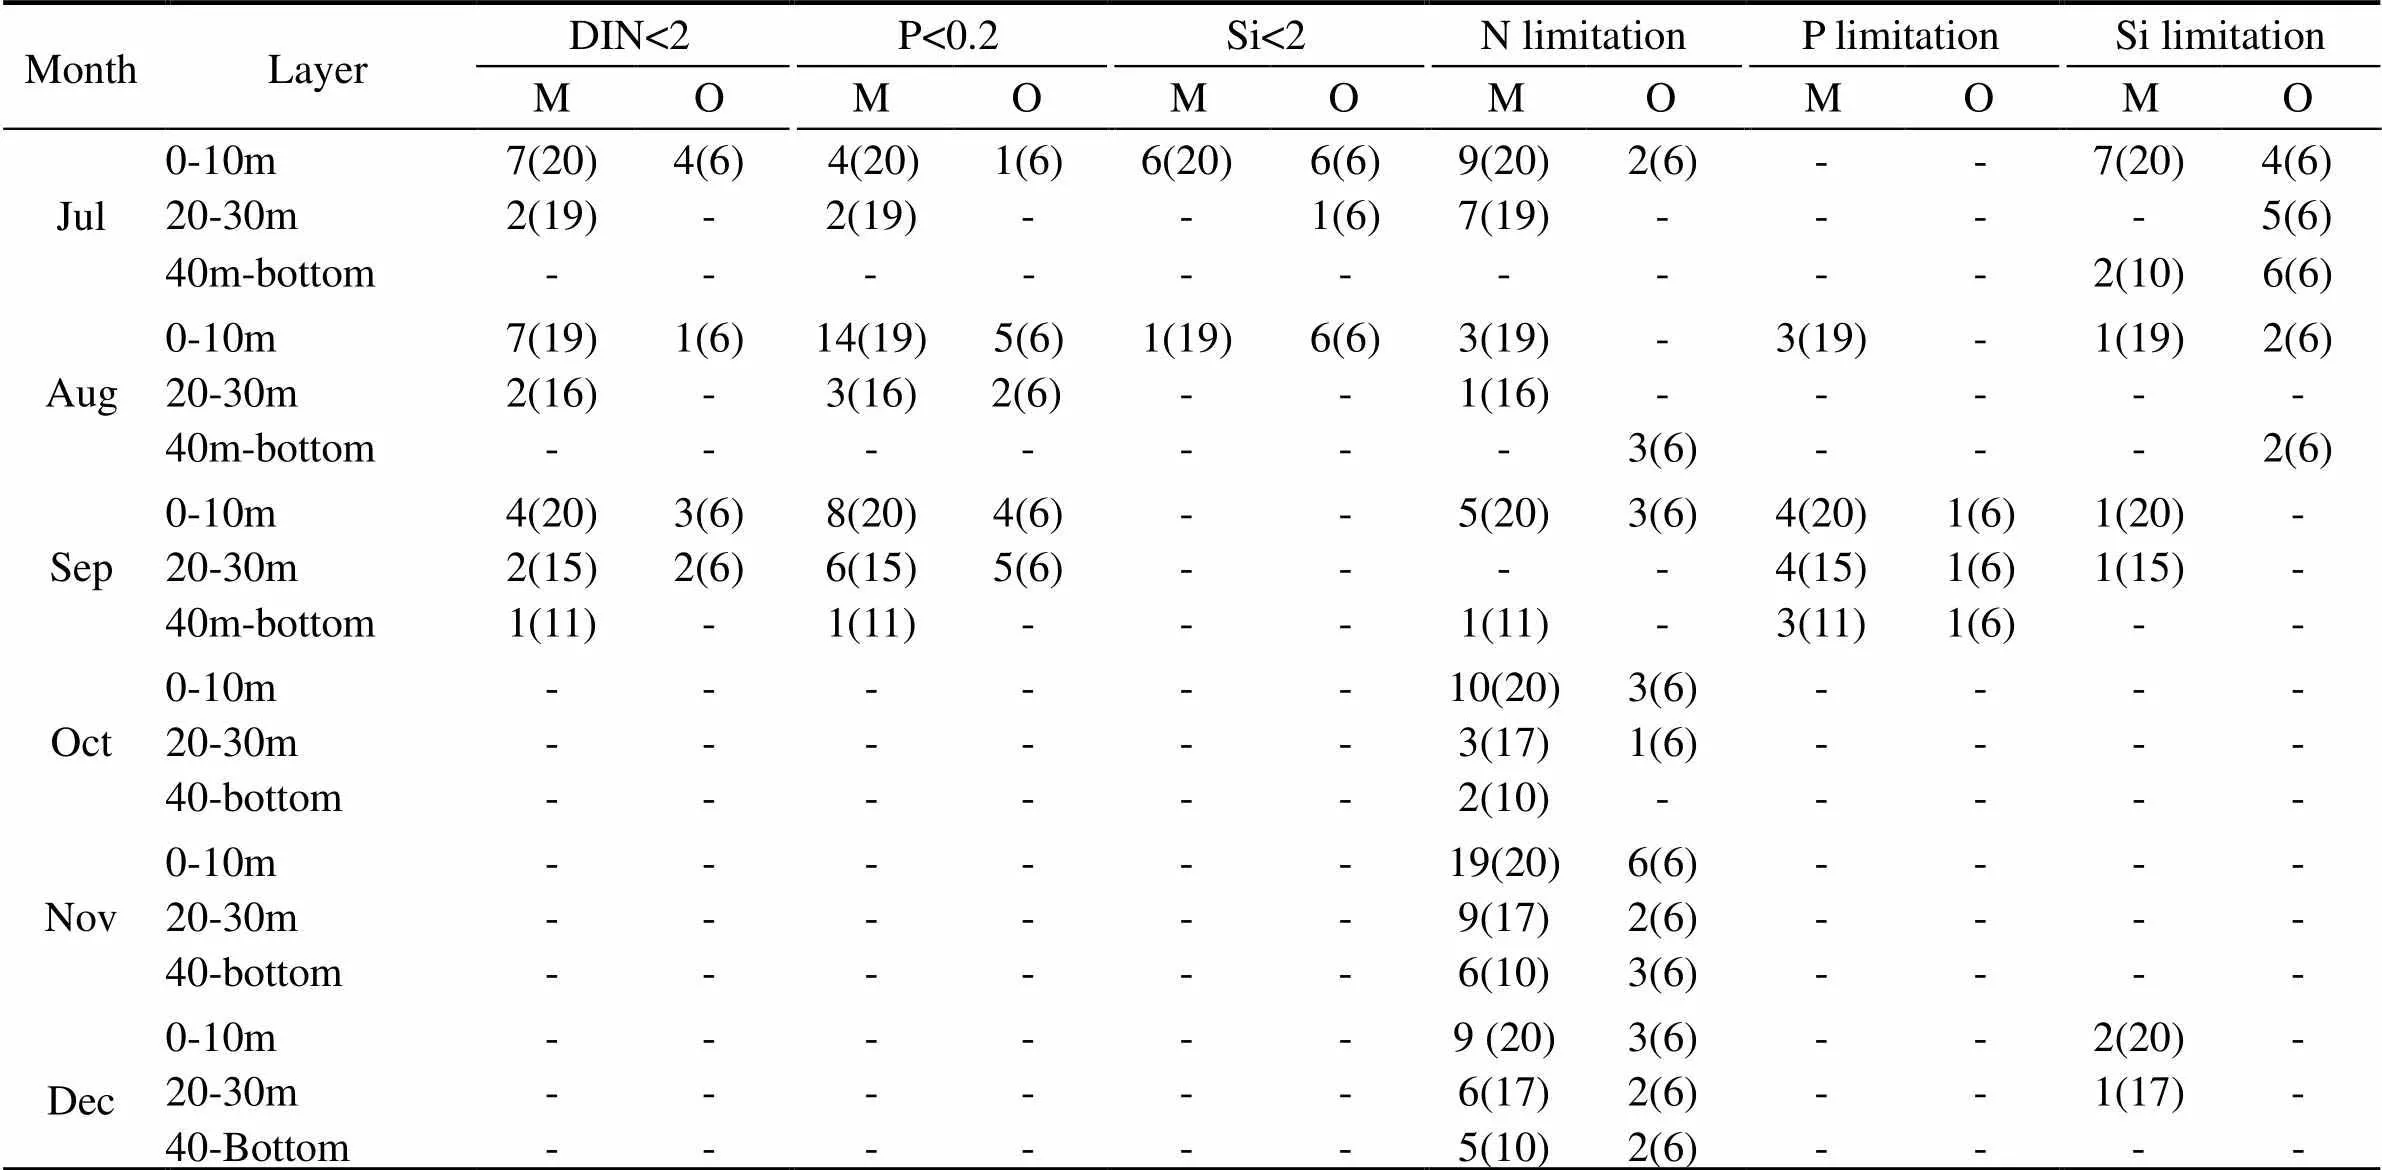
Table 1 Occurrences of nutrient limitation determined by minimum threshold for phytoplankton growth and stoichiometric ratios in the mariculture area (M) and open waters (O) from July to December. Numbers of nutrient limited and total samples are listed inside the brackets, and dashes represent the case in which no nutrient limitation was observed.
3.3 Total and Size-fractionated Chl-Concentra- tions
The column-integrated Chl-concentrations were higher in mariculture areas than those in open waters in all investigated months, with significant difference observed in August (<0.01) and October (<0.05) (Fig.5). In the mariculture area, a main peak of column-averaged Chl-concentration (1.37μgL) was observed in August and a minor one (0.69μgL) appeared in October. Chl-concentrations in the other months ranged from 0.28 to 0.33μgL. It was less variable in open water area, ranging from 0.18 to 0.32μgL.
Vertical difference of Chl-concentrations in both areas was more evident in summer than that in autumn (Fig.6). On average, Chl-concentration in open water area was highest in July and August in the 20m layer, and in September and October in the 10m layers. The maximum concentrations were 0.36, 0.42, 0.76, and 0.42μg L, respectively. In the mariculture area, average Chl-concentration was highest in July in the 20m layer (0.44μg L), in August and September in surface layer (2.45and 0.82μgL), and in October in 10m layer (1.01μgL). Extremely high Chl-concentration of 7.32μgLwas observed in August in the surface layer at B3 station. In the same depth layer, average Chl-concentrations were higher in mariculture area than those in open waters, except for the 10m, 20m layers in September, and the 20 m layer in December. When thermocline disappeared in November and December, vertical distribution of Chl-concentrations was relatively even. In the mariculture area, Chl-concentrations ranged 0.14–0.39μgLand 0.24–0.29μgL, while those in open water area varied between 0.15–0.35 and 0.17–0.35μgL.
On average, microplankton (>20μm) dominated in the total chl-concentration in mariculture area in both surface layer (54.4%) and bottom layer (65.3%), whereas in open waters nanoplankton (2–20μm) prevailed (50.6%) in the surface layer and microplankton dominated (68.3%) in the bottom layer (Fig.7). Dominance of nanoplankton was observed only in summer, when its proportion ranged between 12.5% and 77.8%. In surface layer, proportion of nanoplankton exceeded that of microplankton in August and September in the mariculture area, but in July and September in open waters. In the bottom layer, the proportion of nanoplankton was higher than that of microplankton only in August in both areas. In autumn, the proportion of nanoplankton varied between 2.8% and 44.0%. That of microplankton varied between 22.2%-87.5% in summer and 39.4-97.2% in autumn. Extremely high picoplankton (0.45-2μm) proportion of 31.1% was observed in the bottom layer of open waters in November, whereas its proportion varied between 0 and 6.9% in other circumstances.

Fig.6 Vertical distribution of Chl-a concentration (with error bars showing standard deviation) in the mariculture area and open waters from July to December.
Fig.7 Proportion of size-fractioned Chl-concentration (μgL) in the surface and bottom layer in the mariculture area (M) and open waters (O) from July to December.
Besides the spatial and vertical variations, Chl-concentration also differed in size structure during the two phytoplankton blooms observed in August and October, as in both surface and bottom layers nanoplankton concentration was highest in August and microplankton concentration was highest in October. From July to August, nanoplankton concentration in the mariculture area increased from 0.14 to 1.32μgLin surface layer and from 0.11 to 0.23μgLin bottom layer. Concentration of microplankton also increased from 0.20 to 0.56μgLin surface layer, but decreased from 0.23 to 0.19μgLin bottom layer. From September to October, concentration of microplankton increased from 0.13 to 0.78μgLin surface layer and from 0.09 to 0.75μgLin bottom layer in the mariculture area, and increased correspondingly from 0.05 to 0.35μgLand from 0.02 to 0.12μgLin open waters. At the same time, concentration of nanoplankton increased slightly in both areas.
4 Discussion
Comparing to previous seasonal investigations in this area, monthly observation in our study recorded more details on seasonal and spatial regimes of Chl-and nutrient concentrations, which can potentially influence food availability and thereby production of scallop farming. Although bottom temperature <10℃ was observed only in July, thermal stratification and nutrient depletion induced thereby existed from July through October in not only open waters but also the mariculture area. When spatial difference of Chl-concentration in the bottom layer was considered, evident offshore decrease was only detected in August and October, whereas no significant difference was observed in the other months between the mariculture area and open waters (Fig.8). In our opinion, the elevated food availability to bottom-sowed scallops in these two months might be induced by rainfall and upward recruitment of nutrients accumulated in YSCWM, respectively. To our knowledge, this is the first time ecological impacts of bottom-sowing scallop cultivation in an open area are examined. Hence, its feedbacks have been investigated through comparisons between mariculture and open water areas and also between the study area and the entire Northern Yellow Sea.

Fig.8 Horizontal distribution of bottom Chl-a concentrations (μg L-1) from the mariculture area to open waters from July to December.
4.1 Top-Down and Bottom-Up Effects of Scallop Farming
According to both total and size-fractionated Chl-concentrations in our study, bottom-sowed scallops exerted little influence on phytoplankton standing stock. Although top-down control of bivalve grazing on phytoplankton biomass had been established by a proliferation of studies (reviewed by Smaal and Prins, 1993), it has been limited mostly to gulf and estuarine systems, as significant impacts are expected only when bivalve clearance time is approximately equal to phytoplankton turnover time and shorter than water residence time (Dame and Prins, 1997). Top-down control can hardly be distinguished due to significant water exchange in such an open system as the Zhangzi Island area and in the absence of artificial obstacle in bottom-sowing farming. In terms of column integration, Chl-concentrations in the mariculture area were higher than those in open water area through the investigation period. When the bottom layer whereinhabited was considered, no significant decrease was observed in the mariculture area comparing to open waters. However, grazing pressure can be still detectable on a broadened scale. The average Chl-concentrations varied between 0.18–1.37μgLfrom July to December in our study. In another seasonal investigation in this area, Chl-concentrations varied between 1.23–2.85μgLin the bottom layer (Zhang., 2008). In the entire Northern Yellow Sea, Chl-concentration was highest in autumn (October, 2007), with a surface concentration of 1.85 ± 1.58μgLand a column-integrated concentration of 54.40 ± 34.76mgm, and the lowest concentration was observed near the Zhangzi Island area (Gao, 2009). In studies prior to scallop cultivation, higher phytoplankton abundance and more significant seasonal variation were recorded in this area comparing to other parts of the Yellow Sea (Chu and Kuo, 1959; Huang., 1984).
Nutrient enrichment associated with scallop farming was also not observed in our study. Influences of bivalve farming on nutrient cycling have been reported overwhelmingly in raft culture systems, and their contribution might vary among nutrient components. At the scale of one mussel farm, nutrient regeneration by mussel ropes increases inorganic nitrogen concentrations by 20% and inorganic phosphorus concentrations by 5% during summer conditions (Jansen., 2011). In the Northern Yellow Sea, suspension-culturedcan release considerable amount of ammonia and phosphate in each age group, with peak values observed in autumn and summer, respectively (Yuan., 2010). However, in our study, temporal variation of ammonia concentration was different with that of excretion rate of, and inorganic nitrogen and phosphate concentrations were lower in the bottom layer of the mariculture area than those in open waters. It is suggested that influence on bottom nutrient concentrations is not significant in bottom sowing culture of scallops comparing to net accumulation in YSCWM. Bottom-up effects may be less evident in bottom sowing systems, where decreased biodeposition is expected owing to lower farming density and rapid water exchange in the absence of artificial rafts.
However, ratios among nutrient components might be changed by farming activities. In summer, occurrence frequency of phosphate limitation determined by both minimum threshold of phytoplankton assimilation and stoichiometric balance, is higher than that of nitrogen and silicate in the surface layer of the entire Northern Yellow Sea (Zhang., 2009). This shows well coincidence with comparative phosphate shortage in the coastal and Yalu River diluted waters and net accumulation in cold bottom waters (Zang, 2009; Zhang., 2012). However, silicate instead became the most important limiting nutrient in July and August in our study according to minimum thresholds for phytoplankton growth, especially in open waters. Nitrogen limitation on stoichiometric ratios existed in the whole survey, whereas phosphate limitation was absent in autumn. Silicate shortage can result from its lower regeneration rate in food web dynamics (Jansen., 2011). The N/Si ratio is lower than 1 in the coastal waters north of the Zhangzi Island and in the Yalu River Estuary in spring, much lower than in other areas of the Northern Yellow Sea (Zang, 2009). Though contribution of increasing biodeposition by filter-feeders on silica depletion still remains to be explored on an annual scale, increased activity of suspension feeders during spring bloom period can lead to temporary retention of biogenic silica (BSi) in the sediments (Ragueneau., 2005). Thereafter, silicate shortage observed in early summer in our study may result from increased net silicate consumption in spring. Shellfish farming may increase nitrogen removal from ecosystems through not only net accumulation in body tissues but also enhanced denitrification by bio-deposition (Newell, 2004). Both bottom-sowed scallops in our study area and those suspension-cultured in coastal waters can contribute to such silicate and nitrogen depletion, and the exact contribution cannot be distinguished.
4.2 Environmental Impacts on Food Availability
Sea scallops are known to explore complex food sour- ces, but they are able to select high-quality Chl--con- taining particles, which can significantly improve the quality of material ingested (MacDonald and Ward, 1994). Ingestion rates increase slightly with increasing particle concentration, and selection is not based on the size of particles. The lower limit for effective particle retention of suspension-feeding bivalves ranges between 1 and 7 μm (Møhlenberg and Riisgård, 1978), and the upper size limit may be as large as 0.5–6 mm (Karlsson., 2003). In our study, nano- and micro-phytoplankton accounted for more than 90% of total biomass in the mariculture area, indicating a favorable food assemblage for. However, the total chlconcentration was much lower than those reported in sheltered scallop farming areas (.. MacDonald and Ward, 1994), and therefore food availability is critical toproduction. Fluctuation of natural food supply is to be discussed in association with physical conditions.
4.2.1 YSCWM
Food availability to bottom-sowed scallops decreases during existence of YSCWM in summer and increases during its diminishing. Summer is the most critical season forfarming, as high mortality has been observed in summer under the integrated influence of high water temperature and food scarcity caused by high breeding density (reviewed by Li and Tan, 2009). During our investigation, bottom temperature was much lower than the upper thermal limit of., indicating low possibility of thermal stresses. Chl-concentrations were lower in the bottom layer in July and September comparing to those in November and December, indicating a potential food limit to bottom-sowed scallops. Despite the surface phytoplankton bloom in August, microplankton biomass kept decreasing in the bottom layer of mariculture area, whereas nanoplankton biomass increased slightly. However, during the diminishing of YSCWM in October, Chl-concentration increased significantly in the mariculture area, and bottom Chl-concentration in the mariculture area was highest in this month.
The changing food availability is determined by diffe- rent nutrient recruitment patterns associated with YSC- WM. In previous studies, vertical profile of Chl-concentration in the YSCWM area was characterized by sub-surface maximum, as nutrients were exhausted in the surface layer (Wang, 2000). Column integrated Chl-concentration is comparatively low in summer both in the entire Northern Yellow Sea and around the Zhangzi island area, (Zhang., 2008; Gao and Li, 2009). In our study, nutrient concentrations lower than the threshold for phytoplankton growth was observed frequently in the surface layer in summer, but sub-surface maximum of Chl-concentration in summer was observed mainly in open waters, as instantaneous bloom was induced by freshwater inputs in the mariculture area. Nutrient concentrations increased above the minimum threshold for phytoplankton growth in all sampled layers since October, and significant increase in Chlconcentration was observed in both the surface and the bottom layers. Chl-concentration increased from summer to autumn during seasonal investigation from both the entire Northern Yellow Sea and around the Zhangzi island area (Zhang., 2008; Gao, 2009). According to the monthly sampling in our study, nutrient limitation induced by YSCWM also spread to the mariculture area in summer, but increased phytoplankton biomass associated with vertical nutrient recruitment was most evident during the onset of the diminishing of YSCWM.
The YSCBW may also change the stoichiometric ratios of various nutrient components in the bottom layer, most possibly owing to different regeneration rates among nutrient components (Chen., 1996; Jansen., 2011). In previous studies, N/P and Si/P ratios were low in YSCWM areas, but phosphate deficit appearing in coastal waters was influenced by the diluted water (Zang, 2009; Zhang., 2012). In this study,N/P and Si/P ratios were 11.6 and 12.6 in the mariculture area and 10.7 and 6.3 in open waters in July, but increased to higher than 16 in September in both areas. In each month, these ratios were higher in the mariculture than those in open waters, especially in the bottom layers. It was indicated that, comparing to nutrient depletion, changed stoichiometric ratios by YSCWM were ameliorated in the mariculture areas by horizontal mixing of YSCWM and coastal waters, which can further stimulate phytoplankton production.
Influences of YSCWM on nutrient regime might differ among components. Vertical and temporal variation of ammonia are independent of thermal stratification. Different vertical profiles have been recorded for ammonia and nitrite comparing with nitrate, phosphate and silicate during a previous study carried out in YSCWM area in summer (Li, 2010), but the different temporal variation was recorded for the first time. In our study, nitrite concentration was much higher in the mariculture area than that in open waters, and also increased with depth in summer. For ammonia, significant vertical difference was observed only in July, and monthly variation of its concentration was opposite to that of the other nutrient components. Proportion of ammonia in total DIN decreased from 51%–84% in summer to 11%–33% in autumn. Besides mineralization from organic matter accumulated in the sediments, ammonia is also produced by mineralization of organic nitrogen as it passes through the euphotic-zone food web. It is established that zooplankton and bacteria played an important role in ammonium production (Hattori, 1982). The observed ammonia concentration might be influenced by organic matter inputs and biological activities in terms of release and assimilation, but is unlikely correlated with scallop farming. Ammonia excretion rate of.was highest in November in various age groups from a previous investigation in the coastal Northern Yellow Sea (Yuan., 2010). Changes of ammonia concentration coincides with those in phytoplankton community structure in shrimp pond (Burford, 1997). Though ammonia concentration was much lower in our study, its influence on phytoplankton regime deserves further investigation.
4.2.2 Freshwater input
Decreased surface salinity was observed in July and August, but stimulated phytoplankton biomass was present only in August, when the investigation was carried out following a heavy rain. Except silicate concentration was significantly higher in the surface layer of mariculture area than that in open waters, no significantly increased nutrient concentration was detected in these two months. On the other hand, occurrence frequency of phosphate limitation determined by threshold of phytoplankton growth increased in the upper layer from July to August, and N/P ratio increased from 11.6 to 18.5. As comparative phosphate shortage is observed in coastal and diluted waters (Zang, 2009; Zhang., 2012), freshwater inputs might ameliorate nitrogen and silicate limitation to phytoplankton growth and induce instantaneous phytoplankton bloom, which in turn increases the possibility of phosphate limitation.
According to the sizes of different compositions during the two bloom periods, nutrients supplied by YSCWM and freshwater input induce different changes in phytoplankton community. No simple relationship has been recorded between size structure of phytoplankton community and preferred nutrient substrate (Bury., 2001), but it is established that freshwater discharges could increase proportion of nanoplankton (Bec., 2011). Generally, the small size phytoplankton has advantage in open sea, where the environmental factors are stable and the nutrient is poor (Chisholm, 1992), while the large size phytoplankton has advantage in offshore areas with high nutrient (Arin., 2005). In our investigation, microplankton dominated in most cases, but nanoplankton prevailed in the surface layer in August. It is suggested that the freshwater discharges stimulated mostly fast- growing nanoplankton, but increased nutrient concentrations during the diminishing of YSCWM promoting phytoplankton production without any change in community structure. Additionally, Chl-concentration only increased significantly in the bottom layer of mariculture area in October. It was indicated that nutrient recruitments during the YSCWM disappearance played a more important role in food availability than the influence associated with freshwater inputs.
5 Conclusions
In conclusion, food availability to bottom-sowed scallops in the Zhangzi Island area is mainly influenced by the YSCWM. In summer, phytoplankton production in euphotic zone is limited by nutrient exhaustion, and thereby low Chl-concentration is observed in the bottom layer. As nutrients accumulated in the bottom layer is upwelled during diminishing of YSCWM, high Chl-concentration is observed in both surface and bottom layers. Although phytoplankton bloom is induced by rainfall, little contribution is expected from food availability, as it is limited in the surface layer. Comparing to raft culture, less ecological impacts are observed in bottom-sowed farming of scallops. However, it is suggested that investigations should be carried out on a larger geographical scale for further understanding of the environmental impacts.
Acknowledgements
This study was financially supported by the Knowledge Innovation Program of Chinese Academy of Sciences, the Science and Technology Ministry of China (No. 2011CB 403604) and the IOCAS-Zhangzidao Fishery Eco-Mari- culture Joint Laboratory. We thank Mr. ZANG Y. C. and the crew on the research vessel of Dalian Zhangzidao Fishery Group Co., Ltd for their supports on field sampling.
Andersen, S., and Naas, K. E., 1993. Shell growth and survival of scallop (L) in a fertilized shallow seawater pond., 110 (1): 71-86.
Arin, L., Estrada, M., Salat, J., and Cruzado, A., 2005. Spatio-temporal variability of size fractionated phytoplankton on the shelf adjacent to the EbroRiver (NW Mediterranean)., 25 (9): 1081-1095.
Burford, M., 1997. Phytoplankton dynamics in shrimp ponds., 28 (5): 351-360.
Bury, S. J., Boyd, P. W., Preston, T., Savidge, G., and Owens, N. J. P., 2001. Size-fractionated primary production and nitrogen uptake during a North Atlantic phytoplankton bloom: Implications for carbon export estimates., 48 (3): 689-720.
Bec, B., Collos, Y., Souchu, P., and Vaquer, A., 2011. Distribution of picophytoplankton and nanophytoplankton along an anthropogenic eutrophication gradient in French Mediterranean coastal lagoons., 63 (1): 29- 45.
Chisholm, S. W., 1992. Phytoplankton size. In:. Falkowski, G., Woodhead, A. D., eds., Plenum, New York, 213-217.
Chen, C. T. A., Gong, G. C., Wang, S. L., and Alexander, S. B., 1996. Redfield ratios and regeneration rates of particulate matter in the Sea of Japan as a model of closed system., 23 (14): 1785-1788.
Chu, S. P., and Kuo, Y. C., 1959. A decade of marine phytoplankton research in China., 2 (4): 223-229 (in Chinese with English abstract).
Cranford, P. J., Emerson, C. W., Hargrave, B. T., and Milligan, T. G., 1998. In situ feeding and absorption of sea scallops(Gmelin) to storm-induced chang- es in the quantity and composition of the seston., 219 (1-2): 45-70.
Dame, R. F., and Prins, T. C., 1998. Bivalve carrying capacity in coastal ecosystems., 31: 409-421.
Du, B., Zhang, Y. J., and Shan, Y. C., 1996.The characteristics of cold water mass variation at the bottom of the Northern Yellow Sea and its hydrological effects on the mortality of shellfish cultured in the waters of outer Chang-shan Islands., 15 (4): 17-28 (in Chinese with English abstract).
Dortch, Q., and Whitledge, T. E., 1992. Does nitrogen or silicon limit phytoplankton production in the Mississipi River plume and nearby regions., 12 (11): 1293-1309.
Fisher, T. R., Peele, E. R., and Ammerman, J. W., 1992. Nutrient limition of phytoplankton in Chesapeake Bay., 82: 51-63.
Gao, S., and Li, Z. Y., 2009. Spatial and seasonal variation of Chlorophylland primary productivity in summer and winter in the Northern Yellow Sea., 39 (4): 604-610 (in Chinese with English abstract).
Giles, H., and Pilditch, C. A., 2004. Effects of diet on sinking rates and erosion thresholds of mussel(Perna Canaliculus) biodeposits., 282: 205-219.
Hattori, A., 1982. The nitrogen cycle in the sea with special reference to biogeochemical processes., 38 (4): 245-265.
He, C. B., Wang, Y. X., and Xu, S., 1959. A preliminary study of the formation of Yellow Sea Cold Water Mass and its properties., 2 (1): 11-15 (in Chinese with English abstract).
Huang, W. X., Shen, L. F., and Zhu, L., 1984. Phytoplankton in the Yellow Sea., 3 (3): 19-26 (in Chinese).
Justic, D., Rabalais, N. N., and Turner, R. E., 1995. Stoichiometry nutrient balance and origin of coastal eutrophication., 30 (1): 41-46.
Jansen, H. M., Strand, O., and Strohmeier, T., 2011. Seasonal variability in nutrient regeneration by musselrope culture in oligotrophic systems., 431: 137-149.
Karlsson, O., Jonsson, P. R., and Larsson A. I., 2003. Do large seston particles contribute to the diet of the bivalve Cerastoderma edule?, 261: 164- 173.
Kautsky, N., and Evans, S., 1987. Role of biodeposition by Mytilus edulis in the circulation of matter and nutrients in a Baltic Coastal ecosystem., 38: 201-212.
Li, W. J., and Tan, K. F., 2009. The inspiration on massive mortality of Scallopresolved by Japan., 28 (10): 609-612 (in Chinese with English abstract).
Li, Z., 2010. Chlorophyll-concentration distribution and its relation with environmental factors in the Southern Yellow Sea in summer. Master Thesis. First Research Institute of State Oceanic Administration. 25-84.
MacDonald, B. A., and Ward, J. E., 1994. Variation in food quality and particle selectivity in the sea scallop(Mollusca: Bivalvia)., 104: 251-264.
Møhlenberg, F., and Riisgård, H. U., 1978. Efficiency of particle retention in 13 species of suspension-feeding bivalves., 17: 239-246.
Naylor, R. L., Goldburg, R. J., Primavera, J. H., Kautsky, N., Beveridge, M. C. M., Clay, J., Folke, C., Lubchenco, J., Mooney, H., and Troell, M., 2000. Effect of aquaculture on world fish supplies., 405: 1017-1024.
Newell, R. I. E., 1988. Ecological changes in Chesapeake Bay: are they the result of overharvesting the eastern oyster ()? In:. Advances in Chesapeake Bay research, Lynch, M. P., and Krome, E. C., eds., Chesapeake Research Consortium Publ. 129, Gloucester Point, VA, 536-546.
Newell, R. I. E., 2004. Ecosystem influences of natural and cultivated populations of suspension-feeding bivalve molluscs: a review., 23 (1): 51-61.
Nixon, S. W., and Pilson, M. E. Q., 1983. Nitrogen in estuarine and coastal marine ecosystems. In:. Carpenter, E. J., and Capone, D. G., eds., Academic, 565-648.
Peterson, B. J., and Heck, Jr., K. L., 1999. The protential for suspension feeding bivalves to increase seagrass productivity., 240 (1): 37-52.
Ragueneau, O., Chauvaud, L., Moriceau, B., Leynaert, A., Thouzeau, G., Donval, A., Le Loch, F., and Jean, F., 2005. Biodeposition by an invasive suspension feeder impacts the biogeochemical cycle of Si in a coastal ecosystem (Bay of Brest , France)., 75 (1): 19-41.
Reitan, K. I., Øie, G., Vadstein, O., and Reinertsen, H., 2002. Response on scallop culture to enhanced nutrient supply by experimental fertilisation of a landlocked bay., 484: 111-120.
Smaal, A. C., and Prins, T. C., 1993. The uptake of organic matter and the release of inorganic nutrients by bivalve suspension feeder beds. In:. Dame, R. F., ed., Springer Verlag, Berlin, 271-298.
Wang, Q. C., 1984. The introduction of Japanese scallopand its farming prospect in Northern China., 4: 24-27 (in Chinese with English abstract).
Wang, B. D., 2000. Characteristics of variations and interrelations of biogenic elements in the Huanghai Sea Cold Water Mass., 22 (6): 47-54 (in Chinese with English abstract).
Widdows, J., Brinsley, M. D., Salkeld, P. N., and Elliott, M., 1998. Use of annular flumes to determine the influence of current velocity and bivalves on material flux at the sediment matter interface., 21: 552-559.
Yuan,X., Zhang, M., Liang, Y., Liu D., and Guan, D., 2010. Self-pollutant loading from a suspension aquaculture system of Japanese scallop () in the Changhai sea area, Northern Yellow Sea of China., 304: 79-87.
Zang, L., 2009. The research of biogenic elements seasonal characteristics in the North Yellow Sea and the contribution of the North Yellow Sea Cold Water Mass. Master Thesis. Ocean University of China. 19-35.
Zhang, F. S., He, Y., Ma, J. H., Liu, X. S., Li, S. Y., Qi, L. X., Yu, S. E., and Yuan, S. S., 1984. The introduction of Japanese scallopinto China, its spat- rearing and experimental cultivation., 36 (5): 38-45 (in Chinese with English abstract).
Zhang, J. H., Fang, J. G., and Wang, S. H., 2008a. Carrying capacity forin Zhangzi Island., 32 (2): 236-241 (in Chinese with English abstract).
Zhang, J. H., Fang, J. G., Jiang, Z. J., Wang, W., Wang, S. H., and Sun, S., 2008b. Seasonal variation of primary production and spatial-temporal distribution of chlorophyllin mariculture area of Zhangzidao Island., 29 (4): 22-28 (in Chinese with English abstract).
Zhang, H., and Shi, X. Y., 2009. Distribution features of nutrients structure and nutrient limitation in the north of Yellow Sea.,39 (4): 773- 780 (in Chinese with English abstract).
Zhang, G., Zhao, Z., Liu, C., Liu Q., and Ren, J., 2012. Influence of a flood event on salinity and nutrients in the Changshan Archipelago area (Northern Yellow Sea)., 11 (3): 1-8.
(Edited by Ji Dechun)
10.1007/s11802-013-2101-4
ISSN 1672-5182, 2013 12 (3): 373-384
. E-mail:gtzhang@qdio.ac.cn
(July 11, 2012; revised December 10, 2012; accepted January 21, 2013)
© Ocean University of China, Science Press and Springer-Verlag Berlin Heidelberg 2013
杂志排行
Journal of Ocean University of China的其它文章
- Evaluation of Antitumor, Immunomodulatory and Free Radical Scavenging Effects of A New Herbal Prescription Seaweed Complex Preparation
- Shallow Water Body Data Processing Based on the Seismic Oceanography
- Prediction of China’s Submerged Coastal Areas by Sea Level Rise due to Climate Change
- A Homogeneous Linear Estimation Method for System Error in Data Assimilation
- The Suspended Sediment Concentration Distribution in the Bohai Sea, Yellow Sea and East China Sea
- Role of Ekman Transport Versus Ekman Pumping in Driving Summer Upwelling in the South China Sea