Role of Ekman Transport Versus Ekman Pumping in Driving Summer Upwelling in the South China Sea
2013-07-29WANGDakui1WANGHui3LIMing2LIUGuimei3andWUXiangyu3
WANG Dakui1), 2), 3), *, WANG Hui3), 4), LI Ming2), LIU Guimei3), and WU Xiangyu3)
Role of Ekman Transport Versus Ekman Pumping in Driving Summer Upwelling in the South China Sea
WANG Dakui, WANG Hui, LI Ming, LIU Guimei, and WU Xiangyu
1),,266100,2),,,21613,3),,100081,4),,266100,
Relative roles of Ekman transport and Ekman pumping in driving summer upwelling in the South China Sea (SCS) are examined using QuikSCAT scatterometer wind data. The major upwelling regions in the SCS are the coastal regions east and southeast of Vietnam (UESEV), east and southeast of Hainan Island (UESEH), and southeast of Guangdong province (USEG). It is shown that the Ekman transport due to alongshore winds and Ekman pumping due to offshore wind stress curl play different roles in the three upwelling systems. In UESEV, Ekman pumping and Ekman transport are equally important in generating upwelling. The Ekman transport increases linearly from 0.49Sv in May to 1.23Sv in August, while the Ekman pumping increases from 0.36 to 1.22Sv during the same period. In UESEH, the mean estimates of Ekman transport and Ekman pumping are 0.14 and 0.07Sv, respectively, indicating that 33% of the total wind-driven upwelling is due to Ekman pumping. In USEG, the mean Ekman transport is 0.041Sv with the peak occurring in July, while Ekman pumping is much smaller (0.003 on average), indicating that the upwelling in this area is primarily driven by Ekman transport. In the summers of 2003 and 2007 following El Niño-Southern Oscillation (ENSO) events, both Ekman transport and Ekman pumping decrease in UESEV due to the abnormally weak southwest monsoon. During the same events, however, Ekman transport is slightly enhanced and Ekman pumping is weakened in UESEH and USEG.
South China Sea; upwelling; Ekman transport; Ekman pumping
1Introduction
The SCS, extending from the equator to 22˚N and from 99˚E to 121˚E, is a large semi-enclosed tropical marginal ocean basin with a total area of 3.5×10kmand an average depth greater than 2000m (Fig.1). The bottom topography of the SCS is characterized by a deep basin with a maximum depth greater than 5000m and two continental shelf areas: the Gulf of Thailand and the Sunda Shelf in the southwest; and the northern SCS (NSCS) shelf off the southeast China and northern Vietnam coasts. Between these two shallow and wide shelves is the narrow slope east of Vietnam.
The SCS climate system is part of the East Asian monsoon system (Lau, 1998; Wyrtki, 1961). In winter (December-January-February), the SCS is dominated by strong northeasterly monsoon winds, whereas in summer (June-July-August) the winds reverse the direction to be southwesterly. Theoretically, southerly winds force an off-shore surface Ekman flow over the inner continental shelf. As a result, colder and nutrient-rich water from below upwells toward the surface, replacing offshore-flowing surface water (Liu and Xie, 1999; Xie, 2003). The southwesterly monsoon first appears in the central basin in May and then spreads over the entire basin in July and August (Shaw and Chao, 1994). Previous studies have shown that upwelling takes place along the west coast of the SCS (WCSCS), typically within the areas of UESEV, UESEH and USEG, during the southwesterly monsoon (Wyrtki, 1961; Xie, 2003). By observing annual variation of sea surface temperature (SST),Wyrtki (1961) found that SST along the Vietnam coast drops more than 1℃ in June and July, caused by monsoon-induced upwelling.Ho(2000) showed that there is a region of relatively low sea surface height (SSH) off southern Vietnam, which indicates the occurrence of upwelling. Kuo(2000) observed upwelling along the WCSCS using National Oceanic and Atmospheric Administration (NOAA) Advanced Very High Resolution Radiometer (AVHRR) images received in the summers of 1996 and 1997. Correlation analysis indicates that observed upwelling is mainly induced by the alongshore component of the southwesterly monsoon. Using a suite of new satellite measurements, Xie(2003) found that, on the climatological mean, a cold filament develops from the Vietnam coast eastward to the open SCS from June to August. They also noted that the topographic wind jet results in strong wind curls, which are important for oceanic upwelling off the Vietnam coast. In addition, from spring to summer, SST in UESEV does not increase monotonically with solar radiation at the top of the atmosphere, but begins to decrease after the onset of the southwest monsoon, giving rise to a pronounced semi-annual cycle in SST. As revealed in previous studies, wind-induced upwelling is responsible for this mid-summer cooling (Jing, 2009; Xie, 2003).
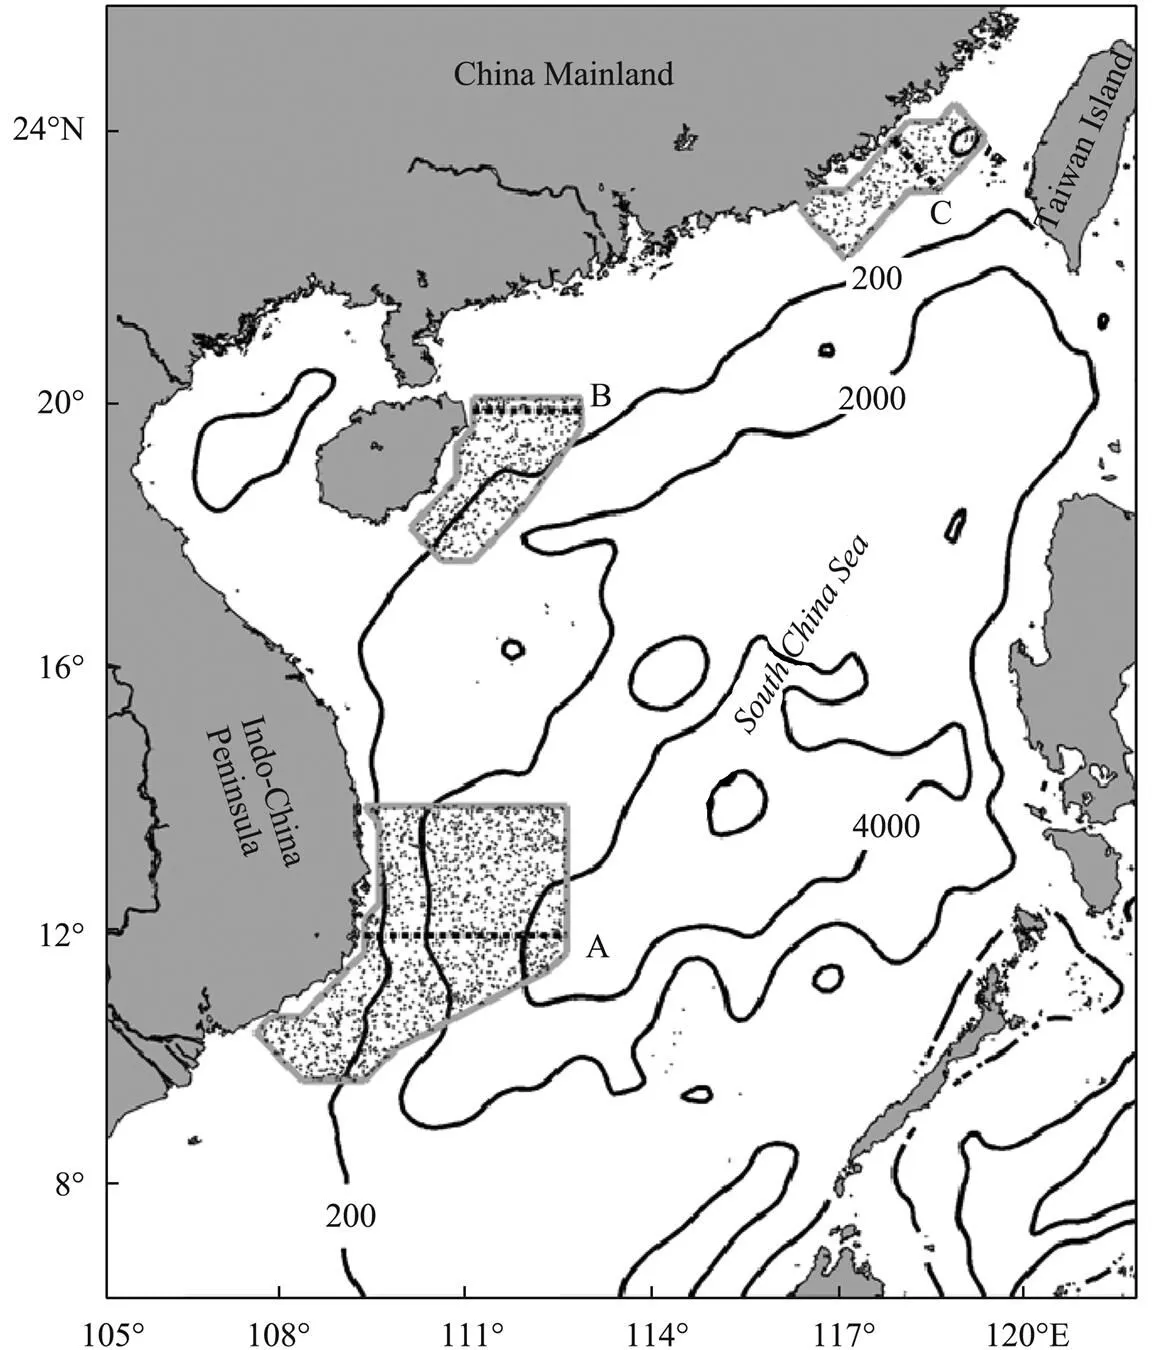
Fig.1 Bathymetry of the South China Sea. Isobaths shown are at 200, 2000, and 4000m. The hatched areas denote the three typical upwelling systems (UESEV, UESEH and USEG from the south to north, respectively), which are the integration ranges in calculating integrated Ekman pumping. Also included are three transects (A, B and C) within each upwelling system.
Wind-driven upwelling can be separated into two dynamic processes (Gargett, 1991; Smith, 1968; Sverdrup, 1942). In the first process, uniform alongshore winds push surface water either toward or away from a solid boundary due to the Earth’s rotation. This effect can force surface coastal water downward, or bring nutrient-rich deeper water into the coastal surface layer in an amount that balances the loss of mass near the coast. This upwelling process is referred to as ‘Ekman transport’. The nutrient enrichment of the water column due to upwelling plays a key factor in supporting the region’s fisheries production. The second process is called ‘Ekman pumping’, resulting from heterogeneous wind field, which generates ocean-surface divergence (convergence). At offshore locations, the upward (downward) velocity at the base of the surface layer induced by Ekman pumping is proportional to the wind stress curl. Since the water temperature usually decreases with depth, the upwelled water will be colder than the surface water that it displaces. Very often it has higher concentrations of nutrients than the surface water, which may have been depleted of nutrients due to the growth of phytoplankton. Consequently, regions of upwelling are usually the regions of high biological productivity. Additionally, the upwelling estimate is important in calculating vertical nitrate fluxes. Regarding this flux estimate, Bombar(2010) distinguish Ekman transport from turbulent diffusion at stations in adjacent offshore waters. This estimate might help to assess the relative importance of nitrogen inputs from upwelling to other potentially important nutrient sources (, river discharge, nitrogen fixation) and how sensitive the system may be to future changes including climate change and anthropogenic pressures. Bombar(2010) assume that there is a direct link between enhanced primary productivity and the nitrate supply by upwelling.
The process of Ekman transport has been well documented within the SCS.Dippner(2007) analyzed the upwelling dynamics with respect to the peculiarities of Vietnamese upwelling. Ekman transport is estimated using north-south component of the wind stress and the first mode of the radius of deformation (). With the averagedof 42km derived from observations during southwest monsoon in 2003, the calculated theoretical upwelling velocity is 1.82×10s. In a numerical study,Jing(2009) investigated the different effects of wind stress and wind stress curl on the coastal upwelling in UESEH and USEG. They find that the local winds play significant roles in coastal upwelling, but the alongshore wind stress and wind stress curl have different contributions to the upwelling in the two upwelling systems. Their model results show that wind stress is the dominant factor to induce the coastal upwelling, while wind stress curl has little contribution and is even unfavorable to the upwelling in USEG. Nevertheless, wind stress curl has even more contribution to the upwelling than alongshore wind stress does in UESEH. Zhao and Tang (2007) related the interannual variation of chlorophyll-distribution to Ekman pumping and Ekman transport. On the basis of this relationship, they suggest Ekman pumping is important for the high Chl-concentrations in the WCSCS, whereas a jet-shape high Chl-region offshore is associated with coastal upwelling driven by offshore Ekman transport in the summer. Ekman transport upwelling off the Vietnamese coast occurred with a vertical motion of 1.4 and 1.8 md−1 in 2003 and 2004, respectively (Bombar, 2010).This intensity of upwelling is much lower than, for example, off Peru, where Ekman velocity is as high as 36md(Brink, 1981).
During summers that follow El Niño events, average wind speeds are lower compared to the climatological mean, and the upwelling intensity is reduced. The weakening of the southwest monsoon in summer in the SCS following El Niño is due to the suppressed atmospheric convection in the tropical Northwest Pacific and the resultant large-scale anti-cyclonic circulation (Xie, 2003, 2009), which is in turn due to the Indian Ocean warming and its capacitor effect (Du, 2009). For the coastal region off southern central Vietnam,Xie(2003) reported that Ekman velocity is between 1.7mdand 2.2mdaveraged over southwest monsoon periods from 2000–2002. Interestingly, all these years represent conditions of the climatological mean, that is, clear upwelling structures can be observed on SST satellite images (Dippner, 2007). Jing(2011) estimated Ekman transport in three upwelling regions of the SCS. They found that offshore Ekman transport in UESEH and USEG in 1998 summer is twice the average of normal years, and is identified as the major dynamic factor to induce the abnormally strong upwelling in the NSCS during 1998 summer.
The aim of the present paper is to quantitatively estimate the intensity of two upwelling processes in the upwelling active areas along the WCSCS. To do this, we analyzed fine-scale surface winds for the period over the time-span of QuikSCAT. It is shown that the Ekman transport due to alongshore winds and Ekman pumping due to offshore wind stress curl play different roles in the three upwelling systems. The structure for the remainder of this paper is as follows: Section 2 describes the data and methods we use; Section 3 presents some basic characteristics of the wind stress and its curl in summer; Section 4 discusses the two processes of wind-driven upwelling in detail; and Section 5 concludes the paper with a relevant synthesis.
2 Data and Methods
Weekly gridded QuikSCAT data with a spatial resolution of 0.25˚×0.25˚ archived at the Asia-Pacific Data-Research Center (APDRC) are used in this study. The analysis of satellite winds covers the period from May 2000 to September 2009. The SeaWinds scatterometer is a scanning microwave radar that infers the surface wind stress from measurements of radar backscatter from the roughness of the sea surface at multiple antenna look angles (Naderi, 1991). Launched in 1999, the QuikSCAT satellite has became one of the most useful meteorological satellites ever to orbit the Earth. Scatterometer wind retrievals are accurate to better than 2ms
We use the weekly averages in order to obtain good estimates of wind stress curl at timescales required for upwelling development. From these QuikSCAT data, we can estimate the relative importance of strictly coastal upwelling due to Ekman transport and offshore upwelling due to Ekman pumping. We follow the general methods of Pickett and Paduan (2003) who used wind stress estimates from large-scale atmospheric models to study these processes in the California Current system as a whole. To do this, we first convert weekly QuikSCAT wind components to wind stress using the drag coefficient proposed by Smith (1988). Then, the Ekman transport at every coastal grid point,(msper meter of coast), is calculated from Smith (1968)

whereρis the density of seawater, which is assumed constant at 1024kgm;¦is the Coriolis parameter;is the weekly wind stress vector at the grid point nearest to the coast; andis a unit vector tangent to the local coastline. The unit vector for each coastal grid point is generated by fitting a straight line through a 50-km section of coastline, and calculating the orthogonal with respect to this line. This result is an Ekman transport value for each coastal grid point. The Ekman pumping velocity (EPV) is calculated from Smith (1968)
.(2)
The EPV is then integrated out to a certain distance off- shore in order to obtain a vertical transport at every coastal grid point (msper meter of coast), which could be compared directly to the Ekman transport obtained by (1). The distance offshore for each coastal grid point is chosen based on both the low SST and the extensions of positive wind stress curl as shown in Figs.2 and 3 respectively.

Fig.2 Climatological monthly AVHRR SST in the SCS during the upwelling season.
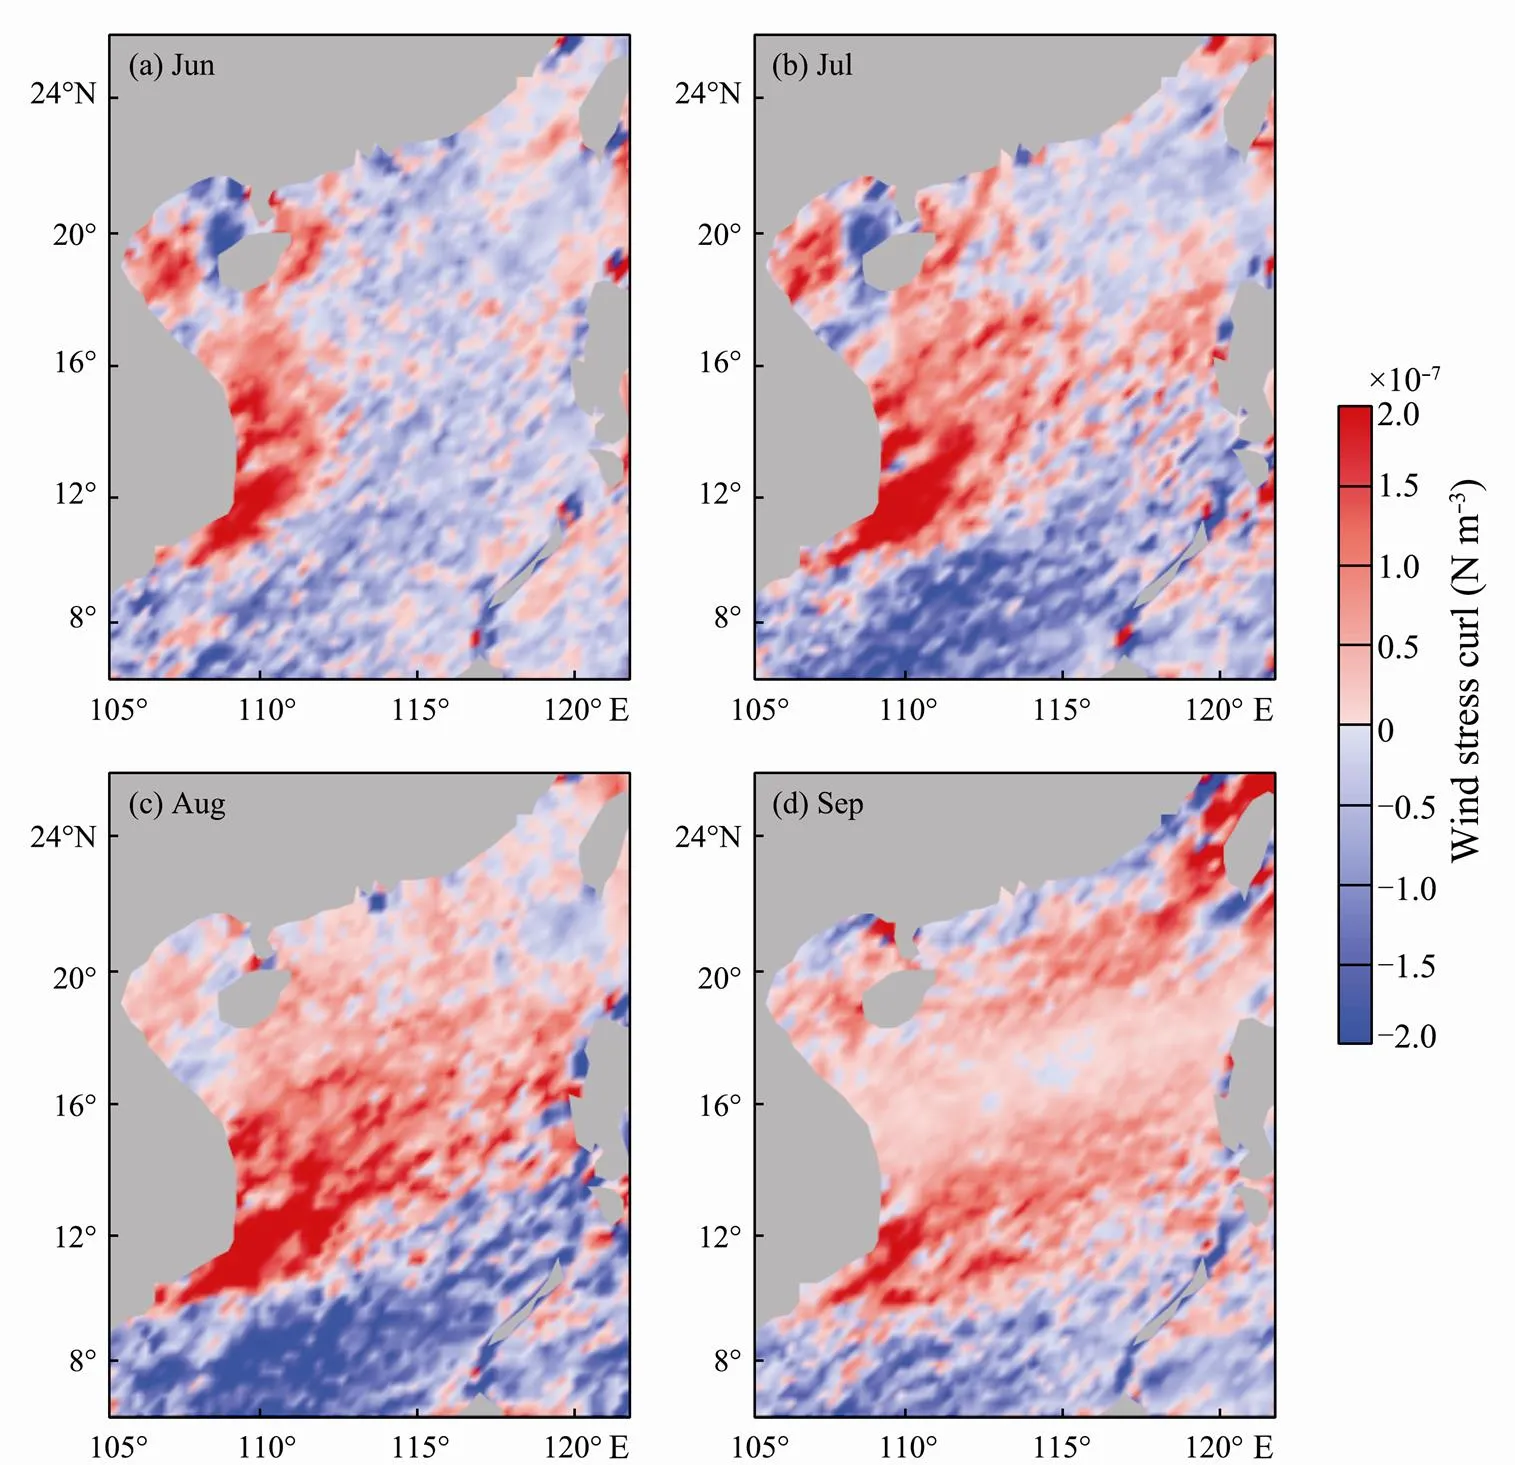
Fig.3 Climatological monthly mean of QuikSCAT wind stress curl (Nm−3) in the SCS during the upwelling season.
After the Ekman pumping is converted to vertical transport, we have two independent upwelling estimates: one due to Ekman transport, and the other due to integrated Ekman pumping. An Ekman transport estimate is available at every coastal grid point; an integrated Ekman pumping estimate is available for each orthogonal at every coastal grid point. One typical transect (black dotted lines labeled A, B and C in Fig.1) is chosen for each upwelling system. We then compare these two upwelling estimates for each transect.
In order to directly compare the upwelling velocities induced by the two wind-driven upwelling processes, Ekman transport is converted to vertical velocity by dividing it by a Rossby radius of deformation, which is the approximate offshore scale of an upwelling zone (Allen, 1973; Gill, 1982),

whereRis the Rossby radius of deformation. From observations during southwest monsoon 2003, a radius of deformation of approximately 42km is derived (Dippner, 2007). We use 40km, 20km and 20km as the Rossby radius for UESEV, UESEH and USEG, respectively, which are based on previous estimates for those regions (Cai, 2008; Dippner, 2007; Gan and Cai, 2001). The resulting upwelling velocity due to Ekman transport (ETV) estimate is then compared to EPV.
3 Wind Stress and Wind Stress Curl in the Three Upwelling Systems
The June–September wind stress and wind stress curl are shown in Figs.4 and 3, respectively. The wind stress maximum during summer occurs east and southeast of Vietnam with a center at (110.5˚E, 10˚N). The surface winds are typically from the southwest over the area of UESEV with the wind stress as large as 0.1Nm. Whereas, in the area of UESEH, the summer winds are largely from the south with the wind stress about 0.03NmNm
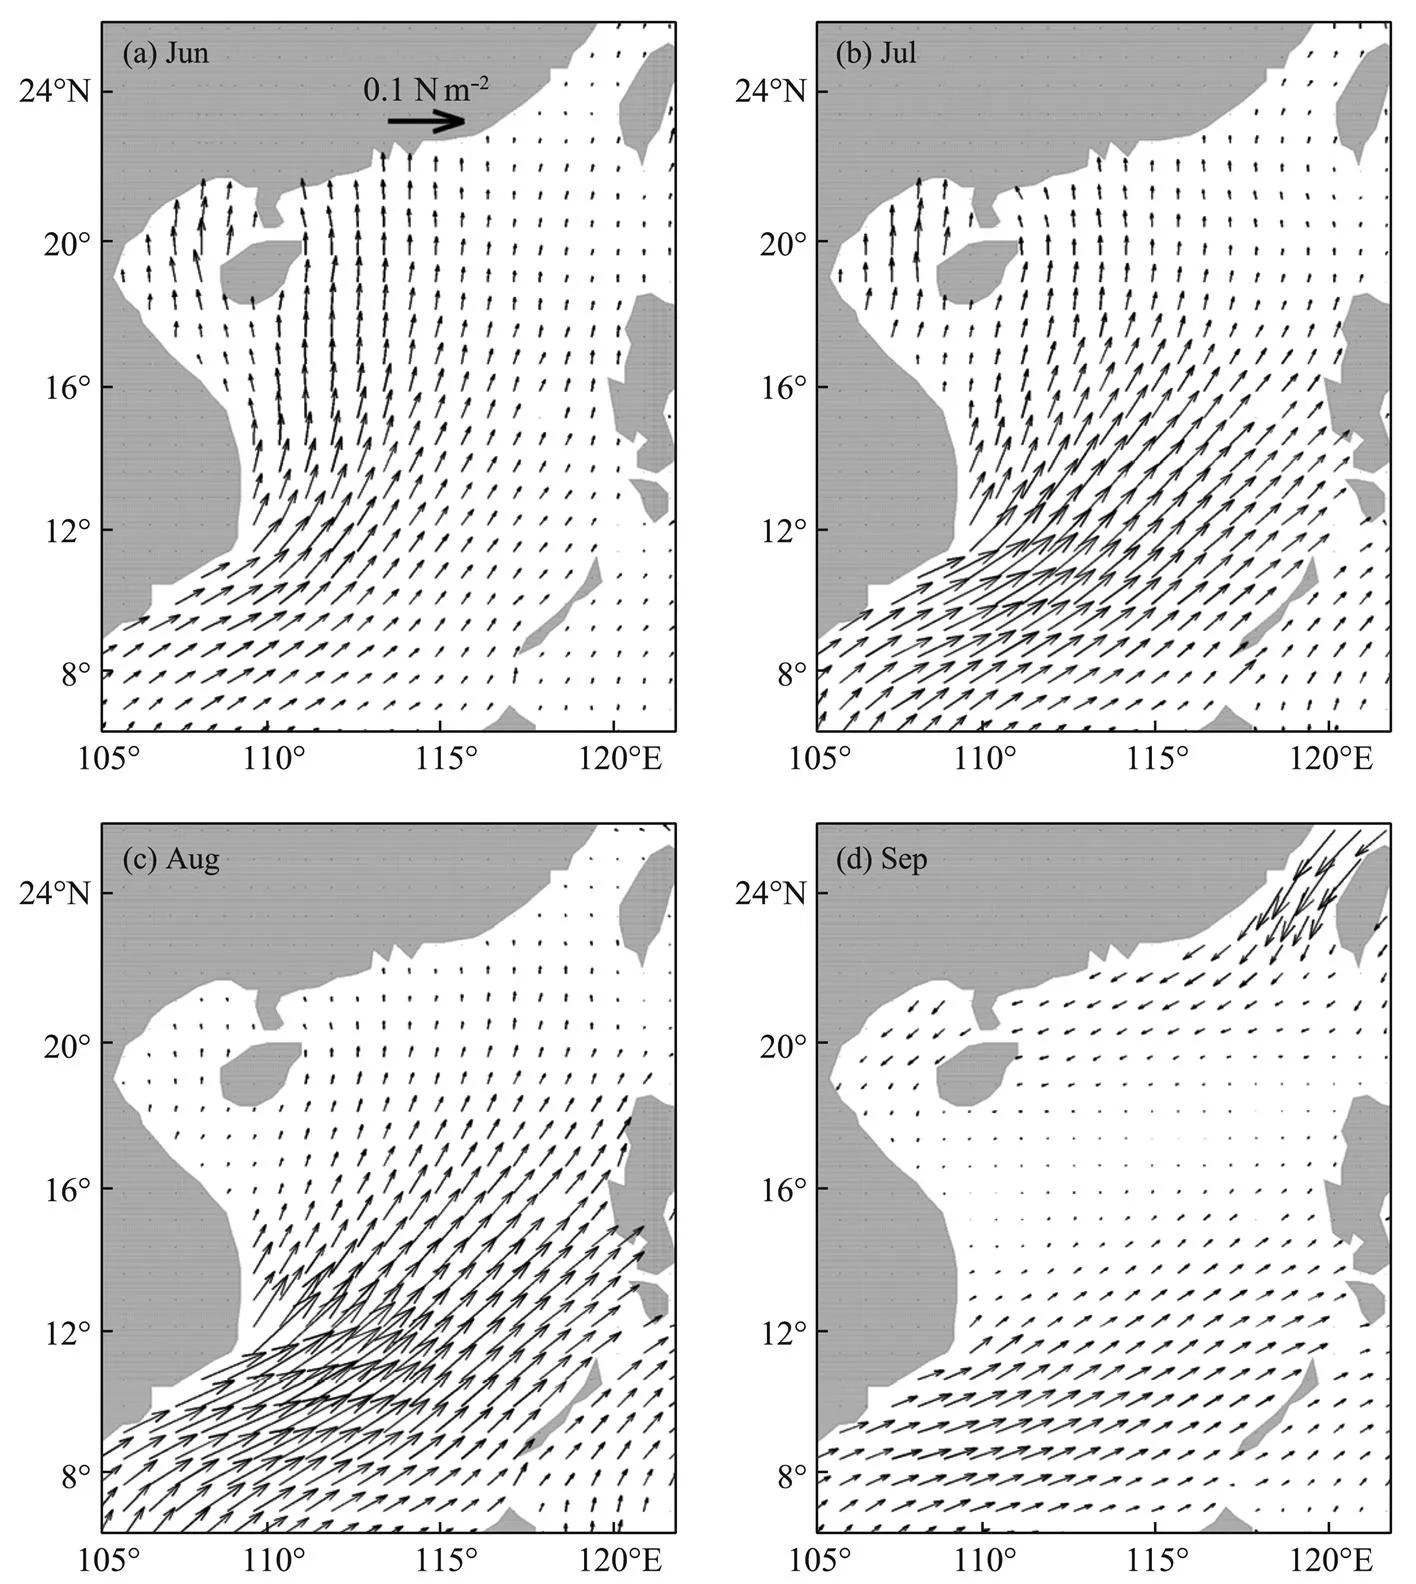
Fig.4 Climatological monthly mean of QuikSCAT wind stress (Nm−2) in the SCS during the upwelling season. Every third vector is shown.
The wind stress curl in the area of UESEV and UESEH is positive throughout the summer period (Fig.3). The positive curl north of the southwest wind jet around 12˚N is due to the blockage of Vietnam coastal mountains, as demonstrated with numerical modeling by Xu(2008). The curl maximizes in July and August in UESEV with its center at (110˚E, 12˚N), while it maximizes in June and July in UESEH with the maximum area hugging the coast. Note that these are approximately the same regions as the cold water extension in Fig.2. However, the wind stress curl in the area of USEG is spatially variable throughout the upwelling season.
4 Ekman Transport and Ekman Pumping
4.1 System-Wide Upwelling
In order to quantify the relative importance of upwelling driven by coastal Ekman transport and offshore Ekman pumping, they are integrated along the coast within each upwelling system (Fig.5).
Both transport estimates of the three upwelling systems have significant variability from May to September. In the area of UESEV (Fig.5a), both Ekman transport and Ekman pumping are high, and of the same magnitude. The Ekman transport increases linearly from 0.49Sv in May to 1.23Sv in August, while the Ekman pumping increases from 0.36 to 1.22Sv during the same period. Thereafter, Ekman transport and Ekman pumping decrease to 0.75Sv and 0.88Sv in September, respectively. The summer averages of Ekman transport and Ekman pumping are 1.08 and 1.01Sv, respectively. In other words, Ekman pumping is of the same intensity as Ekman transport in summer, doubling the amount of upwelling one would predict by considering upwelling solely due to coastal divergence.
In the area of UESEH (Fig.5b), Ekman transport and Ekman pumping have magnitudes close to each other from May to August. Ekman transport peaks in June and July with the magnitude of 0.17Sv, while Ekman pumping peaks in July and August with the magnitude of 0.08Sv. The summer averages of Ekman transport and Ekman pumping are 0.14 and 0.07Sv, respectively, which indicates that 33% of the total wind-driven upwelling is actually due to Ekman pumping (peaks in August). Upwelling driven by wind stress curl strongly decreases in September, while Ekman transport is negative due to the reversal of the wind direction, as expected from Fig.4.
Compared to the upwelling estimates in UESEV and UESEH, those in USEG (Fig.5c) are rather small through- out the summer. The mean Ekman transport is 0.041Sv with the peak in July, while Ekman pumping is close to zero with high monthly variability, which indicates that the wind-driven upwelling in this area is dominated by Ekman transport. This conclusion is in accordance with that found by Jing(2009).
4.2 Upwelling at Three Transects
In order to assess the contributions of both the mechanisms to the total upwelling transport at specific locations, one typical transect is chosen within each upwelling system in the WCSCS. Transport due to Ekman pumping is calculated by integrating the Ekman pumping velocities over the whole length of each transect so as to obtain a vertical transport that could be compared with the Ekman transport directly (Fig.6).
For transect A within UESEV (Fig.6a), Ekman pumping is generally twice as large as Ekman transport. The summer mean Ekman transport and Ekman pumping are 1.70 and 3.71msper meter of coastline, respectively. Therefore, Ekman pumping is actually more important in causing localized upwelling than Ekman transport in this area. In other words, 69% of the total wind-driven upwelling is due to Ekman pumping near 12˚N during summer. Both the Ekman transport and Ekman pumping in May and September are of the same magnitudes as those in summer, indicating the long-period persistence of the southwest monsoon wind as well as its spatial gradient in this area.
For transect B within UESEH (Fig.6b), the combination of Ekman pumping is close to that of Ekman transport with the summer averages of 0.52 and 0.65msper meter of coastline, respectively. This indicates a 45% contribution of Ekman pumping to the total wind-driven upwelling. The magnitudes of the two estimates are relatively smaller in May due to the weak winds. On the other hand, both Ekman pumping and Ekman transport are unfavorable to the development of upwelling inshore, nor offshore in September, because of the wind direction reversal in this period.
For transect C within USEG (Fig.6c), the summer averages of Ekman transport and Ekman pumping are 0.1 and −0.04msper meter of coastline, respectively. This indicates that the Ekman pumping bears little or even negative contribution, while the Ekman transport domi-nates the total wind-driven upwelling in this representative region. Therefore, Ekman transport induced by the alongshore winds combined with other mechanisms (topographic effects, tidal mixing and islands) could help explain the occurrence of the low SST in this area during summer (Cai and Lennon, 1988; Hu, 2003). In May and September, the northeast winter monsoon prevails over Taiwan Strait and generates downwelling due to the onshore Ekman transport.
4.3 Upwelling Velocities
Zonal profiles of wind stress, wind stress curl, and vertical velocity estimates from both processes along the three typical transects are compared in Figs.7–9.

Fig.7 Profiles along transect A within UESEV: (a) alongshore wind stress, (b) wind stress curl, (c) wind-induced vertical velocities, and (d) cumulative Ekman transport integrated eastward from the coast. Small solid circles in panel (c) represent wP due to Ekman pumping by the wind stress curl, except the one with open circle represents wT due to strictly coastal upwelling.
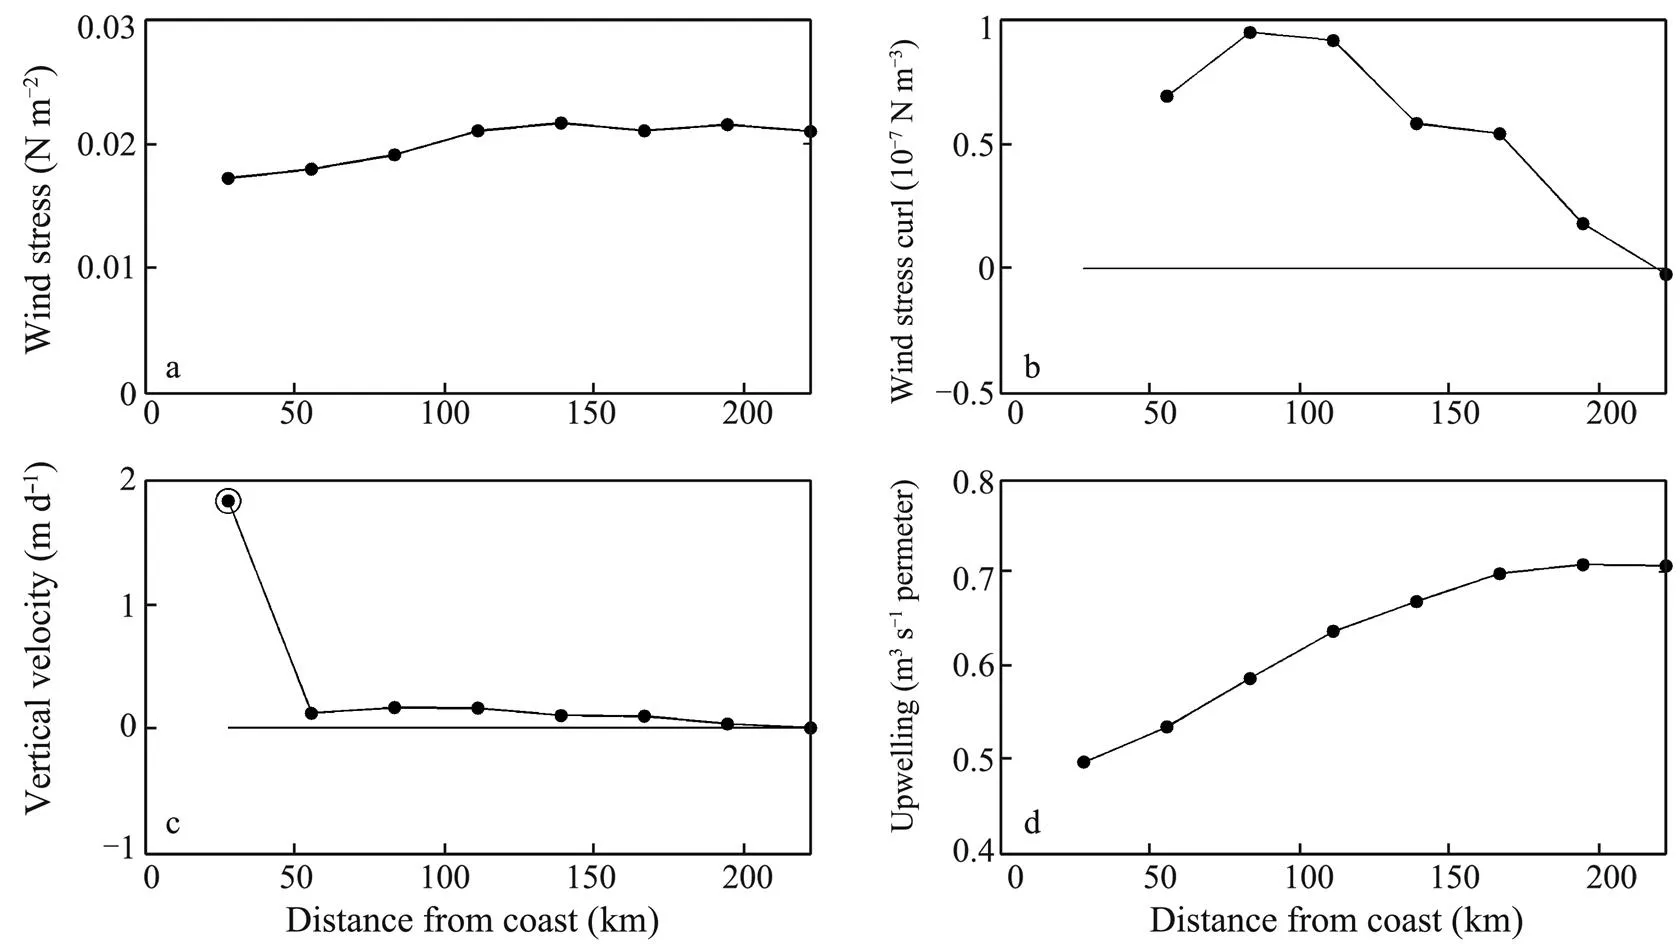
Fig.8 Profiles along transect B within UESEH: (a) alongshore wind stress, (b) wind stress curl, (c) wind-induced vertical velocities, and (d) cumulative Ekman transport integrated eastward from the coast. Small solid circles in panel (c) represent wP due to Ekman pumping by the wind stress curl, except the one with open circle represents wT due to strictly coastal upwelling.

Fig.9 Profiles along transect C within USEG: (a) alongshore wind stress, (b) wind stress curl, (c) wind-induced vertical velocities, and (d) cumulative Ekman transport integrated eastward from the coast. Small solid circles in panel (c) represent wP due to Ekman pumping by the wind stress curl, except the one with open circle represents wT due to strictly coastal upwelling.
For transect A, the northward wind stress slightly varies from 0.07Nminshore to 0.05Nmoffshore. The curl is constantly positive and decreases with the offshore distance (Figs.7a–b). For transect B, the alongshore wind stress slightly increases from 0.018Nminshore to 0.021Nmoffshore. The wind stress curl is constantly positive with the maximum locating offshore at 80km (Figs.8a–b). For transect C, the wind stress is generally constant from inshore to offshore area, while the curl is rather patchy and weak (Figs.9a–b).
Specifically, we compare the inshore vertical velocitywand the offshore vertical velocityw. Thew(open circle with a dot inside in Figs.7c, 8c, and 9c) is estimated using the alongshore wind stress data from the first inshore QuikSCAT grid point as formulated by Eq. (3). Estimates of Ekman pumping velocity at offshore locationsw, as defined by Eq. (2), are shown as dots in the same panels. For all transects, the coastal upwelling intensity is much stronger than that offshore. It should also be noted that the coastal upwelling velocities are much larger for transect A (3.1md) and B (1.9md) than that for transect C (0.22md).
中南半岛国家地处相同地理单元,对周边地缘环境均存在敏感性,但各国所处的具体环境又存在差别。以下不妨从各国的接壤强国、历史支配国和领土争议国三个方面进行综合评判。其中“接壤强国”是指当今同该国接壤且相对实力比该国更强的国家(本文主要选取当今各国的面积、人口、GDP和军费开支四项指标进行综合比较);“历史支配国”是指在历史上曾经支配或征服过该国的国家;“领土争议国”是指如今同该国存在领土争议的国家(详见表4)。
There are substantial EPVs for transect A, with the maximum of 1.4mdlocated 78km from the shore. For transect B, there is appreciable EPV over the outer shelf between 50km and 200km offshore (0.18md). EPV is negligible for transect C, wherewis an order of magnitude smaller thanw. The localized downwelling in this area could be an important mechanism for subducting high chlorophyll waters out of the surface layer.
Although the vertical velocities associated with Ekman pumping are generally small, the cumulative effect can be important (Figs.7d and 8d). For transect A, the vertical transport due to coastal upwelling is 1.8msper meter of coastline, while the net vertical transport including Ekman pumping along the entire transect increases to 4.2msper meter of coastline. For transect B, the coastal upwelling contributes 0.5msper meter of coastline, whereas Ekman pumping adds 0.2msper meter of coastline to the total vertical transport. In contrast, the coastal upwelling is rather small for transect C (0.06 msper meter of coastline), and the Ekman pumping hardly contributes to or even decreases the total vertical transport (Fig.9d).
4.4 Transport and Pumping Comparisons
Time series of Ekman transport and integrated Ekman pumping as well as their summer (June-July-August) averages for each transect are shown in Fig.10. For transect A, Ekman pumping is the dominant process, generally about twice as large as the Ekman transport except for years 2002 and 2009. Moreover, Ekman transport varies slightly over the study period, while the Ekman pumping demonstrates significant variability. For transect B, both transports are much smaller than those estimated for tran- sect A within UESEV. On the other hand, Ekman pumping transport is more important in contributing to the total upwelling estimate in some years (, 2002, 2006). For the northernmost transect, Ekman transport largely remains positive with a small magnitude, while the Ekman pumping transport is close to zero or even negative.
By adding the Ekman transport for all the shoreline grid points and integrating Ekman pumping over its corresponding orthogonal at each grid point, we compared the two processes within the three upwelling systems. Fig.11 shows the weekly variations of Ekman transport and Ekman pumping during the summer periods as well as their summer averages. In UESEV, both estimates have close magnitudes. However, Ekman pumping is more variable than Ekman transport. It should also be noted that the two upwelling process variations are highly correlated. The correlation coefficient between Ekman pumping transport and Ekman transport is 0.74, significant at 95% confidence level. Quite different from the co-variance relationship between Ekman transport and Ekman pumping in UESEV, the Ekman transport is more variable than Ekman pumping in USEG, while the two estimates both have high variance in UESEH.
These estimates suggest that the alongshore wind stress and wind stress curl make different contributions to the Ekman upwelling dynamics among the three typical upwelling systems in the WCSCS. The alongshore wind stress is the key factor to induce upwelling in the NSCS (including the areas of UESEH and USEG), whereas the upwelling is strongly related to the local wind stress curl east of Vietnam.

Fig.10 Time series of Ekman transport (dotted black line) and integrated Ekman pumping (gray line) for each transect: (a) A within UESEV, (b) B within UESEH and (c) C within USEG. The horizontal bars are their summer (June-July-August) averages of each year accordingly.

Fig.11 Time series of Ekman transport (dotted black line) and Ekman pumping (gray line) integrated over each upwelling system: (a) UESEV, (b) UESEH and (c) USEG. The horizontal bars are their summer (June-July-August) averages of each year accordingly.
4.5 Upwelling in Years 2003 and 2007
ENSO is the dominant mode of climate variability that exerts profound influence on the SCS (Du, 2009; Wang, 2003; Xie, 2009). Previous studies have found that the upwelling in UESEV is weakened while it is strengthened in UESEH and USEG in 1998 summer, because of the anticyclonic atmospheric circulation anom- aly over the NSCS and the weakened southwesterly monsoon in the southern part of the basin (Jing, 2011; Wang, 2010; Xie, 2003). Due to the fact that the 1997–1998 El Niño event is the strongest one on records in the past few decades (McPhaden, 1999; Wang and Weisberg, 2000), the question arises whether previous conclusions for 1998 summer also hold for 2003 and 2007 summers, for the upwelling under consideration also follows ENSO events with relatively weaker strength within the time-span of QuikSCAT.
5 Conclusions
It is well-known that summer upwelling occurs in three typical regions in the WCSCS. The majority of previous studies attribute the upwelling to coastal divergence, which is due to inshore Ekman transport. The lack of high-resolution wind data with good temporal and spatial coverage has prevented the assessment of the importance of Ekman pumping due to offshore wind stress curl. In this study, relative roles of Ekman transport and Ekman pumping in the upwelling-active areas along the WCSCS are examined using QuikSCAT scatterometer wind data.
The regions over UESEV and UESEH are characterized by positive wind stress curl in summer, while in USEG the curl is small and without uniform spatial distribution. It is shown that the Ekman transport due to alongshore winds and Ekman pumping due to offshore wind stress curl play different roles in the three upwelling systems. In the area of UESEV, Ekman pumping is of the same intensity as Ekman transport, doubling the amount of upwelling predicted if solely considering coastal divergence.
Compared to the estimates in UESEV, 33% of the total wind-driven upwelling is due to Ekman pumping in the area of UESEH, indicating that the wind-driven upwelling in this area is dominated by Ekman transport. However, in USEG, the upwelling is mostly related to the local wind stress.
In the summer of years 2003 and 2007 following warm ENSO events, both Ekman transport and Ekman pumping decreased in UESEV due to the abnormally weak southwest monsoon. During the same event, however, Ekman transport was mildly increased compared to normal condition while Ekman pumping was decreased. This also holds true in USEG excepting that the Ekman pumping in this area does not demonstrate a linear response to the ENSO events. These findings are different from the case of the strongest 1997–1998 El Niño as documented in previous studies.
Even though we have estimated the relative roles of Ekman pumping and Ekman transport in the three upwelling systems in the SCS, a more accurate and detailed estimate could be obtained by using high-resolution wind data or model-simulated wind product. Increased resolution would not only allow Ekman pumping to be included, but would also better depict the small-scale, intense upwelling bands inshore.
Acknowledgements
The authors are indebted to Kate Bentsen and Peng Jia for their helpful comments. The authors also thank the China Scholarship Council for sponsoring Dakui Wang’s visit to Horn Point Laboratory of University of Maryland. Dakui Wang and Hui Wang were supported by the National Nature Science Foundation of China (Grants Nos. 41076011, 40531006, 41106024 and 40976014) and the National Basic Research Program of China (Grant No. 2011CB403600).
Allen, J. S., 1973. Upwelling and coastal jets in a continuously stratified ocean., 3(3): 245-257.
Bombar, D., Dippner, J. W., Doan, H. N., Ngoc, L. N., Liskow, I., Loick-Wilde, N., and Voss, M., 2010. Sources of new nitrogen in the Vietnamese upwelling region of the South China Sea., 115(C6), DOI:10.1029/2008JC005154.
Brink, K. H., Jones, B. H., Van Leer, J. C., Mooers, C. N. K., Stuart, D. W., Stevenson, M. R., Dugdale, R. C., and Heburn, G. W., 1981. Physical and biological structure and variability in an upwelling center off Peru near 15℃ during March, 1977. In:, Vol. 1. Richards, F. A., ed., AGU, Washington, D. C., 473-495, DOI: 10.1029/CO001p0473.
Cai, S. Q., Long, X. M., Wu, R. H., and Wang, S. G., 2008. Geographical and monthly variability of the first baroclinic Rossby radius of deformation in the South China Sea., 74(1–2): 711-720.
Cai, W. J., and Lennon, G. W., 1988. Upwelling in the Taiwan Strait in response to wind stress, ocean circulation and topography.,, 26(1): 15-31.
Dippner, J. W., Nguyen, K. V., Hein, H., Ohde, T., and Loick, N., 2007. Monsoon-induced upwelling off the Vietnamese coast., 57(1): 46-62.
Du, Y., Xie, S. P., Huang, G., and Hu, K. M., 2009. Role of air-sea interaction in the long persistence of El Niño-induced North Indian Ocean warming., 22:2023-2038.
Freilich, M. H., and Dunbar, R. S., 1999. The accuracy of the NSCAT 1 vector winds: Comparisons with National Data Buoy Center buoys., 104(C5): 11231-11246.
Gan, Z. J., and Cai, S. Q., 2001. Geographical and seasonal variability of Rossby radii in South China Sea., 20(1): 1-9.
Gargett, A. E., 1991. Physical Processes and the Maintenance of Nutrient-Rich Euphotic Zones., 36(8): 1527-1545.
Ho, C. R., Zheng, Q. A., Song, Y. S., Kuo, N. J., and Hu, J. H., 2000. Seasonal variability of sea surface height in the South China Sea observed with TOPEX/Poseidon altimeter data.,105(C6): 13981-13990.
Hu, J. Y., Kawamura, H., Hong, H. S., and Pan, W. R., 2003. A review of research on the upwelling in the Taiwan Strait., 73(3): 605-628.
Jing, Z. Y., Qi, Y. Q., and Du, Y., 2011. Upwelling in the continental shelf of northern South China Sea associated with 1997–1998 El Niño., 116(C2): C02033.
Jing, Z. Y., Qi, Y. Q., Hua, Z. L., and Zhang, H., 2009. Numerical study on the summer upwelling system in the northern continental shelf of the South China Sea., 29(2): 467-478.
Kuo, N. J., Zheng, Q. A., and Ho, C. R., 2000. Satellite observation of upwelling along the western coast of the South China Sea., 74(3): 463-470.
Lau, K. M., Wu, H. T., and Yang, S., 1998. Hydrologic processes associated with the first transition of the Asian summer monsoon: A pilot satellite study., 79(9): 1871-1882.
Liu, W. T., and Xie, X., 1999. Spacebased observations of the seasonal changes of south Asian monsoons and oceanic re- sponses., 26(10): 1473-1476.
McPhaden, M. J., 1999. Genesis and evolution of the 1997–98 El Niño., 283(5404): 950.
Naderi, F. M., Freilich, M. H., and Long, D. G., 1991. Spaceborne radar measurement of wind velocity over the ocean–An overview of the NSCAT scatterometer system., 79(6): 850-866.
Pickett, M. H., and Paduan, J. D., 2003. Ekman transport and pumping in the California Current based on the U.S. Navy’s high-resolution atmospheric model (COAMPS).,108(C10), 3327, DOI:10.1029/2003JC001902.
Shaw, P. T., and Chao, S. Y., 1994. Surface circulation in the South China Sea., 41(11-12): 1663-1683.
Smith, R. L., 1968. Upwelling. In:. Barnes, H., ed., George Allen and Unwin Ltd., Vol. 6, 11-46.
Smith, S. D., 1988. Coefficients for sea surface wind stress, heat flux, and wind profiles as a function of wind speed and temperature., 93(C12): 467-472.
Wang, B., Wu, R. G., and Li, T., 2003. Atmosphere–warm ocean interaction and its impacts on Asian–Australian monsoon variation., 16(8): 1195-1211.
Wang, C., and Weisberg, R. H., 2000. The 1997–98 El Niño evolution relative to previous El Niño events., 13(2): 488-501.
Wang, G. H., Wang, C. Z., and Huang, R. X., 2010. Inter- decadal variability of the eastward current in the South China Sea associated with the summer Asian monsoon., 23(22): 6115-6123.
Wyrtki, K., 1961. Scientific results of marine investigations of the South China Sea and the Gulf of Thailand 1959–1961., Vol. 2.
Xie, S. P., Hu, K. M., Hafner, J., Tokinaga, H., Du, Y., Huang, G., and Sampe, T., 2009. Indian Ocean capacitor effect on Indo-western Pacific climate during the summer following El Niño., 22(3): 730-747.
Xie, S. P., Xie, Q., Wang, D. X., and Liu, W. T., 2003. Summer upwelling in the South China Sea and its role in regional climate variations., 108(C8), 3261, DOI:10.1029/2003JC001867.
Xu, H. M., Xie, S. P., Wang, Y. Q., Zhuang, W., and Wang, D. X., 2008. Orographic effects on South China Sea summer climate., 100(1): 275-289.
Zhao, H., and Tang, D. L., 2007. Effect of 1998 El Niño on the distribution of phytoplankton in the South China Sea., 112(C2), C02017, DOI:10.1029/2006JC003536.
(Edited by Xie Jun)
10.1007/s11802-013-1904-7
ISSN 1672-5182, 2013 12 (3): 355-365
. Tel: 0086-10-62102594 E-mail: wangdk@nmefc.gov.cn
(November 1, 2011; revised November 23, 2011; accepted November 25, 2012)
© Ocean University of China, Science Press and Springer-Verlag Berlin Heidelberg 2013
猜你喜欢
杂志排行

Journal of Ocean University of China的其它文章
- Evaluation of Antitumor, Immunomodulatory and Free Radical Scavenging Effects of A New Herbal Prescription Seaweed Complex Preparation
- Shallow Water Body Data Processing Based on the Seismic Oceanography
- Prediction of China’s Submerged Coastal Areas by Sea Level Rise due to Climate Change
- A Homogeneous Linear Estimation Method for System Error in Data Assimilation
- The Suspended Sediment Concentration Distribution in the Bohai Sea, Yellow Sea and East China Sea
- Macrobenthic Community in the Xiaoqing River Estuary in Laizhou Bay, China