Electroretinogram and Histopathologic Changes of the Retina after Methanol Intoxication
2013-05-19CHENJieminZHUGuangyouZHAOZiqinXIAWentao
CHEN Jie-min,ZHU Guang-you,ZHAO Zi-qin,XIA Wen-tao
(1.Shanghai Key Laboratory of Forensic Medicine,Institute of Forensic Science,Ministry of Justice,P.R.China,Shanghai 200063,China;2.Department of Forensic Medicine,Shanghai Medical College of Fudan University,Shanghai 200032,China)
As a common and inexpensive industrial material,methanol has been accidentally or deliberately sold as liquor due to their similar smell,which leads to severe intoxication in corresponding consumers.Methanol exposure in occupational or daily life is another common intoxication factor.Methanol has been recognized as a human visual neurotoxin for more than a century.The clinical features of methanolintoxication have been documented as metabolic acidosis,coma,dysopia and even death after a latent period of 1-3 days.Diplopia,dysopia or even blindness are the main symptoms of visual toxicity[1-2].As an ancient toxicant,researches based on vision toxicity of methanol have been performed on both methanolitselfand its metabolites as formaldehyde and formic acid, and found its metabolites could accumulate toxins in human body and cause toxic effects.The metabolites are more harmful than methanol itself[3-5].The formic acid is recognized as the most important direct substrate accumulating in the aqueous humor and vitreous humor.It inhibits the oxidative phosphorylation process and interferes in the electron-transfer process of mitochondria,which eventually blocks the synthesis of ATP[6]so that the retinal energy metabolism is inhibited with its function and structure disrupted.
In methanol metabolism,the 10-formyltetrahydrofolate dehydrogenase (10-FDH),whose concentration in humans is only 26%of that in rats,mediates the oxidation of formic acid.Therefore,humans are more sensitive to methanol than rodent animals[7].To mimic human intoxication,inhaling the mixed gas[V(N2O)∶V(O2)=1∶1]can reduce the concentration of 10-FDH in rats.This rodent model which is called FR rat is regarded as reliable for methanol-poisoning research[8].Some studies have reported that ganglion cells are the primary site of intoxication,but this is not supported by other research.Recent research indicates that muller cells and the outer layer of the retina are first damaged and the alteration of ganglion cells is considered as a secondary injury[9-10].Seme et al.[11]showed that different doses of methanol intoxication caused different damage in different kinds of retinal cells.In order to clarify the diversity,this research proceeded on the basis of previous results and studied the changes of retinal function and structure in different doses of methanol intoxication.
Materials and methods
Materials and animal specimens
The nitrous mixture[V(N2O)∶V(O2)=1∶1]was obtained from the Shanghai Shenwei Medical Gas Co.,LTD.Methanol and chloral hydrate(reagent grade) were obtained from the China National Medicines Corporation,LTD.All other chemicals(glutaraldehyde,phosphate,osmium tetroxide,acetone,formaldehyde and butylalcohol) were of reagent grade or higher.The Sprague Dawley rats(male,n=35,200-250 g) without any ophthalmopathy (Experimental Animal Center,Fudan University),used to establish the model of methanol intoxication,were supplied with food and water ad libitum in a standard temperature and humid environment.Illumination was controlled on dark-light and 12-hour schedule.All animal experiments were approved by ethical certification and performed according to the AVRO Statement for the Use of Animals in Ophthalmic and Vision Research.
Thirty-five SD rats were maintained in a sealed plexiglas chamber which was filled with mixture gas[V(N2O)∶V(O2)=1∶1,flow rate=2 L/min]for 4 hours before gavage administration of methanol and saline.The mixture gas was continued to supply until the end of the animal experiment in order to adequately mimic human intoxication by reducing the concentration of 10-FDH in rats.The animals were randomly classified into 5 groups with 7 rats in each group.Group A (control group)was treated with saline;Group B (3-day high dose group) and C(7-day high dose group) were treated with high-dose methanol(8 mL/kg,per os,followed by 4 mL/kg supplemental doses 36 hours later);Group D (3-day low dose group) and E (7-day low dose group)were treated with low-dose methanol(4 mL/kg,per os,followed by 2 mL/kg supplemental doses 36 hours later).Three days after first gavage administration,flash electroretinogram (F-ERG)analysis of Group B and D was performed.The animals were then killed by cervical dislocation and their blood was extracted from the cardiac chambers to the ethylene diamine tetraacetic acid (EDTA) anticoagulation tube by injector for testing the methanol blood concentration.The retina wasprepared forhistological analysis after enucleating the eyeball.After 7 days,Group C and E were treated in accordance with Group B and D.At the same time,Group A(control group)was performed F-ERG analysis after 3 and 7 days sequentially,the blood and retina were prepared for the control test.
F-ERG analysis
F-ERG analysis was performed recording as instructed by the InternationalSociety forClinical Electrophysiology of Vision (ISCEV).Sufficient dark adaptation was necessary for every test animal before the F-ERG examination.The SD rats were put into the dark environment for four hours to ensure that their eyes became adaptive to the state of absolute darkness.Before the test,the animals were anesthetized with 10% chloralhydrate(3.5 mL/kg,intraperitoneal injection)and positioned on the platform with their heads and limbs fixed.Each pupil was given mydriasis by tropicamide compound.Twenty minutes later,the cornealsurface was anesthetized with tetracaine hydrochloride after sufficient mydriasis.The reference electrode was penetrated into the middle forehead,and the ground electrode inserted into the skin of the ipsilateral-mastoid process.The recording proceeded under a faint red light.
Our experiment used RETIport science(Roland Consult,German)with the stimulator of Ganzfelz Q450.The recording electrode,an annular cornealcontact electrode with a silver-clad copper material and a diameter of 3 mm,was positioned on the corneal.The reference and ground electrodes were inserted into the ratsby acupuncture.And the F-ERG test consisted ofRod-reaction (Rod-R),Max-reaction (Max-R),and Cone-reaction (Cone-R).During the Rod-R and Max-R processes,the light flash intensity was-25 dB and 0 dB,respectively;the stimulus frequency,0.1 Hz;the cycle time,10 s;and the plot time,250 ms.Before the Cone-R test,the rats’eyes needed 5 min for light adaptation.During the Cone-R test,the background luminance was 25 cd/m2;the stimulus flash intensity,0 dB;the stimulus frequency,0.2 Hz;the cycle time,5s;and the plot time,150 ms.The recordings were differentially amplified and averaged by a computer.To diminish the external interference,the amplifier was set at the following voltage (±1 mV) and bandwidth(1-300Hz).
The final F-ERG waveform was analyzed before severalsuperposition;the average can both highlight the reactive wave and reduce the clutter wave.The amplitude of the a-wave was measured from the base to the trough,and the amplitude of b-wave was measured from the trough of the a-wave to the peak of b-wave.The latency of the a-wave was measured from the beginning of the stimulation to the trough of a-wave.The latency of the b-wave was measured from the beginning of the stimulation to the peak.
Histopathologic analysis
The retinal tissues were extracted and prepared for histopathologic analysis.The eyes were enucleated and hemisected,the anterior segment and the vitreous were removed.And some posterior poles were immersed in the fixative(2.67%glutaraldehyde in 0.1 mol/L phosphate buffer at 4℃),fixed in 1%osmium tetroxide for 2 h,dehydrated in a graded acetone series(30%×5min,50%×5min,70%×5 min),and embedded in Epon812.After routine repairing,slicing,and staining,the transmission electron microscopy analysis was performed.Some posterior poles were immersed in the fixative(10%formaldehyde)for light microscopy scanning.After sufficient fixation,the tissues were processed by a normal paraffin section and a HE staining technique procedure.
Methanol blood concentration analysis
The methanol concentration was analyzed by Agilent-6890 headspacegaschromatography (HSGC).The parameter of equipment included:chromatographic column 1,5%carbowax 20 mol/L Carbopack (18-120 items)2 m×2 mm of glass column.The column temperature started at 70℃,and then rose by the rate of 5℃/min until it reached 100℃.In a 0.5 min interval,the temperature continuously rose to 150℃ by the rate of 40℃/min,and maintained for 1.2 min;Column 2,DB-ALC1 capillary column (30 m×0.32 mm×1.2 μm),column temperature with constant 40℃;Column 3,DB-ALC2 capillary column (30m×0.32mm×1.2μm),column temperature with constant 40℃.Detector:flame ionization detector(FID).Detector temperature:250℃ and injection temperature:150℃.
EDTA anticoagulation treatment was necessary fortesting theblood concentration with HSGC.As an inner label,500 μL tertiary butyl alcohol(0.04 mg/mL) was mixed with 1 μL blood sample and injected directly into the HSGC.At the same time,a series of known concentration methanol was mixed with tertiary butyl alcohol as 1:500 and injected into the HSGC for the purpose of a standard curve.Every sample was tested twice by FID 1A and FID 2B.The standard curve of concentrations was established as the y-coordinate representing the concentrations ofmethanoland the x-coordinate showing the average of the ratios of methanol area and tertiary butyl alcohol area.x={[methanol/(CH3)3COH]FID1A+[methanol/(CH3)3COH]FID2B}/2.
Statistical analysis
All values were expressed as±s by SPSS 17.0.The F-ERG analysis was performed on both eyes of each animal.The variables included the values of Max-R(the amplitude of a-wave and b-wave,the latency of a-wave and b-wave) and Cone-R (the amplitude of a-wave and b-wave,the latency of a-wave and b-wave).Independenttwo-sample t-testwas used to determine statistic significance including the differencesbetween thecontrolgroup and every other test group,the difference between Group B and C,the difference between Group D and E,and the difference between Group B and D.The minimum level of significance was taken as P<0.05 for allgroups.Themethanolblood concentration of each group was also calculated.
Results
The F-ERG response
The animal F-ERG recordings were performed as previous described.Compared with the Group A,the other four methanol poisoning groups(Group B,C,D and E)showed prolonged latency and reduced amplitude as a whole.But different doses and time showed different characteristics of changes(Table 1,Table 2,Fig.1 and Fig.2).
Table 1 The latent period and amplitude of Max-R by F-ERG (n=14, ±s)
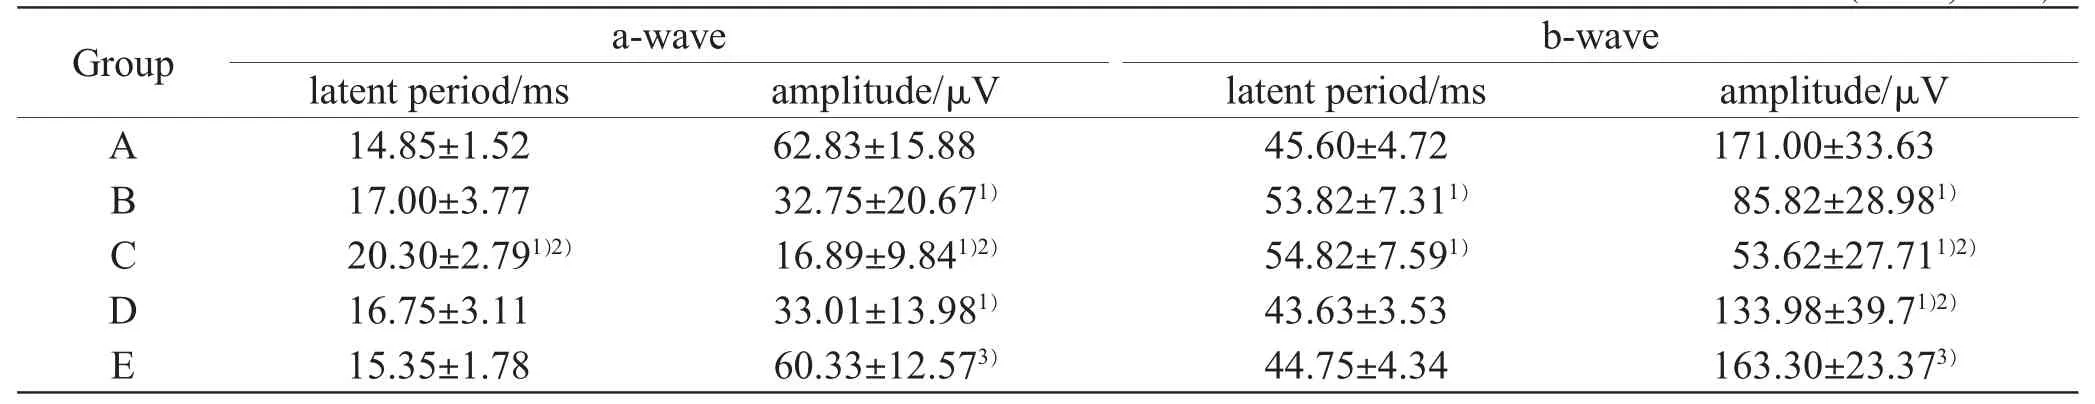
Table 1 The latent period and amplitude of Max-R by F-ERG (n=14, ±s)
1) compared with the control group (Group A),P<0.05;2) compared with Group B,P<0.05;3) compared with Group D,P<0.05
Group a-wave b-wave latent period/ms amplitude/μV latent period/ms amplitude/μV A 14.85±1.52 62.83±15.88 45.60±4.72 171.00±33.63 B 17.00±3.77 32.75±20.671) 53.82±7.311) 85.82±28.981)C 20.30±2.791)2) 16.89±9.841)2) 54.82±7.591) 53.62±27.711)2)D 16.75±3.11 33.01±13.981) 43.63±3.53 133.98±39.71)2)E 15.35±1.78 60.33±12.573) 44.75±4.34 163.30±23.373)
Table 2 The latent period and amplitude of Cone-R by F-ERG (n=14, ±s)

Table 2 The latent period and amplitude of Cone-R by F-ERG (n=14, ±s)
1) compared with the control group (Group A),P<0.05
Group a-wave b-wave latent period/ms amplitude/μV latent period/ms amplitude/μV A 14.11±2.89 9.08±9.09 46.56±3.75 74.80±18.98 B 17.00±3.771) 7.79±4.76 46.42±4.39 49.31±20.741)C 21.89±4.011) 3.92±2.991) 53.44±8.52 35.44±20.241)D 18.67±3.331) 16.18±10.04 46.17±3.49 71.05±23.18 E 14.35±2.06 10.44±6.22 43.11±4.54 72.11±16.67
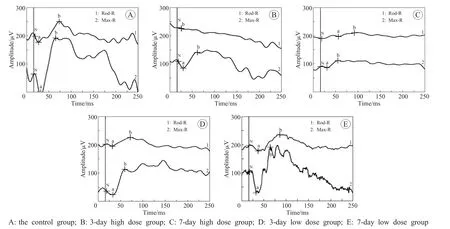
Fig.1 The waveform of the Rod-R and the Max-R of each group
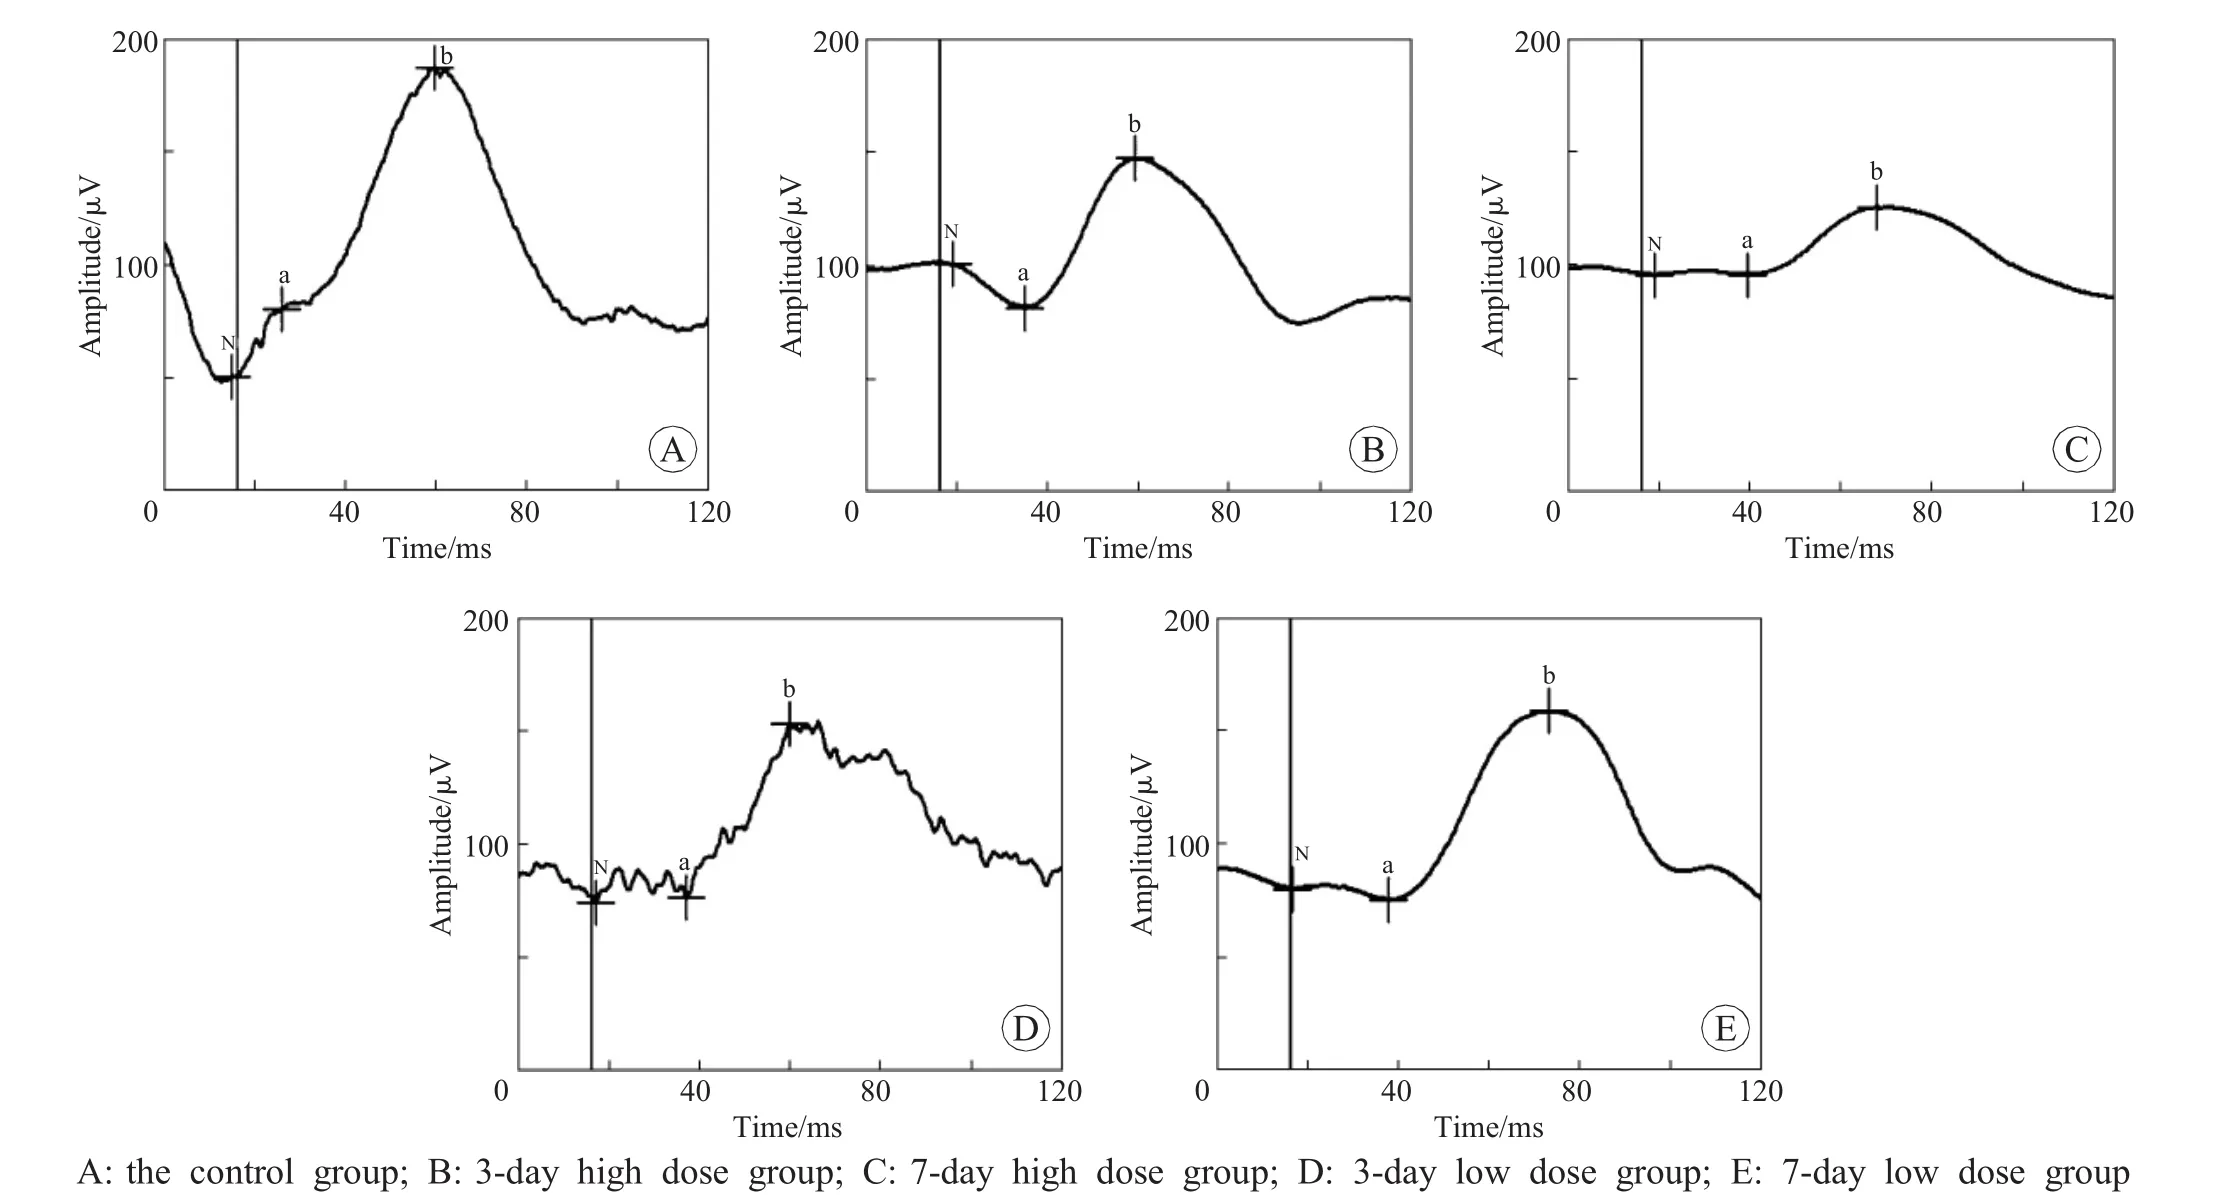
Fig.2 The Cone-R waveform of each group
In the high-dose groups (Group B and C),the a-wave and b-wave amplitude of Group B declined to 50%approximately in the Max-R steps and the b-wave amplitude declined to 66%in the Cone-R when compared with Group A.Also,the b-wave amplitude of Group C reduced to 31% approximately in Max-R step and 47%approximately in Cone-R step compared with Group A while the awave amplitude reduced to 27%approximately in Max-R step and 43%approximately in Cone-R step compared with Group A.The latent periods of both a-wave and b-wave were also delayed in the Rod-R and Max-R steps.In the Cone-R step,the latent of a-wave and b-wave were also delayed and the bwave amplitude reduced (P<0.05).
In the low-dose groups (Group D and E),the a-wave and b-wave amplitude of Group D in Max-R were lower than that of Group A,and also the latent period of a-wave in the Cone-R was later than that of Group A (P<0.05).There was no obvious difference between the waveforms of Group E and Group A.
In order to identify the effect of different recovery times,a statistical comparison of F-ERG responses between 3-day intoxication and 7-day intoxication was performed.During the Max-R step,the latent period and amplitude of a-wave and b-wave in Group C was more significantly deteriorated than that in Group B (P<0.05).But in the Cone-R step,there was no difference between the groups of the periods.
During the Max-R step in the low-dose groups(Group D and E),the amplitude of a-wave and bwave in Group E were significantly higher than that in Group D (P<0.05).At the same time,there were no obvious differences in the Cone-R steps.
The methanol blood concentration
As a result of this sort of condition,tertiary butyl alcohol tR=2.15 min and methanol tR=1.134 min,they totally separated without impurity peaks disturbance(Fig.3).Based on the standard curve,the concentrations of the methanol were tested as follows (Table 3).
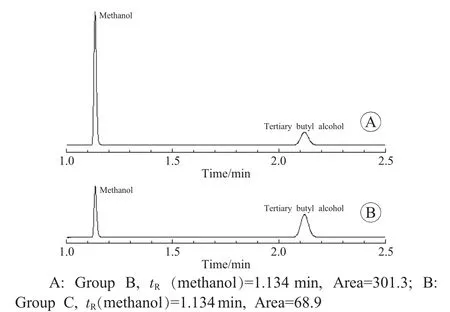
Fig.3 The chromatographic peak of high-dose methanol in blood
Table 3 The concentration of the methanol(n=7, ±s,μL/mL)
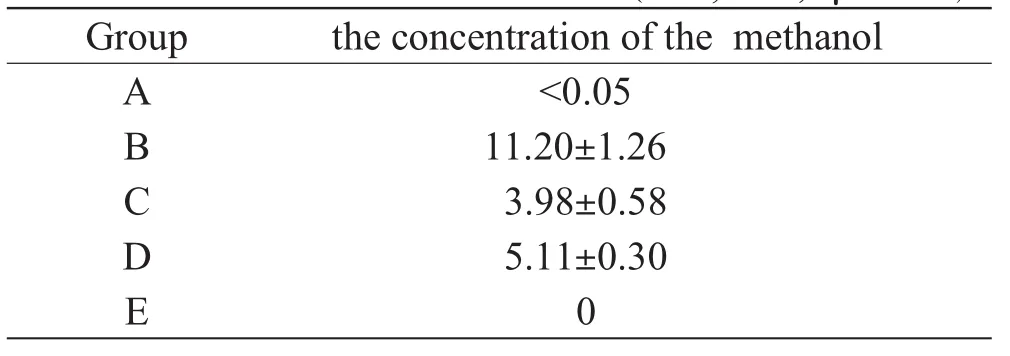
Table 3 The concentration of the methanol(n=7, ±s,μL/mL)
Group the concentration of the methanol A<0.05 B 11.20±1.26 C 3.98±0.58 D 5.11±0.30 E 0
In the high-dose groups,the methanol concentration in the blood was (11.20±1.26)μL/mL 3 days after methanol administration.The concentration of methanol reduced to a level of (3.98±0.58)μL/mL 7 days later.In contrast with high-dose groups,the average concentration of low dose was (5.11±0.30)μL/mL,which occurred 3 days after methanol administration.The concentration wasbelow the threshold of HSGC,and it could not be detected 7 days later.
The histopathological analysis of the retina
The structuralalterationsofthe retina after methanolintoxication were visible,and different characteristics were found in the different groups.In Group B,the outer nuclear layer and inner nuclear layer of the retina showed cellular swelling,intercellular substance edema and porosity.In group D,these alterations were slight.But 7 days later,nuclear heteromorphism of rod and cone cells,disarrangement of cell,and loose attachments among cellswerefound in Group C.Compared with group D,the retina completely recovered in group E(Fig.4).
The ultrastructure analysis of the retina
In accordance with previous results[11],the mitochondria,mainly impaired-cellorganelle,showed edema and contained large or small vacuoles in Group B;in addition,the cristaes broke into fragmentations.In different dose and interval groups,the mitochondria of different cells showed different severities.In early stage,the impairment of the mitochondria happened in rods and cones layers,which was more serious in Group B than that in Group D.After 7 days,the layer of rods and cones recovered and meanwhile the mitochondria of the inner plexiform layer showed obvious edema,cavity and broken cristae in Group C.The cell ultrastructure of the low-dose group returned to a normal state 7 days later (Fig.5).
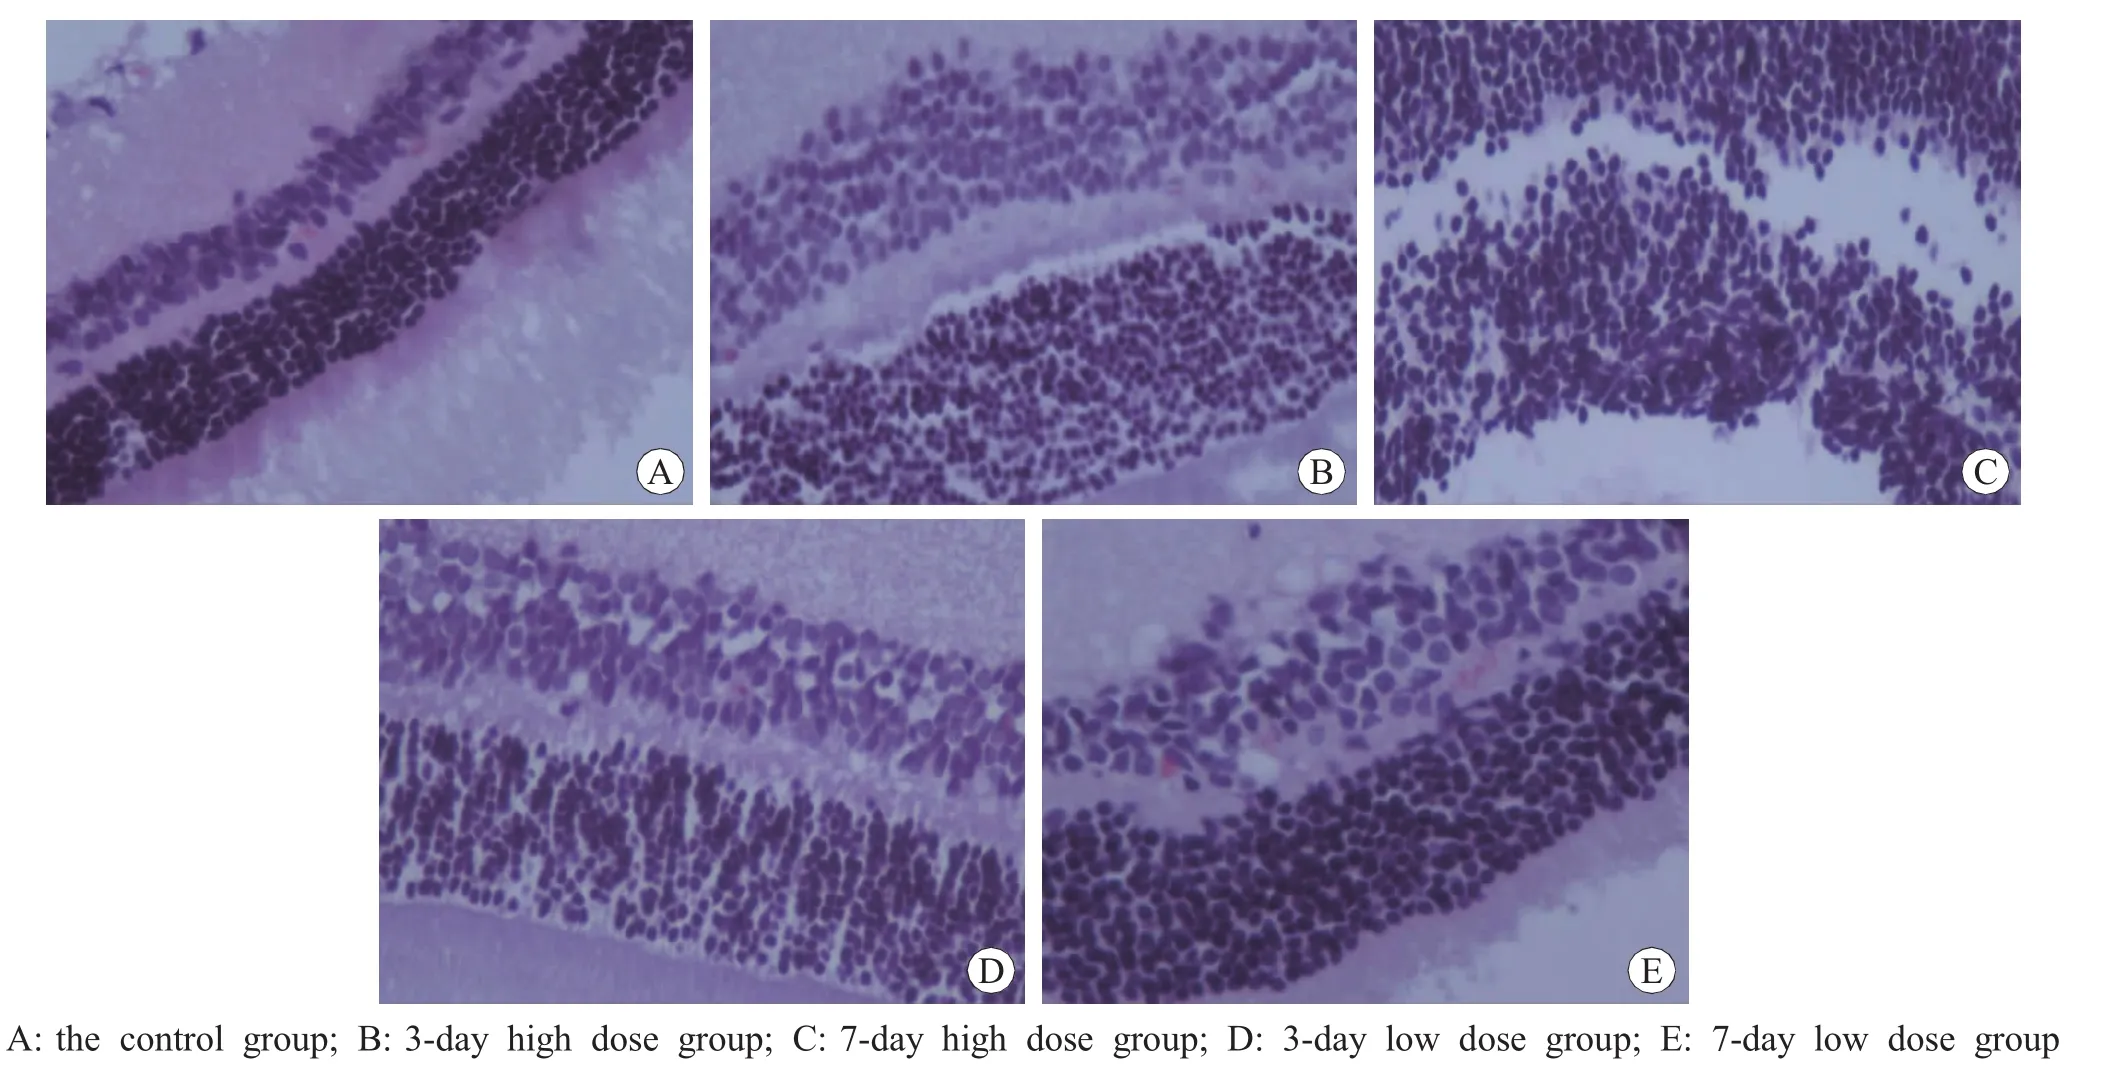
Fig.4 The histopathology of the retina HE×400
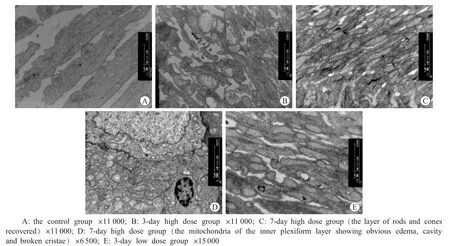
Fig.5 The ultrastructure analysis of the retina under electron microscope
Discussion
Establishing an intoxicated animalmodelis crucial for the research of intoxication.10-FDH can accelerate the oxidation of formate.As previously reported[12],the low concentration of N2O could inhibit the activity of 10-FDH for slowing down the methanol metabolite.Based on previous research,the FR rats were provided as the intoxication model for this research.The mixture gas administrated to rats completely inhibited the activity of 10-FDH.The second administration of methanol strengthened the blood concentration and effects.It was reported that the LD0of methanol was 6.67 mL/kg and LD50was 12-14 mL/kg for rats when intake orally[13-14].There were two kinds of dosages for the research on retinal intoxication changes.For the purpose of not only getting obvious toxic symptom and sign but also avoiding unnecessary death,the dosage of methanol(8mL/kg between toxic dose and half lethal dose)was adopted.And to figure out whether the structure and function of retina would be affected un-der the dosage less than general toxic dose,the dosage of methanol 4mL/kg was used in this research.
The waves of F-ERG represent the bio-electrical activities of different cells,so the response not only show the function of the whole retina but also implicate the injury of different cells.The a-wave reflects the electrical activity of the photoreceptors and b-wave reflects the electrical activity of the innernuclearlayerincluding thebipolarcelland muller cell[15-16].As nocturnal animal,rat’s rod cells are up to about 97% in photoreceptor cells,and M-cone cells and UV-cone cells are involved in cone cells[17-19].Seme et al.[11]found that the function of UV-cone cells didn’t recover under the condition of 15 Hz/510 nm of F-ERG analysis,but the M-cone cells could not be distinguished from rod cells under this condition.
In this research,the rod and cone responses of F-ERG recorded the activity of rod and cone cells separately.In the high-dose group,3 days after intoxication (Group B),only the amplitude of a-wave and b-wave were obviously reduced in the Rod-R steps.7 days later (Group C),not only the amplitude,but also the latent periods of a-wave and b-wave worsened,which indicated that the inner nuclear layer cells and rod cells of the retina were damaged seriously by methanol and the function of the rod cells declined progressively.Three days later,the b-wave amplitude and a-wave latency altered in the Cone-R steps,and there was no apparent aggravation after7 days,which indicated thatthe cone cells might be affected by intoxication,but the sensitivity of cone and rod cells to methanol was different.With the same opinion of Seme et al.[11],rod cells were much more sensitive to the methanolintoxication with receiving much more damages from the intoxication than core cells.The histological analysis of this research was in accordance with the F-ERG results.Edema of the outer and inner nuclear layer and a loose attachment of cells were the primary alterations in the early stage,while cell heteromorphy,disarrangement and tissue porosity occurred in the late stage,but the rod and cone cells could not be discriminated under the light microscope.
The mitochondria are the most important organelles for oxidative metabolism.It was hypothesized that ocular toxicity was produced by disrupting the mitochondrial energy production in the retina[20].Seme et al.[11]found that formic acid could inhibit the activity of cytochrome oxidase that transmited electrons to oxygen in the process of the respiratory chain,which leaded to a critical hypoxia of the retina[21].In this research,mitochondria were found to be the primary target organelle of methanol.However,the mitochondria in different cells of the retina reacted differently to the methanol.The metabolism of the photoreceptors which contain the most mitochondria is most active in the retina,so thephotoreceptorsaremoresensitivethan other cells to hypoxia.In this research,the mitochondria edema,vacuole and cristae fragmentation of photoreceptors were found in the early stage,which were in accordance with the inhibition of the oxidative process.There was no obvious alteration in other cells.In the late stage,these changes disappeared in the mitochondria of photoreceptors,but appeared in mitochondria of bipolar cells,muller cells,and ganglion cells in high-dose groups,which indicated thedamageof mitochondriadeveloping from the outer layer to inner layer of the retina.It was certain that this damage was related with the dose of methanol.In this research,in the low-dose group,damage of mitochondria was transitional.
Conclusion
The toxic dose methanol leaded to a disorder of the retinal function and structure;photoreceptors and inner nuclear lays were the key cells for intoxication;the rod cells were more sensitive than cone cells to methanol;the mitochondria in photoreceptors were damaged earlier than the inner nuclear lays;and the injury of low-dose intoxication was reversible.
[1]Wood CA,Buller F.Poisoning by wood alcohol:cases of death and blindness from Colombian spirits and other methylated preparations[J].JAMA,1904,43:972-977.
[2]Shi J,Jiang CQ,Yang ZQ,et al.Neurological damagescaused by acute methanolpoisoning--Clinical analysis on forty-two patients[J].China Occupational Medicine,2009,36(6):478-479,481.
[3]Eells JT,McMartin KE,Black K,et al.Formaldehyde poisoning.Rapid metabolism to formic acid[J].JAMA,1981,246(11):1237-1238.
[4]Johlin FC,Fortman CS,Nghiem DD,et al.Studies on the role of folic acid and folate-dependent enzymes in human methanol poisoning[J].Mol Pharmacol,1987,31(5):557-561.
[5]Johlin FC,Swain E,Smith C,et al.Studies on the mechanism of methanol poisoning:purification and comparison of rat and human liver 10-formyltetrahydrofolate dehydrogenase[J].Mol Pharmacol,1989,35(6):745-750.
[6]Keyhani J,Keyhani E.EPR study of the effect of formate on cytochrome C oxidase[J].Biochem Biophys Res Commun,1980,92(1):327-333.
[7]Martinasevic MK,Green MD,Baron J,et al.Folate and 10-formyltetrahydrofolate dehydrogenase in human and rat retina:relation to methanol toxicity[J].Toxicol Appl Pharmacol,1996,141(2):373-381.
[8]Eells JT,Makar AB,Noker PE,et al.Methanol poisoning and formate oxidation in nitrous oxide-treated rats[J].J Pharmacol Exp Ther,1981,217(1):57-61.
[9]Ruedemann AD Jr.The electroretinogram in chronic methyl alcohol poisoning in human beings[J].Trans Am Ophthalmol Soc,1961,59:480-529.
[10]Garner CD,Lee EW,Louis-Ferdinand RT.Müller cell involvement in methanol-induced retinal toxicity[J].Toxicol Appl Pharmacol,1995,130(1):101-107.
[11]Seme MT,Summerfelt P,Neitz J,et al.Differential recovery of retinal function after mitochondrial inhibition by methanol intoxication[J].Invest Ophthalmol Vis Sci,2001,42(3):834-841.
[12]Eells JT,Henry MM,Lewandowski MF,et al.Development and characterization of a rodent model of methanol-induced retinal and optic nerve toxicity[J].Neurotoxicology,2000,21(3):321-330.
[13]Tong ZW,Chen J,Yang CM,et al.Experimental study on optic nerve injury in rats with acute methanol intoxication[J].Chinese Journal of Blood Purification,2008,7(9):485-487.
[14]Skrzydlewska E.Toxicological and metabolic consequences of methanol poisoning[J].Toxicol Mech Methods,2003,13(4):277-293.
[15]Heynen H,van Norren D.Origin of the electroretinogram in the intact macaque eye--Ⅱ.Current sourcedensity analysis[J].Vision Res,1985,25(5):709-715.
[16]Wurziger K,Lichtenberger T,Hanitzsch R.On-bipolar cells and depolarising third-order neurons as the origin of the ERG-b-wave in the RCS rat[J].Vision Res,2001,41(8):1091-1101.
[17]Szél A,Röhlich P.Two cone types of rat retina detected by anti-visual pigment antibodies[J].Exp Eye Res,1992,55(1):47-52.
[18]Deegan JF 2nd,Jacobs GH.On the identity of the cone types of the rat retina[J].Exp Eye Res,1993,56(3):375-377.
[19]Jacobs GH,Neitz J,Deegan JF 2nd.Retinal receptors in rodents maximally sensitive to ultraviolet light[J].Nature,1991,353(6345):655-656.
[20]Sharpe JA,Hostovsky M,Bilbao JM,et al.Methanol optic neuropathy:a histopathological study[J].Neurology,1982,32(10):1093-1100.
[21]Seme MT,Summerfelt P,Henry MM,et al.Formateinduced inhibition of photoreceptor function in methanol intoxication[J].J Pharmacol Exp Ther,1999,289(1):361-370.