Optimization of Extraction Program of Sea Buckthorn Seeds Proanthocyanidins by Combining Uniform Design and Microsoft Excel
2012-10-28TIANYaxinHANXiaoyunWANGYunlaiKANGChuanhong
TIAN Ya-xin,HAN Xiao-yun,WANG Yun-lai,KANG Chuan-hong*
(1. College of Life Science, Heilongjiang University, Harbin 150080, China;
2. College of Chemistry and Materials Science, Heilongjiang University, Harbin 150080, China)
Optimization of Extraction Program of Sea Buckthorn Seeds Proanthocyanidins by Combining Uniform Design and Microsoft Excel
TIAN Ya-xin1,HAN Xiao-yun1,WANG Yun-lai1,KANG Chuan-hong2,*
(1. College of Life Science, Heilongjiang University, Harbin 150080, China;
2. College of Chemistry and Materials Science, Heilongjiang University, Harbin 150080, China)
A novel optimization method based on uniform design and function LINEST of Microsoft Excel was proposed to explore the extraction of proanthocyanidins from sea buckthorn seeds. The proposed multiple regression equation was calculated with the function LINEST. This method was not only a flexible method, but also could avoid high expenditure and fixed algorithm while using other professional software for data processing. The validation experiments showed that the extraction rate of proanthocyanidins from sea buckthorn seeds revealed an increase by 16.43%. This method is easy to extend and may hold promise for other scientific applications.
optimization;uniform design;LINEST;regression equation;proanthocyanidins
For a multi-factor, multi-level experiment, there were several statistical experiment design methods, for example factorial design, response surface design, orthogonal design and uniform design and so on. The uniform design (UD) was one of space filling designs and it sought experimental points to be uniformly scattered on the domain[1-2]. The interrelationship among the factors could be uncovered by the UD in a few experimental runs. In recent years, the UD was used more and more widely in many fields because of its cost-efficiency, robustness and flexibility[2-3], whereas the treatment of the UD experimental results had always been a problem. There was much data processing software for the UD, but they were very difficult to adapt to different actual experiments, and the results calculated by using their fixed algorithms may not be satisfied.
The Excel spreadsheet function “LINEST” was a complete least square curve fitting routine that produces uncertainty estimates for the fit values[4]. Considering that the least square was an ideal method on the calculation of regression equation at present, the LINEST could be used to deal with the experimental results of the UD. The calculation of the multiple regression equation by the LINEST was the emphasis in this paper.
Sea buckthorn (Hippophae rhamnoides L.) was rich invitamins, flavonoids, polyphenols, organic acids and other nutritional and bioactive compounds[5-7], and had much physiological and pharmacological activities, for example antioxidation properties[8], antibacterial activities[9], protective effects on cardiovascular system[10], anti-inflammatory actions[11]and so on. People overmuch paid attention to research into sea buckthorn flavonoids and oil but ignored a group of vital compositions—proanthocyanidins. Those were polyhydric phenols compounds[12]which had application value greater than others. So far, the research on sea buckthorn proanthocyanidins had just begun. Taking industrial production costs and requirements into consideration, the ethanol extraction method was used to study extraction process of sea buckthorn proanthocyanidins by some researchers. The extraction yield was considered only by every single factor test by them, without considered by combinable several factors simultaneously. At present, the UD was one of the best methods of multi-factor combination analysis. In this paper extraction program of sea buckthorn seeds proanthocyanidins was designed by the UD, and then multiple regression equation was calculated by the LINEST. After validated, the extraction yield of sea buckthorn seeds proanthocyanidins was up to 14.46%, increased by 16.43%.
1 Materials and Methods
1.1 Materials, reagents and instruments
The sea buckthorn seeds were from Sunwu County Forestry Administration, Heilongjiang Province, China. The standard samples of grape seeds proanthocyanidins (purity was above 99.5%) was from Jianfeng Natural Products Research and Development Co. Ltd. Tianjin City, China. Petroleum ether, ethanol, n-butanol, hydrochloric acid and methanol were all analytical-reagent grade.
Tissue triturator was from Suzhou Ou-Bei Scientific Instrument Co. Ltd., China. Rotary evaporator was from Suzhou Da-long Instrument Co. Ltd., China. TU1800 UV-VIS Spectrophotometer was from Beijing Purkinje General Instrument Co. Ltd. China. pH meter was from Shanghai Jing-ke Industry Co. Ltd., China.
1.2 Extraction processes
A certain amount of freeze-dried sea buckthorn seeds were shattered by using tissue triturator, and filtrated by 80-mesh filter. The seed powder was put into circumfluent equipment in which there was an amount of petroleum ether. After degreasing for definite time at temperature of 30 ℃, and then removing petroleum ether and evaporating it, defatted powder of sea buckthorn seeds was gained. 10 g of defatted powder of sea buckthorn seeds was weighed up, and then the proanthocyandins were extracted on condition that definite volume of aqueous ethanol, pH value, water bath temperature and time. After extracted it three times, combined extract were concentrated on a rotatory evaporator. In this way, the raw proanthocyanidins extract was gain.
1.3 Determination of contents of proanthocyanidins
By calculating standard curve function, the content of proanthocyanidins was determined by butanol/HCl assay[13-14]. 0.010 g of grape seed proanthocyanidins standard was weigh up accurately, and then dissolved in methanol, the volume to 20 mL. Respectively, 0, 0.2, 0.4, 0.6, 0.8 mL and 1.0 mL of solution above was suctioned accurately into 25 mL cuvette, in which 6 mL of n-butanol/HCl (V/V is 95:5) was added, and then 70% methanol was used to fill up to 7 mL. The mixture was heated in a boiling water bath for 40 min, placed in cold water to cool 15 min. The absorptance value was measured at 546 nm wavelength by reagent blank as reference. The standard curve function was calculated by function LINEST of Microsoft Excel software.
According to process of calculating standard curve function, the relationship of concentration of grape seed proanthocyanidins standard and UV absorbance value (Table 1) was determined. The standard curve function y=14.1799x +0.0069 was gained by function LINEST of Excel and R2of the function was 0.9994. F statistics value was 7111, and F-critical value was 22 while confidence level was 0.01 by using the function FINV of Excel.
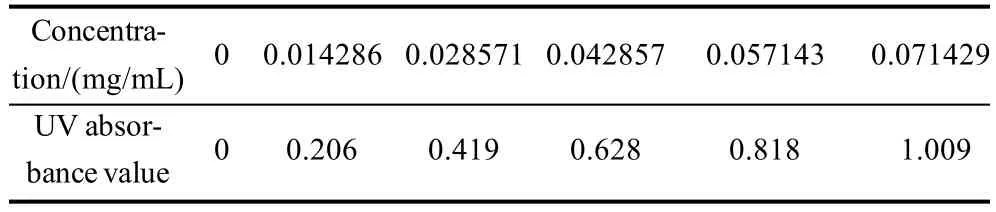
Table 1 Relationship between the content of proanthocyanidins from sea buckthorn seeds and UV absorbance
0.050 g of extract products was weigh up accurately, and then dissolved in methanol, the volume to 20 mL. 1 mL of solution was suctioned accurately into 25 mL cuvette, subsequent experimental procedures as above. The content of proanthocyanidins of extract products was calculated by standard curve function gainded above.
After gained the content of proanthocyanidins of extraction products, the extraction yield could be calculated.
2 Results and Analysis
2.1 Uniform design
This experimental program was designed by using the UD table U11(1110)[3,15](Table 2, Table3). Degreasing time (DT), ethanol concentration (EC), the ratio of ethanol to materials (E/ S), pH value (pH), extraction temperature (ETE) and extraction time (ETI) were selected as optimization factors. The extraction yield (EY) of proanthocyanidins was 12.42%, as selected 10 hours of DT, 70% of EC, 7:1 of E/S, 6 of pH, 40 ℃ of ETE and 120 minutes of ETI before optimizing. According to the result of single-factor experiments, the experimental program was designed and result was showed in Table 4, in which each experimental factor was fixed on the reasonable scope.
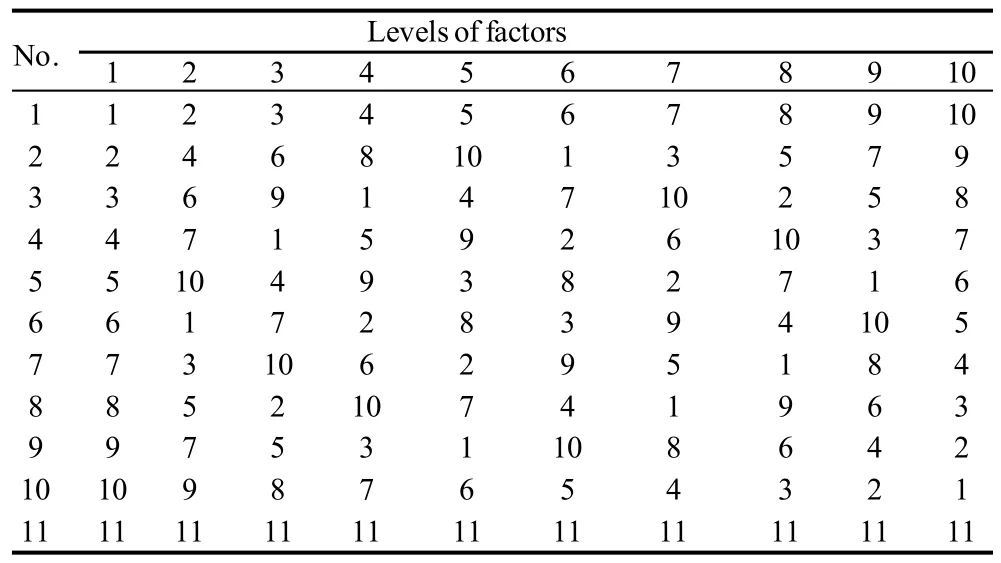
Table 2 Uniform design table
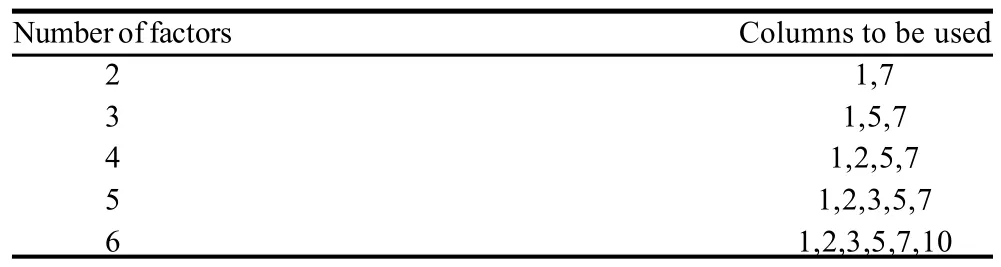
Table 3 Guidance for using uniform design table
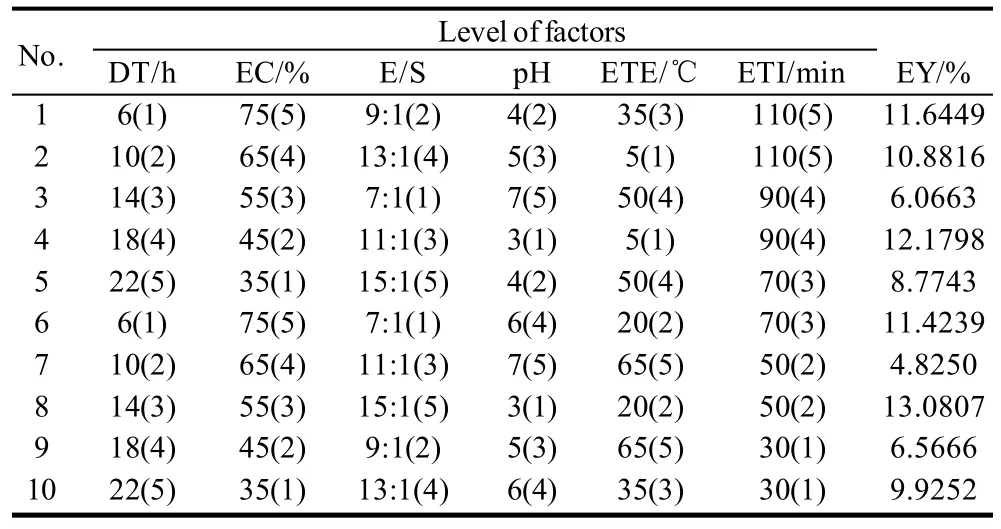
Table 4 Uniform design experimental results
2.2 Calculation of the multiple regression equation by the Excel
This study calculated the multiple regression equation by using the LINEST, which calculated the statistics for a line by using the least squares,, method to calculate a straight line that best fits experimental data, and then returned an array that describes the line[16-17]. The syntax of the LINEST was LINEST (known_y,s, known_x,s, const, stats). It returned the m-values which were coefficients corresponding to each x-value, the b-value which was the value of y at the point where the line crosses the y-axis and additional regression statistics. Among the additional regression statistics, value R2, the coefficient of determination, was a very important statistic. It was an indicator of how well the equation resulting from the regression analysis explained the relationship among the variables. Since the LINEST returns an array, function index of Excel could be used for returning the parameter required.
Firstly, the quadratic equation was calculated for well reflected the impact of each factors on result. For example, the value A of the quadratic equation y=Ax2+Bx+C could be returned by using “{=INDEX(LINEST($B$2: $B$11,(A$2:A$11)^{1,2}, TRUE,TRUE),1,1)}” in Excel, and the value B, C and R2as well as. As a result, the equation y=-0.00215546x52+0.040870222x5+11.71676825(y represents EY, x5represents ETE) was got, which reflected the impact of ETE on EY (Fig.1).

Fig.1 Calculation of R2, A, B and C for the quadratic equation y =Ax52 +Bx5+C by using LINEST of Microsoft Excel
Secondly, for finding combinable different factors affecting the results, multiple regression equations were also calculated by using the LINEST. For example, the equation y=-0.000278456x2x4x5+12.40214326(x2represents EX, x4represents pH and x5represents ETE), calculated by using the LINEST, reflected the impact of combining EC, pH and ETE on EY (Fig.2).
Thirdly, it was very important that to construct the much better multiple regression equation by combining the regression equation that be calculated before. The way was still using the LINEST. For example, the equations y1=-0.00215546x52+0.040870222x5+ 11.71676825 and y2=-0.000278456x2x4x5+12.40214326 were taken as known quantity, and then calculated the regression equation y= My1+Ny2+S by using the LINEST. As a result, after the parameter M, N and S of the equation was got, the new equation y=-0.001460597x52+0.027694752x5+0.000115495x2x4x5+12.202454951 was constructed (Fig.3).
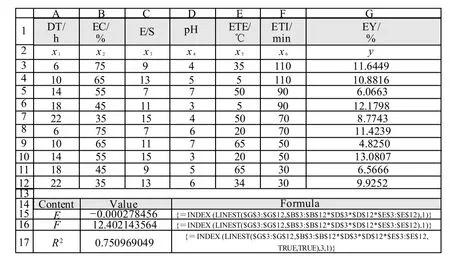
Fig. 2 Calculation of R2, E and F for the multiple regression equation y=Ex2x4x5 +F by using LINEST of Microsoft Excel
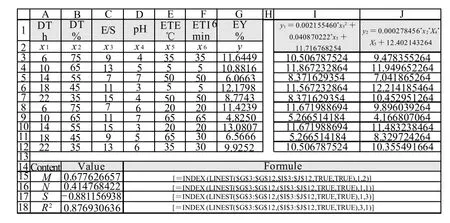
Fig.3 Calculation of M, N and S for the multiple regression equation y=M(Ax52+Bx5+C)+N( Ex2X4X5+F)+S by using LINEST of Microsoft Excel
It was challenge attention herein that the value R2in Fig.3 was not of the new equation but of the equation y=My1+Ny2+S. The R2of new equation could be calculated artificially by using following formulae:
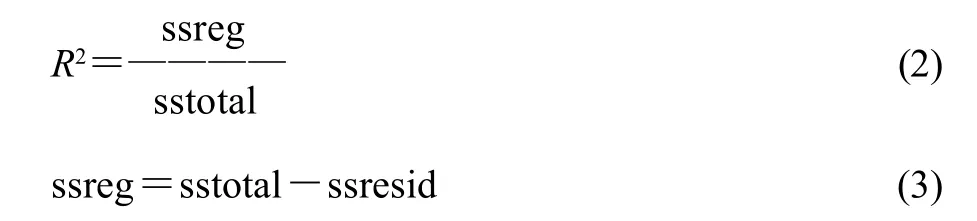
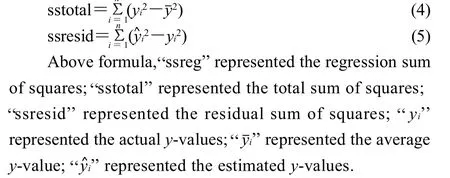
Lastly, in accordance with the above methods, different regression equations were calculated. By examining the value R2(more closer to one, more better) and F-statistic (more greater than the F-critical value(Fc), more better), whether or not to use the function was decided. The F-statistic was an even better statistical test of the goodness of fit. The F-statistic could be calculated by below formula, and Fcvalue could be calculated by function FINV of Excel.
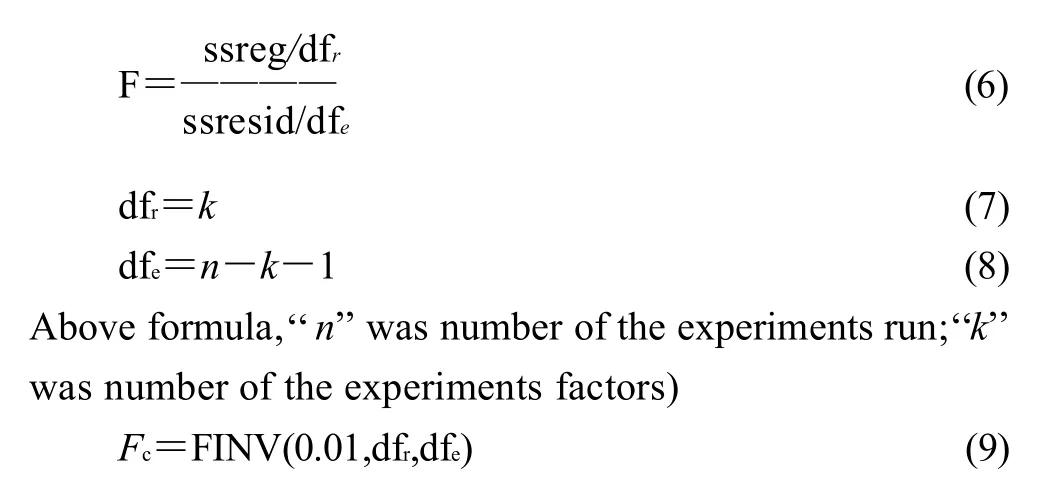
The formula was used in Excel, 0.01 was confidence level which could be replaced by 0.05 or other values.
At last, the best optimized multiple regression equation was gain.
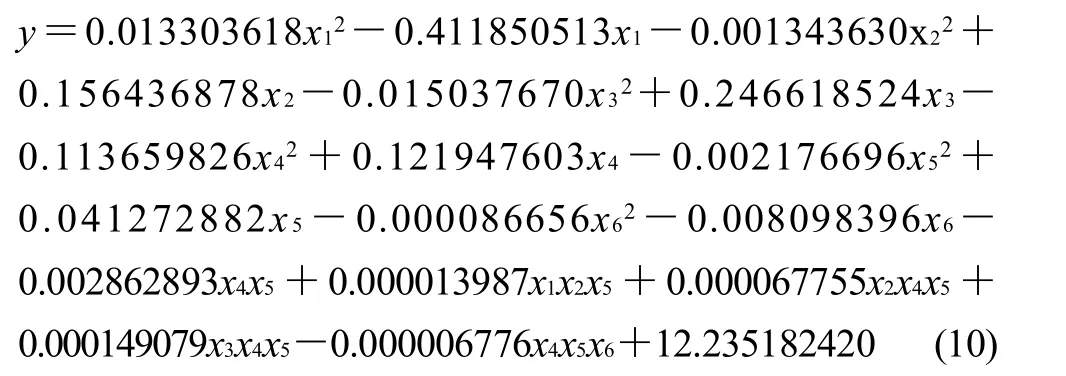
In the above formula, x1was representative of the DT; x2was representative of the EC; x3was representative of the E/S; x4was representative of the pH; x5was representative of the ETE; x6was representative of the ETI; y was representative of the EY.
After calculated, the R2was 0.998 and F-statistic was 225.692 of the equation. When confidence level was 0.01, the F-critical value was 27.911. It meaned the multiple regression equation calculated was the goodness of fit that R2was very close to one and F-statistic was much greater than F-critical value.
Calculated by using Qbasic program compiled myself and multiple regression equation got above, when DT was 5 h, EC was 60%, E/S was 8, pH was 3, ETE was 20℃ and ETI was 60 min, the estimative EY 14.77% was best. Did experiment in the light of the program, the actual EY was 14.46%, which was increased by16.43% than unoptimizable program.
3 Conclusions
In this paper, the UD table (1110) was developed to design experiment program, and function LINEST of Excel was used to calculated multiple regression equation to optimize extraction yield of sea buckhorn seeds pranthocyanidins. After calculated and judged the values R2and F-statistic, the equation was affirmed to the goodness of fit. The whole optimized program was accepted as valid by doing experiment according to the program optimized, and the extraction yield of sea buckhorn seeds proanthocyanidins reached 14.46% which was increased by16.43% than unoptimizable program.
If response surface design method was taken to optimize extraction program of sea buckthorn seeds proanthocyanidins by Box-Behnken design, there would be 54 runs for the experiment with 6 factors and 5 levels. It would outweigh more workload and expense than UD, and data processing would be rather complicated. For testing and verifying reliableness of the method combining UD and Excel, orthogonal design was taken by table L25(56). According to traditional data processing method that combine analysis of intuitiveness and analysis of variance (ANOVA), it was fixed on the best program that DT was 6 h, EC was 65%, E/S was 7, pH was 3, ETE was 20 ℃ and ETI was 70 min. By the best program, EY reached 14.31, which was lower than 14.46%. The reason was not shortage of orthogonal design but of data processing method. By the Excel method noted above, the regression equation and optimized result were close to the foregoing data.
4 Discussion
The results obtained in this study showed that the UD was a powerful tool to perform experiments with a large number of factors and a large number of levels for each factor. Simultaneously, the uniform design comprehensively takeed all of factors affected result into account, and avoided uncertainty of analyzing single factor,s effect on experimental results. As a result, the difference between the optimized estimative value and actual value was diminutive.
However, there were a few difficulties in data processing of UD, especially calculation of multiple regression equation. A good many professional softwares of data processing, such as SPSS, SAS, were used to calculate multiple regression equation, whereas were difficulty to calculate the equation of UD. This paper gave a case study to how the LINEST was used for calculating multiple regression equation, which was an impactful and flexible method. This could be easily extended and applied to other situations.
[1] FANG Kaitai. The uniform design: application of number-theoretic methods in experimental design[J]. Acta Math Appl Sinica, 1980, 3(4): 367-372.
[2] FANG Kaitai. Theory, method and applications of the uniform design [J]. International Journal of Reliability, Quality & Safety Engineering, 2002, 9(4): 305-315.
[3] LIANG Yizeng, FANG Kaitai, XU Qingsong. Uniform design and its applications in chemistry and chemical engineering[J]. Chemometr Intell Lab, 2001, 58(1): 43-57.
[4] Microsoft. LINEST[EB/OL]. (2011-08-10). http://office.microsoft.com/ en-us/excel/HP052091551033.aspx?pid=CH062528311033
[5] TIAN Chunjie, NAN Peng, CHEN Jiakuan, et al. Volatile composition of Chinese Hippophae rhamnoides and its chemotaxonomic implications [J]. Biochem Syst Ecol, 2004, 32(4): 431-441.
[6] TANG Xurong, TIGERSTEDT P M A. Variation of physical and chemical characters within an elite sea buckthorn (Hippophae rhamnoides L.) breeding population[J]. Sci Hortic, 2001, 88(3): 203-214.
[7] RANJITH A, KUMAR K S, VENUGOPALAN V V, et al. Fatty acids, tocols, and carotenoids in pulp oil of three sea buckthorn species (Hippophae rhamnoides, H.salicifolia, and H.tibetana) grown in the Indian Himalayas[J]. J Am Oil Chem Soc, 2006, 83(4): 359-364.
[8] GAO Xiangqun, OHLANDER M, JEPPSSON N, et al. Changes in antioxidant effects and their relationship to phytonutrients in fruits of sea buckthorn (Hippophae rhamnoides L.) during maturation[J]. J Agr Food Chem, 2000, 48(5): 1485-1490.
[9] NEGI P S, CHAUHAN A S, SADIA G A, et al. Antioxidant and antibacterial activities of various seabuckthorn (Hippophae rhamnoides L.) seed extracts[J]. Food Chem, 2005, 92(1): 119-124.
[10] SUOMELA J P, AHOTUPA M, YANG Baoru, et al. Absorption of flavonols derived from sea buckthorn (Hippophae rhamnoides L.) and their effect on emerging risk factors for cardiovascular disease in humans [J]. J Agr Food Chem, 2006, 54(19): 7364-7369.
[11] GANJU L, PADWAD Y, SINGH R, et al. Anti-inflammatory activity of Seabuckthorn (Hippophae rhamnoides) leaves[J]. Int Immunopharmacol, 2005, 5(12): 1675-1684.
[12] PORTER L J, HRSTICH L N, CHAN B G. The conversion of procyanidins and prodelphinidins to cyanidin and delphinidin[J]. Phytochemistry, 1985, 25(1): 223-230.
[13] DALZELL S A, KERVEN G L. A rapid method for the measurement of Leucaena spp proanthocyanidins by the proanthocyanidin (butanol/ HCl) assay[J]. J Sci Food Agric, 1998, 78(3): 405-416.
[14 ] Ministry of Health P R China. Health food testing and evaluative technical criterion[S].
[15] FANG Kaitai. Uniform design and uniform design tables[M]. Beijing: Science Press, 1994.
[16] KAGAN A, MARKHAM E. A better approach to designing an RTD interface with a spread sheet[J]. EDN, 2008, 15(12): 56-57.
[17] LI Yunbo, SHEN Qiping, LI Heng. Design of spatial decision support systems for property professionals using Map Objects and Excel[J]. Automation in construction, 2004, 13(5): 565-573.
联合均匀设计法和Microsoft Excel优化沙棘籽原花色素提取工艺
田亚新1,韩晓云1,王运来1,康传红2,*
(1.黑龙江大学生命科学学院,黑龙江 哈尔滨 150080;
2.黑龙江大学化学化工与材料学院,黑龙江 哈尔滨 150080)
提出一个基于均匀设计方法和Microsoft Excel的LINEST函数进行试验设计优化的方法。本实验通过均匀设计方法设计沙棘籽原花色素提取工艺,然后通过LINEST函数计算多元回归方程,该方法可避免因为使用其他专业数据处理软件的花费和固定算法限制。验证实验表明:沙棘籽原花色素的提取率提高了16.43%,该方法可应用到其他实验方面。
优化;均匀设计;LINEST;回归方程;原花色素
O212.6;S788.1
A
1002-6630(2012)16-0091-05
2011-09-15
黑龙江省教育厅科学技术研究项目(11551376);黑龙江大学青年科学基金项目(QL200908)
田亚新(1980—),男,讲师,硕士,研究方向为天然药物化学。E-mail:tianyaxin@gmail.com
*通信作者:康传红(1966—),女,教授,博士,研究方向为天然药物化学。E-mail:kangchh@163.com
