Effect of Distributor Design on Gas-Liquid Distribution in Monolithic Bed at High Gas/Liquid Ratios*
2012-02-14ZHOUYuan周媛ALDAHHANMuthannaDUDUKOVICMiloradandLIUHui刘辉
ZHOU Yuan (周媛), AL-DAHHAN Muthanna**, DUDUKOVIC Milorad and LIU Hui (刘辉),**
1 Beijing University of Chemical Technology, Beijing 100029, China
2 Missouri University of Science and Technology, Rolla, MO 65409, USA
3 Washington University in St. Louis, MO 63130, USA
1 INTRODUCTION
Two phase flow monolith reactors consist of a monolith bed with a large number of thin parallel channels coated with catalyst, where the gas and liquid phases flow through it. They offer many advantages such as low pressure drop, high mass transfer rate and short diffusion paths over the traditional multiphase catalytic reactors such as slurry bed and trickle bed reactors [1-6]. It is commonly recognized that monolith beds are promising as alternative functional packing suitable for catalytic distillation and catalytic multiphase reaction [7-13]. For proper performance of these reactors, understanding gas-liquid flow and its distribution is important because they are closely related to the mass and heat transfer, separation and/or reaction performance of the related processes.
In view of the repeating structure of the monolith bed, most previous studies on the gas-liquid transport and reaction performance were carried out in a single channel or capillary scale and mainly in the Taylor flow regime [12]. This has been done due to the consideration that the performance in a single channel or capillary would to some extent represent the overall performance of a monolith bed. However, experimental evidence by using various non-invasive measurement techniques including gamma-ray computed tomography [4, 5], X-ray tomography [6, 7], electrical capacitance and resistance tomography [8, 14] and nuclear magnetic resonance imaging (MRI) [15, 16]demonstrated that in a monolith bed, non-uniform distribution of gas and liquid at the entrance of the bed is frequently encountered and it propagates throughout the bed. The extent of non-uniformity of flow distribution in a monolith bed is largely dependent on the type of liquid distributor, superficial velocities of gas and liquid, and their physical properties, which affects the mass and heat transfer and reaction performance[17-23]. Therefore, the performance in a single channel can not be directly translated to that on a monolith bed scale. Regarding single channel flow, the Taylor flow regime is most reported in the literature due to the superior mass transfer in this flow regime [24-27],which is an advantage essential for a variety of mass transfer limiting reaction processes. However, Taylor flow occurs at high liquid velocity and low gas/liquid ratio, which are not typical of most practical processes.Rather a high gas/liquid ratio is often required to achieve high conversions and to slow down the catalyst deactivation such as in hydrogenation processes [28].Hence, there is a need to investigate the two phase hydrodynamics beyond the Taylor flow regime.
Accordingly the focus of the present work is to experimentally investigate the gas-liquid distribution at high gas/liquid ratios in a monolith bed with three different distributors. Single point optical fiber micro-probe was developed to measure phase distribution at different radial and axial locations across the section of a monolith bed. The performance of three types of distributors is evaluated in terms of the standard deviation of liquid saturation between individual channels. In this way, the relationship between distributor configuration and the gas-liquid flow structures in the bed is ascertained.
2 EXPERIMENTAL
2.1 Monolith reactor flow system
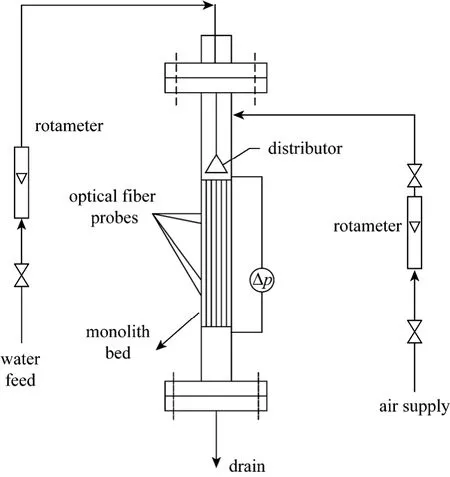
Figure 1 Schematic diagram of monolith bed experimental setup
The experimental setup, shown in Fig. 1, consists of a monolith section, distributor and liquid and gas delivery systems. The monolith is made of cordierite,with a diameter of 0.048 m (1.9 inches ), a length of 0.152 m (6.0 inches), and cell density of 62 cells per cm2(400 cells per square inch). The flow channels are of square cross section with a dimension of nominally 1 mm along each side. The monolith was fixed inside a cold model Plexiglas column of 0.051 m in diameter by two Teflon gaskets, one at the top and another at the bottom of the monolithic bed. The gaskets were held in position by support rings at the top and bottom,sealing the small gap between the column wall and the monolith and preventing by-pass flow of gas or liquid near the column wall.
The cold model set up was operated in the continuous co-current down-flow mode, using air as the gas phase and water as the liquid phase introduced at the top through a distributor. Three types of distributors were adopted for a comparative study for their effects on the hydrodynamics in the monolithic bed,including a showerhead distributor (outer diameter 46 mm, with 10φ1.9 mm holes distributed evenly as a circle ofφ26 mm, corresponding to an opening of 1.71% ofφ46 mm), nozzle distributor (singleφ6 mm orifice), and tube array distributor (37 tubes,φ3.0 mm opening). In experiments, the tube array distributor was always used in combination with the showerhead distributor which was mounted below the showerhead.Fig. 2 shows the schematic representation of the self-designed tube array distributor. It is comprised of two sections. One is the distributor shell with 100 mm in diameter and 160 mm in length, and the other is the array of 37 tubes with 3 mm diameter and 150 mm in length. The tube array, according to central symmetry configuration with 6 mm interval in the radial direction, was mounted in the bottom plate of the distributor and protruded out of the plate for 5 mm length.Each tube has two open holes of 1.5 mm in diameter at 180 degrees of each other at a neighboring distance of 5 mm (see Fig. 2).
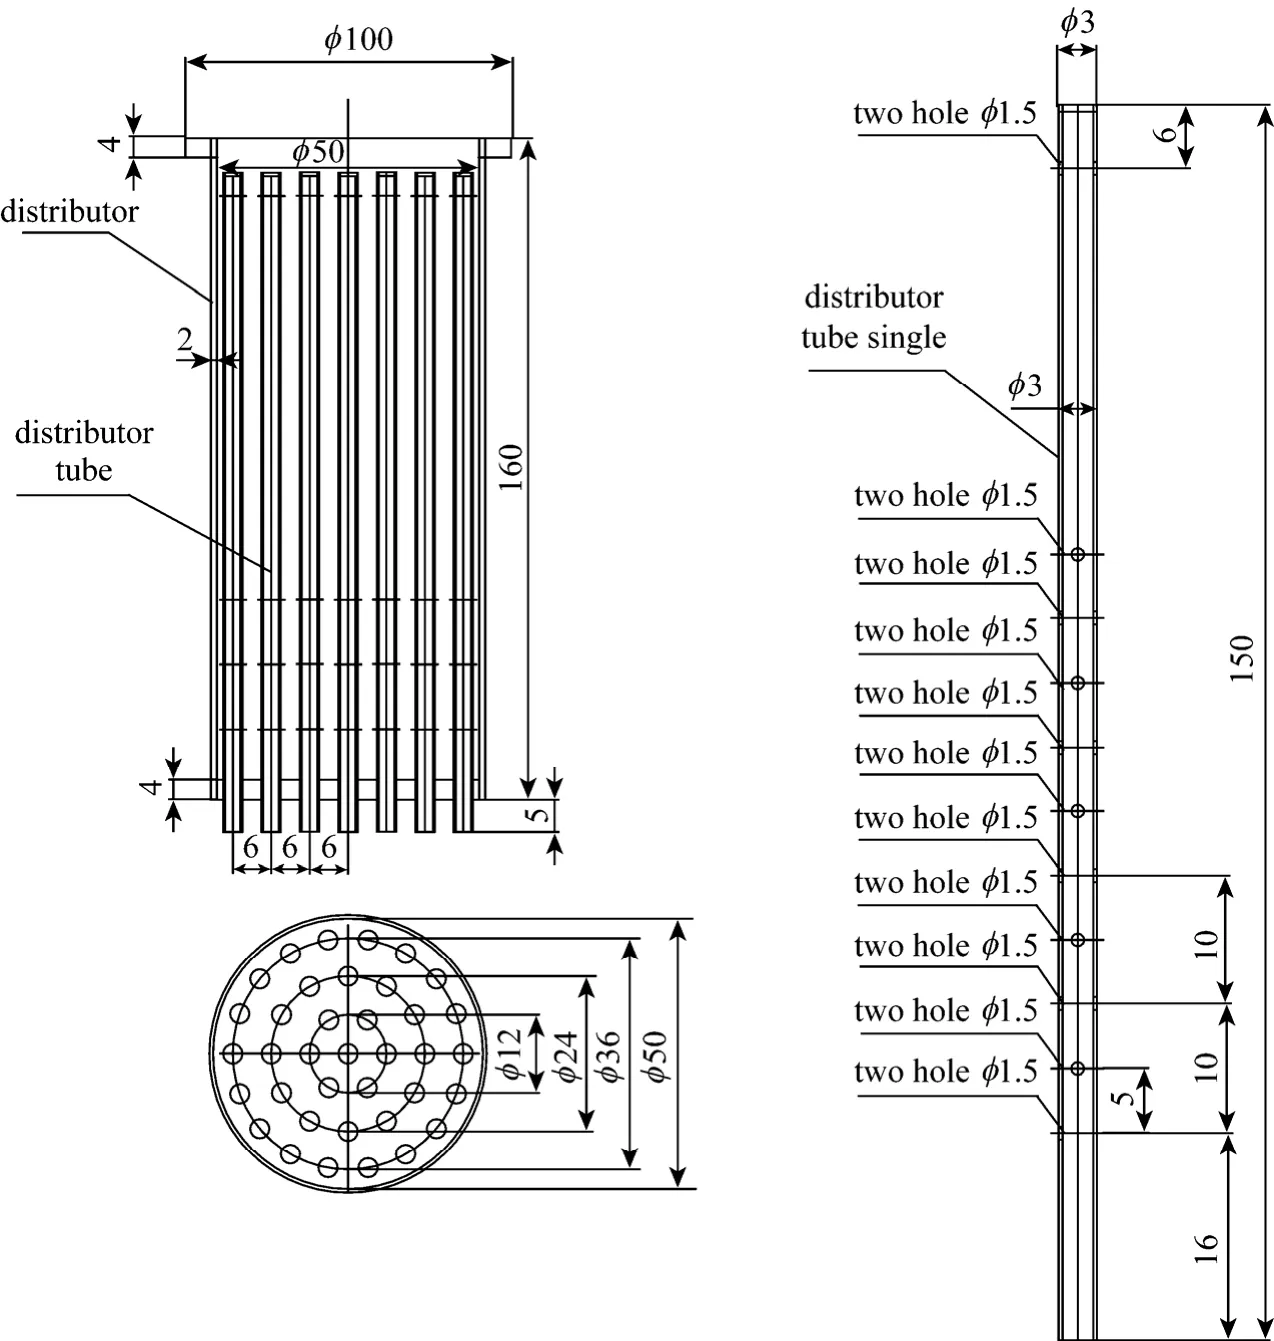
Figure 2 Geometry of the tube array distributor (unit: mm)
Water was fed into the system through a rotameter and was distributed by distributor, then mixed with air above the monolith section. Water and air together entered the monolith bed and finally were discharged to the drain. Measurements were made after the two-phase flow reached steady state as reflected by the signals of liquid saturation. Table 1 shows the range of volumetric gas and liquid flow rates. The flow conditions were chosen at low liquid velocity (~0.075-0.1 m·s-1) and high gas/liquid velocity ratio (~8-22), typical of the conditions of interest for existing commercial reactor applications [28].

Table 1 Operational conditions for different liquid distributors
2.2 Optical fiber probe and measurement procedure
Based on the four-point optical fiber probe used in bubble columns [29], a single-point optical fiber probe was developed to measure the liquid saturation in single channels of the monolithic bed in this work.Given the easy positioning of the probe, it is possible to install a number of the probes across the section of the bed and thereby measure flow parameters in individual channels of the bed. The home-made optical fiber probe, having a tip of 200 μm in diameter, was inserted from drilled tiny holes through the side wall into certain channels of the monolith. In experiments,a total of 16 optical fiber probes were mounted inside the channels at four different axial positions in a selected channel and four radial positions. Due to the axial symmetry configuration of both the liquid distributor and monolith bed, the liquid saturation distributions in the bed should exhibit axial symmetry, as reported previously [17, 30, 31] for the same system used here. Consequently these probes were arranged as shown in Fig. 3. In the figure, every point probe was named [TipXY], in whichXrefers to the selected channel number at different radial positions andYrepresents the axial distance in the monolith bed. Here,X=1, 2, 3, and 4 correspond to the radial positionsr/R=0, 0.25, 0.5, and 0.75, respectively;Y=1, 2, 3,and 4 refer to the distances from the top of the monolith bed,H=40, 50, 102, and 112 mm, respectively.For example, Tip 12 is the axially second tip in the central channel (channel 1#), and correspondingly the tip is located atr/R=0 andH=50 mm.

Figure 3 Arrangement of optical fiber probes inserted into monolith bed (unit: mm)

Figure 4 Typical signals of optical fiber probes inside the monolith channels (UL=0.075 m·s-1, UG=0.626 m·s-1, showerhead,churn flow)
All the probes were connected to an A/D unit and a computer was used to record the output signals from probes at a sampling frequency of 40 kHz. In principle,when the optical fiber tip is in the liquid phase, the light is transferred into the liquid, establishing a baseline signal. When a bubble hits the fiber, the light reflects, and the voltage rise is captured by the electronic unit, leading to a peak. Typical signals of the optical fiber probes are shown in Fig. 4 which illustrates that gas bubble and liquid slug pass in turn around the micro-probe tip and the existence of gas and liquid phases can be clearly identified by the probe. Over the range of the operating conditions in this work, the detected flow regimes in the selected channels were found to lie in the Taylor flow and the churn flow regimes. In the former case, gas bubbles with length greater than the channel diameter move along the capillary separated from each other by liquid slugs; in the latter case, very long gas bubbles and relatively short liquid slugs dominate in the channel at high gas/liquid ratios. The difference between the churn and Taylor flows is that in the Taylor (or slug,plug or bubble-train) flow there exist regularly alternative gas and liquid regions with longer or at least comparable lengths, while in the churn flow very long gas bubbles are separated by liquid slugs with comparable even shorter lengths than the channel dimension,giving rise to lower liquid saturation. The latter happens with further increasing gas velocity and/or decreasing liquid velocity (or increasing gas/liquid ratio)above the corresponding velocities to the Taylor flow regime. Therefore, it is difficult to give a clear demarcation between the two flow regimes. In this work we define the churn flow having liquid saturation values of below 0.3. In these two flows, clear phase identification can be obtained due to the resulting clear-cut phase signals as shown in Fig. 4.
These signals are roughly square wave signals,and after a bi-valued processing, they were used to evaluate the values of liquid saturation. The local liquid saturationβX,Yobtained by each probe TipXYis defined as [29]

whereTLis the time the probe tip spends in the liquid phase andTis the total measuring time.
The channel liquid saturationβXis the average value of four local liquid saturations at different axial positions in theX# channel:

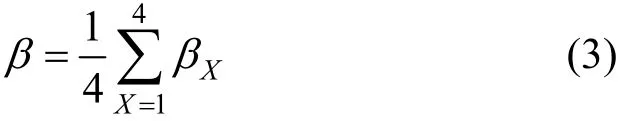
The overall liquid saturationβis the average value of four selected channel liquid saturations at different radial positions:
3 RESULTS AND DISCUSSION
3.1 Liquid phase distribution
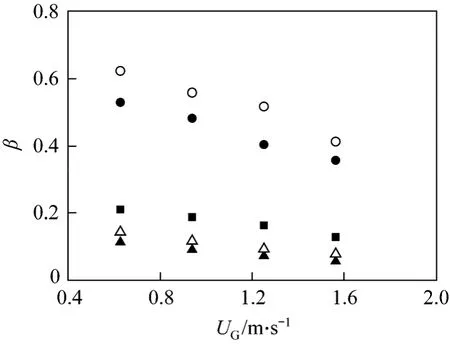
Figure 5 Overall liquid saturation of the monolith bed as a function of gas and liquid superficial velocitiesshowerhead: ■ UL=0.075 m·s-1; tube array distributor:● UL=0.075 m·s-1, ○ UL=0.1 m·s-1; nozzle: ▲ UL=0.075 m·s-1, △ UL= 0.1 m·s-1

Figure 6 Average liquid saturation inside channel 1#(central channel) as a function of gas and liquid superficial velocitiesshowerhead: ■ UL=0.075 m·s-1; tube array distributor:● UL=0.075 m·s-1, ○ UL=0.1 m·s-1; nozzle: ▲ UL=0.075 m·s-1, △ UL=0.1 m·s-1
Figure 5 shows the overall liquid saturation that is the averaged liquid saturation in all channels investigated; Fig. 6 shows the channel liquid saturation of central channel 1#, as a function of gas and liquid superficial velocities. Similarly, both the overall and channel liquid saturation increase with the increase in liquid superficial velocity and the decrease in gas superficial velocity. This is expected and clearly evident both on the single channel scale [32] and monolithic bed scale [23]. Remarkably, we see from the two figures that the liquid saturation is significantly higher when the tube array was used in combination with the showerhead as a combined distributor. The combined distributor consists of two parts, the upper showerhead and the lower tube array; the tube array itself is sort of a monolith. This leads to homogeneous dispersion of both phases across the inlet of the bed. Consequently,two phase flows could be in the Taylor or bubble-train flow, and the channel liquid saturation obtained with the tube array distributor is higher than that obtained with the showerhead and nozzle distributors. This phenomenon is related with the fact that non-uniform distribution is associated with flow pattern difference between the central and near-wall regions, and the Taylor flow pattern corresponds to higher liquid saturation than the film flow. In cases of the latter two distributors, liquid is distributed more near the wall region due to the liquid splashing and striking effect,most part of the bed are gas-dominant and the flows are churn (refer to Figs. 8 and 9 later).

Figure 7 Liquid saturation in channel 1# as a function of axial positions with (a) showerhead, (b) tube array distributor, and (c) nozzle distributor
Figure 7 shows the axial variation of liquid saturation in the central channel 1#. We see that along the four axial positions, the variation in liquid saturation is negligibly small, suggesting that bubble coalescence hardly occurs and the flow structure remains unchanged along the axial direction, even when the flow lies in the churn flow regime in which case the liquid saturation is quite low [see Fig.7 (c)]. This is the case also for other channels investigated (not shown here).
Figure 8 shows the radial distributions of the channel liquid saturation for the tube array distributor.It is seen that the radial distribution exhibits a “V” like shape along the cross-section; channel 3 has the lowest saturation values, and the others have the values larger than 0.3. This indicates that the Taylor flow is dominant in most part of the bed (also refer to Figs. 5 and 6) due to the good initial liquid distribution. Fig. 9 shows the radial distribution of channel liquid saturation for the nozzle distributor. The liquid saturation increases monotonously towards the wall due to the liquid splashing and striking effect; the saturation values are all well below 0.3, indicating the churn flow is prevailing throughout the bed. Liquid saturation is dependent on the liquid retention time in the bed and hence the linear liquid velocity. In the churn flow, liquid passes through the bed mostly in the form of the film flow; in the Taylor flow, most of liquid flows in the form of liquid slugs. In the former case, the linear liquid velocity is very high but the retention time is short, leading to low liquid saturation in the bed; on the contrary, in the latter case, the linear liquid velocity in the slugs is low, giving rise to high liquid saturation. Along this line of thought, the dramatic difference in liquid saturation in the channels could be understandable. In a logic place, we conclude that the different flow regimes must be attributed to the distributor or entry effect outside the bed.

Figure 8 Radial distribution of channel liquid saturation using combined tube array with shower distributorUG/m·s-1: ■ 0.626; ● 0.939; ▲ 1.252; ★ 1.565
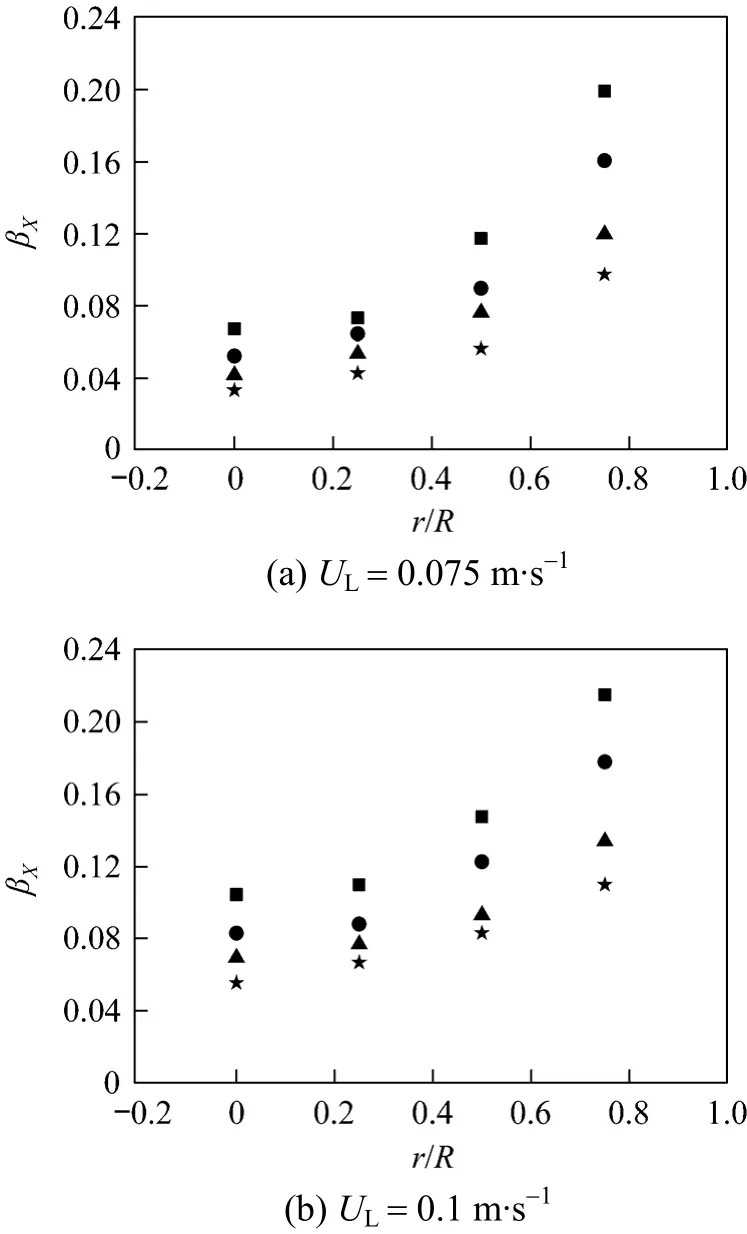
Figure 9 Radial distribution of channel liquid saturation using nozzle distributorUG/m·s-1: ■ 0.626; ● 0.939; ▲ 1.252; ★ 1.565
3.2 Degree of flow uniformity
The scale-up of gas-liquid flows from a single capillary channel to a monolithic bed is an important issue for the industrial application of monolith reactors. As reflected by the saturation data, the gas-liquid flows in different channels of the monolithic bed are not identical. To quantify the degree of such non-uniformity and evaluate the consequence of this to the scale-up of monolith reactors, the degree of flow uniformity is estimated by evaluating the standard deviation of the liquid saturation distribution over a designated region of the monolith cross-section:

whereN(=4) is the number of measuring points in a cross-section which is not large enough to provide a conclusive indication. However, it is used here to indicate such parameters variation with superficial gas velocity. Obviously, a smaller value of the quantity corresponds to more uniform distribution of the liquid flow. The degree of liquid saturation uniformity generated by the three types of distributors is shown in Fig. 10. It is seen that the tube array distributor provides better distribution performance. The nozzle performance is clearly second, and the flow distribution of showerhead is not satisfactory. With increase of liquid superficial velocity, the flow uniformity of tube array distributor still keeps its level with tiny variation,and the flow uniformity of nozzle is enhanced with the uniform degree approaches to the level of tube array distributor. According to the results above, tube array distributor is recommended, because it is capable of maintaining better flow uniformity with the slight influence of varied gas and liquid velocities.
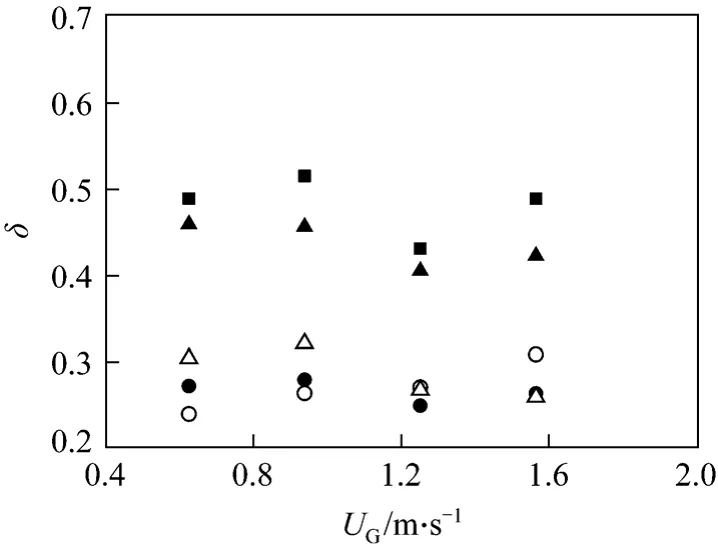
Figure 10 The degree of flow uniformity of three types of distributorshowerhead: ■ UL=0.075 m·s-1; tube array distributor: ● UL=0.075 m·s-1, ○ UL=0.1 m·s-1; nozzle: ▲ UL=0.075 m·s-1,△ UL=0.1 m·s-1
4 CONCLUSIONS
In this work, we carried out experiments to investigate the liquid distribution at high gas/liquid ratios in a cold model monolith bed with a 0.048 m diameter with 62 cells per cm2. Three types of distributor for the liquid distribution were adopted to evaluate their distribution performance. Local liquid saturation in individual channels was measured by 16 single-point optical fiber probes mounted inside the channels within the bed. Based on the work performed and the discussions presented, the following major findings can be drawn.
(1) The single point optical fiber probe has demonstrated its effectiveness in measuring phase distribution inside the opaque channels of the monolith bed.
(2) Within the range of high gas/liquid ratios under which experiments were conducted, two flow regimes occurred,i.e. Taylor and churn. No change of two phase flow structure is observed along the axial direction. The radial distribution of liquid saturation in the monolith bed is non-uniform depending on the distributor design and phase velocities and fluids properties.
(3) The combined tube array with shower distributor provides superior liquid distribution performance over the showerhead alone and nozzle distributors.
ACKNOWLEDGEMENTS
The financial support provided by the State-fundedPostgraduates’ Overseas Study Program of China Scholarship Council (CSC), which made this work possible, is gratefully acknowledged. First author Y. Zhou thanks Prof. Xueming Zheng, Hebei University of Technology, for the design of the tube array distributor.
1 Boger, T., Roy, S., Heibel, A.K., Borchers, O., “A monolith loop reactor as an attractive alternative to slurry reactors”,Catal.Today,79-80, 441-451 (2003).
2 Broekhuis, R.R., Machado, R.M., Nordquist, A.F., “The ejector driven monolith loop reactor-experiments and modeling”,Catal.Today, 69(1-4), 87-93 (2001).
3 Nijhuis, T.A., Dautzenberg, F.M., Moulijn, J.A., “Modelling of monolithic and trickle-bed reactors for the hydrogenation of styrene”,Chem.Eng.Sci., 58 (7), 1113-1124 (2003).
4 Boyer, C., Fanget, B., “Measurement of liquid flow distribution in trickle bed reactor of large diameter with a new gamma-ray tomographic system”,Chem.Eng.Sci., 57 (7), 1079-1089 (2002).
5 Chen, J., Novica, R., Al-Dahhan, M.H., Dudukovic, M.P., “Study of particle motion in packed/Ebullated beds by computed tomography(CT) and computer automated radioactive particle tracking (CARPT)”,AIChE J., 47 (5), 994-1004 (2001).
6 Schmit, C.E., Cartmel, D., Eldridge, R.B., “Process tomography: an option for the enhancement of packed vapor-liquid contactor model development”,Ind.Eng.Chem.Res., 39 (6), 1546-1553 (2000).
7 Schmit, C.E., Cartmel, D., Eldridge, R.B., “The experimental application of X-ray Tomography to a vapor-liquid contactor”,Chem.Eng.Sci., 56 (11), 3431-3441 (2001).
8 Mewes, D., Loser, T., Millies, M., “Modeling of two-phase flow in packings and monoliths”,Chem.Eng.Sci., 54 (21), 4729-4747 (1999).
9 Lebens, P.J.M., Kapteijn, F., Sie, S.T., Moulijn, J.A., “Potentials of internally finned monoliths as a packing for multifunctional reactors”,Chem.Eng.Sci., 54 (10), 1359-1365 (1999).
10 Harkins, T.H., York, K.M., Allison, J.D., Wright, H.A., “Honeycomb monolith catalyst support for catalytic distillation reactor”, US Pat.,2003/0012711 Al (2003).
11 Nijhuis, T.A., Kreutzer, M.T., Romijn, A.C.J., Kapteijn, F., Moulijn,J.A., “Monolithic catalysts as efficient three-phase reactors”,Chem.Eng.Sci., 56 (3), 823-829 (2001).
12 Roy, S., Bauer, T., Al-Dahhan, M., Lehner, P., Turek, T., “Monoliths as multiphase reactors: a review”,AIChE J., 50 (11), 2918-2938(2005).
13 Schildhauer, T.J., Kapteijn, F., Moulijn, J.A., “Stacking of film-flow monoliths for improved performance in reactive stripping”,Ind.Eng.Chem.Res., 44 (25), 9556-9560 (2005).
14 Reinecke, N., Petritsch, G., Boddem, M., Mewes, D., “Tomographic imaging of the phase distribution in two-phase slug flow”,Int.J.Multiphase Flow, 24 (4), 617-634 (1998).
15 Mantle, M.D., Sederman, A.J., Gladden, L.F., Raymahasay, S., Winterbottom, J.M., Stitt, E.H., “Dynamic MRI visualization of two-phase flow in a ceramic monolith”,AIChE J., 48 (2), 909-912 (2002).
16 Heibel, A.K., Scheenen, T.W., Heiszwolf, J.J., van As, H., Kapteijn,F., Moulijn, J.A., “Gas and liquid phase distribution and their effect on reactor performance in the monolith film flow reactor”,Chem.Eng.Sci., 56 (21-22), 5935-5944 (2001).
17 Roy, S., Al-Dahhan, M., “Flow distribution characteristics of a gas-liquid monolith reactor”,Catal.Today, 105 (3-4), 396-400 (2005).18 Bauer, T., Roy, S., Lange, R., Al-Dahhan, M., “Liquid saturation and gas-liquid distribution in multiphase monolithic reactors”,Chem.Eng.Sci., 60 (11), 3101-3106 (2005).
19 Behl, M., Roy, S., “Experimental investigation of gas-liquid distribution in monolith reactors”, Chem. Eng. Sci., 62 (24), 7463-7470 (2008).
20 Gladden, L.F., Lim, M.H.M., Mantle, M.D., Sederman, A.J., Stitt,E.H., “MRI visualisation of two-phase flow in structured supports and trickle-bed reactors”, Catal. Today, 79-80, 203-210 (2003).
21 Sederman, A.J., Heras, J.J., Mantle, M.D., Gladden, L.F., “MRI strategies for characterising two-phase flow in parallel channel ceramic monoliths”, Catal. Today, 128 (1-2), 3-12 (2007).
22 Satterfield, C.N., Ozel, F., “Some characteristics of two-phase flow in monolithic catalyst structures”, Ind. Eng. Chem. Fundam., 16 (1),61-67 (1977).
23 Xu, M., Huang, H., Zhan, X.P., Liu, H., Ji, S.F., Li, C.Y., “Pressure drop and liquid saturation in multiphase monolithic reactor with different distributors”, Catal. Today, 147, S132-S137 (2009).
24 Berčič, G., Pintar, A., “The role of gas bubbles and liquid slug lengths on mass transport in the Taylor flow through capillaries”,Chem. Eng. Sci., 52 (21-22), 3709-3719 (1997).
25 Irandoust, S., Andersson, B., “Mass transfer and liquid-phase reactions in a segmented two-phase flow monolithic catalyst reactor”,Chem. Eng. Sci., 43 (8), 1983-1988 (1988).
26 van Baten, J.M., Krishna, R., “CFD simulations of wall mass transfer for Taylor flow in circular capillaries”, Chem. Eng. Sci., 59 (12),2535-2545 (2004).
27 Vandu, C.O., Liu, H., Krishna, R., “Mass transfer from Taylor bubbles rising in single capillaries”, Chem. Eng. Sci., 60 (22), 6430-6437(2005).
28 Liu, W., Roy, S., Fu, X., “Gas-liquid catalytic hydrogenation reaction in small catalyst channel”, AIChE J., 51 (8), 2285-2297 (2005).
29 Xue, J., Al-Dahhan, M., Dudukovic, M.P., Mudde, R.F., “Bubble velocity, size, and interfacial area measurements in a bubble column by four-point optical probe”, AIChE J., 54 (2), 350-363 (2008).
30 Roy, S., Kemoun, A., Al-Dahhan, M.H., Dudukovic, M.P., Skourlis,T.B., Dautzenberg, F.M., “Countercurrent flow distribution in structured packing via computed tomography”, Chem. Eng. Process., 44(1), 59-69 (2005).
31 Al-Dahhann, M.H., Kemoun, A., Cartolano, A.R., “Phase distribution in an upflow monolith reactor using computed tomography”,AIChE J., 52 (2), 745-753 (2006).
32 Liu, H., Vandu, C.O., Krishna, R., “Hydrodynamics of Taylor flow in vertical capillaries: flow regimes, bubble rise velocity, liquid slug length, and pressure drop”, Ind. Eng. Chem. Res., 44 (14), 4884-4897(2005).
猜你喜欢
杂志排行

Chinese Journal of Chemical Engineering的其它文章
- Phenol Oxidation by Combined Cavitation Water Jet and Hydrogen Peroxide*
- Venting Design for Di-tert-butyl Peroxide Runaway Reaction Based on Accelerating Rate Calorimeter Test
- Effect of Return Sludge Pre-concentration on Biological Phosphorus Removal in a Novel Oxidation Ditch*
- Separation of α-Tocopherol with a Two-Feed Simulated Moving Bed*
- Experimental and CFD Studies on the Performance of Microfiltration Enhanced by a Turbulence Promoter*
- Pervaporation of Aqueous Solution of Acetaldehyde Through ZSM-5 Filled PDMS Composite Membrane*