Development and optimization of an antibody array method for potential cancer biomarker detection☆
2011-11-02ShungshungWngPingZhoBrinCo
Shungshung Wng, Ping Zho, Brin Co,*
aKey Laboratory of Antibody Technology of Ministry of Health, Nanjing Medical University, Nanjing, Jiangsu Province 210029, China;
bAntibody Technology Laboratory, Van Andel Research Institute, Grand Rapids, MI 49503, USA.
INTRODUCTION
In cancer, a biomarker refers to a substance or process that is indicative of the presence of cancer in the body. Great efforts have been put forth to develop new methods for rapid, sensitive and accurate detection of biomarkers. A biomarker could be either a molecule secreted by tumor or a specific response of the body to the presence of cancer. Genetic, epigenetic, proteomic,glycomic and imaging biomarkers can be used for cancer diagnosis, prognosis and epidemiology study[1].Biomarkers measured in a variety of patient samples,including blood, tissue, urine and cerebrospinal fluid,are used in a diverse array of clinical settings. The application of biomarkers to cancer is leading the way because of the unique association of genomic changes in cancer cells with the disease process.
Pancreatic cancer is the sixth highest cause of mor-tality from malignant tumors in Europe and the fourthhighest in the United States[2,3]. The dismal prognosis of pancreatic cancer is due to the late stage at which it is usually diagnosed because pancreatic cancer patients seldom exhibit disease-specific symptoms until late in the course of the disease[4,5], and the high invasive and metastatic potential of pancreatic tumors result in a low rate of curative resections and a high frequency of relapse. Long-term survival from pancreatic cancer is possible if the disease is identified at an early stage[6,7]. Therefore, biomarkers play an important role in the detection at an early stage. Several serum markers have been investigated for pancreatic cancer. Elevated CA19-9 level has been cited as a potential marker of the disease[8-12], and other existing biomarkers relate to the inflammation that associates with the tumor and other pancreatic diseases that may be present[13-15].
Recently, various microarray formats have been utilized for studying glycosylation patterns[16,17]. In one study examining serum samples from patients with colon and pancreatic cancers, glycoproteins extracted from the serum were printed on glass slides and hybridized against various lectins to study changes in the glycan patterns during cancer progression[18,19]. The antibody microarray is a favorable format for high throughput analysis, with high specificity and reproducibility[20-22].
In 2007, the Lustgarten Foundation undertook an extensive bioinformatics analysis of the published literature to identify the top 60 most promising biomarkers for pancreatic cancer. In the present study, we selected four biomarkers Hippocalcin-like 1 (HPCAL1),phosphatidylethanolamine binding protein 1 (PEBP1),lectin galactoside-binding soluble 7 (LGALS7)and serpin peptidase inhibitor clade E member 2 (SERPINE2)to develop an antibody microarray system that could have potential clinical diagnostic applications.The current study focused on two areas: one was to optimize the standard curves of these four biomarkers so that they can be used to calculate the concentration of biomarkers quantitatively; the other was to investigate the cross-reactivity and to further develop array-based assay so that multiple biomarkers can be detected in a single assay.
MATERIALS AND METHODS
Materials
HPCAL1, PEBP1, LGALS7 and SERPINE2 proteins and corresponding antibodies were generated as previously described[23]. Antibody microarrays were prepared as previously described[24].
Methods
An outline of the experiment flow of microarray proecessing is described in Fig 1. A piezoelectric contact printer (Auson 2470 Arrayer)was used to spot approximately 260 pL of each antibody solution at a certain concentration on the surfaces of nitrocellulosecoated glass microscope slides (PATH slides; GenTel Biosciences, Madison, USA). Forty-eight identical arrays were printed on each slide, with each array consisting of two different antibodies at first. When the conditions were optimized, then coated four antibodies were coated to detect the cross-reactivity. All of the antibodies were mouse monoclonal antibodies targeting human proteins HPCAL1, PEBP1, LGALS7 and SERPINE2. Each capture antibody was printed in triplicate, and biotinylated BSA was printed as control(Fig. 2). A wax border was imprinted around each of the arrays to define hydrophobic boundaries (SlideImprinter, The Gel Company, San Francisco, CA, USA).The printed slides were stored at 4°C in a desiccated,vacuum-sealed slide box until use.
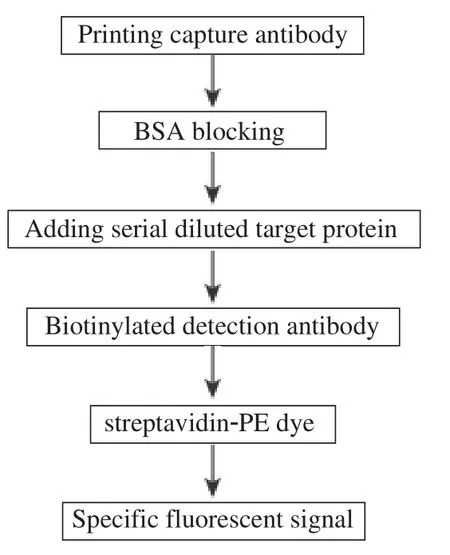
Fig. 1 An outline of the experiment flow of microarray processing.
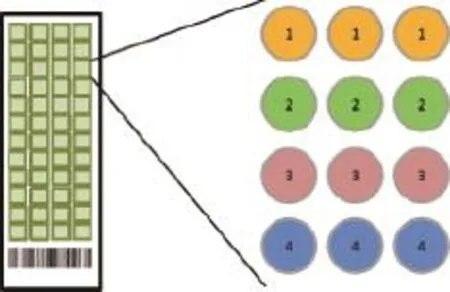
Fig. 2 Microarray slides. The microarray was patterned as follows: 1) the first row with anti-HPCAL1 (5A5), diluted in PBST0.05; 2)the second row with anti-HPCAL1 (5A5), diluted in PBS; 3)the third row with anti-PEBP1 (8E2), diluted in PBST0.05; and 4)the last row with anti-PEBP1 (8E2), diluted in PBS. The antibody concentration was 250 μg/mL.
For condition optimization, capture antibodies printed on slides were diluted in two different buffers: PBS and PBST0.05 (PBS with 0.05% Tween-20),and with three different concentrations: 250 μg/mL,500 μg/mL, and 750 μg/mL. For multi-marker detection system, capture antibodies were only diluted in PBST0.05 with one concentration at 500 μg/mL. First,vacuum sealed arrays were equilibrated with ambient temperature for 30 min before use. Slides were washed in PBST0.5 (PBS with 0.5% Tween-20)for 3 min with gentle shaking, and dried by centrifuging for 2 min at 900 g. Then, the slides were blocked with 1% BSA in PBST0.5 for 1 h in a humidified chamber to prevent from evaporating. Excess capture antibodies were washed away with the blocking buffer by shaking. A serial dilution of protein or protein mixture samples containing 0.1% Brij-35 (Pierce, Rockford, IL, USA)in PBST0.1 (PBS with 0.1% Tween-20)were applied and incubated for 1 h at room temperature (RT)or overnight at 4°C with gentle agitation. Excess protein was removed by three washes with PBST0.5, each for 3 min with shaking. Then biotinylated detection antibodies either along or mixed together, were diluted to 3 μg/mL with 0.1% BSA/PBST0.1 and added to the corresponding blocks, incubating for 1 h at RT. The arrays were washed with PBST0.5 and blocked briefly with 1% BSA/PBS before probing with streptavidin-PE. The streptavidin-PE was diluted to 2 μg/mL with PBST containing 0.1% BSA and probed to the array for 1 h. The labeled slide was washed with PBST0.5 for three times, and dried by centrifugation. The slides were scanned using a GenePix 4000B microarray scanner, and the data were processed using GenePix Pro 3.0 software[25].
RESULTS
Comparison of capture antibodies diluted in PBS and PBST0.05
Using the microarray format, we compared the conditions of the experiment. First, we printed two capture antibodies anti-HPCAL1 5A5 and anti-PEBP1 8E2 in two different buffers, PBS and PBS with 0.05%Tween-20. After blocking and washing away the excess antibodies, serially diluted HPCAL1 and PEBP1 proteins were applied to the multiplexed arrays. Following incubation and washes, the arrays were probed with the respective biotinylated detection antibodies anti-HPCAL1 1E10 and anti-PEBP1 4F10. Fluorescent signal was generated by incubating the arrays with streptavidin-PE. The experiment was repeated for confirmation. The results in Fig. 3 showed that antibodies in PBST0.05 had much stronger signals than in PBS.
Concentration comparison of capture antibodies
To optimize the concentrations of the capture antibodies, we printed slides with 3 different concentrations of the two capture antibodies, anti-HPCAL1 5A5 and anti-PEBP1 8E2 at 250 μg/mL, 500 μg/mL and 750 μg/mL. Serially diluted HPCAL1 and PEBP1 were applied to the arrays, respectively. The results showed, that the concentrations of 500 μg/mL and 750 μg/mL had no significant impact on fluorescent signal; signals might be saturated at the concentration of 750 μg/mL. So the optimal concentration for the capture antibodies was set to 500 μg/mL (Fig. 4).
Incubation temperature comparison
To optimize the incubation temperature conditions of the antibody array, after HPCAL1 and PEBP1 proteins were applied to the arrays, the slides were incubated either overnight (O/N)at 4°C, or for 1 h at RT separately with the same other conditions. The results showed that the signal of overnight incubation at 4°C is much stronger than 1 h at RT (Fig. 5).
Antibody specificity and cross-reactivity test
After the conditions were optimized (the capture antibody at 500 ng/mL in PBST0.05, and incubation overnight at 4°C), we next investigated the specificities of each antibody, and whether there were crossreactivity among antibodies to different proteins. In this experiment, four sets of capture and detection antibodies against four different antigens (HPCAL1,PEBP1, LGALS7 and SERPINE2)were compared and analyzed in all possible combinations. As shown in Fig. 6, for example, when HPCAL1 protein was present, HPCAL1 capture Ab 5A5 only captured HPCAL1, and its detection Ab 1E10 only detected HPCAL1 protein. These results demonstrated that each capture and detection antibody were specific to their corresponding protein, and the cross-reactivity to other proteins was either none or extremely low. The protein concentrations were set to high at 125 ng/mL or 256 ng/mL to avoid background interference.
Simultaneous detection of HPCAL1, PEBP1,LGALS7 and SERPINE2
Our final goal was to establish an assay system which allowed detecting multiple biomarkers in a single setting. We proved that the antibodies to each protein were specific and did not cross-react with any other proteins (Fig. 6). In this experiment, capture antibodies were printed onto slide separately; four different proteins were mixed and incubated with capture antibodies on the slide followed by incubating with mixed detection antibodies. The results in Fig. 7(A-H)showed that the sensitivity reached to 2 ng/ml. When the concentrations of these four biomarkers were below 256 ng/ml, the fluorescence and biomarker concentration displayed a liner correlation shown in Fig.7(I-L).
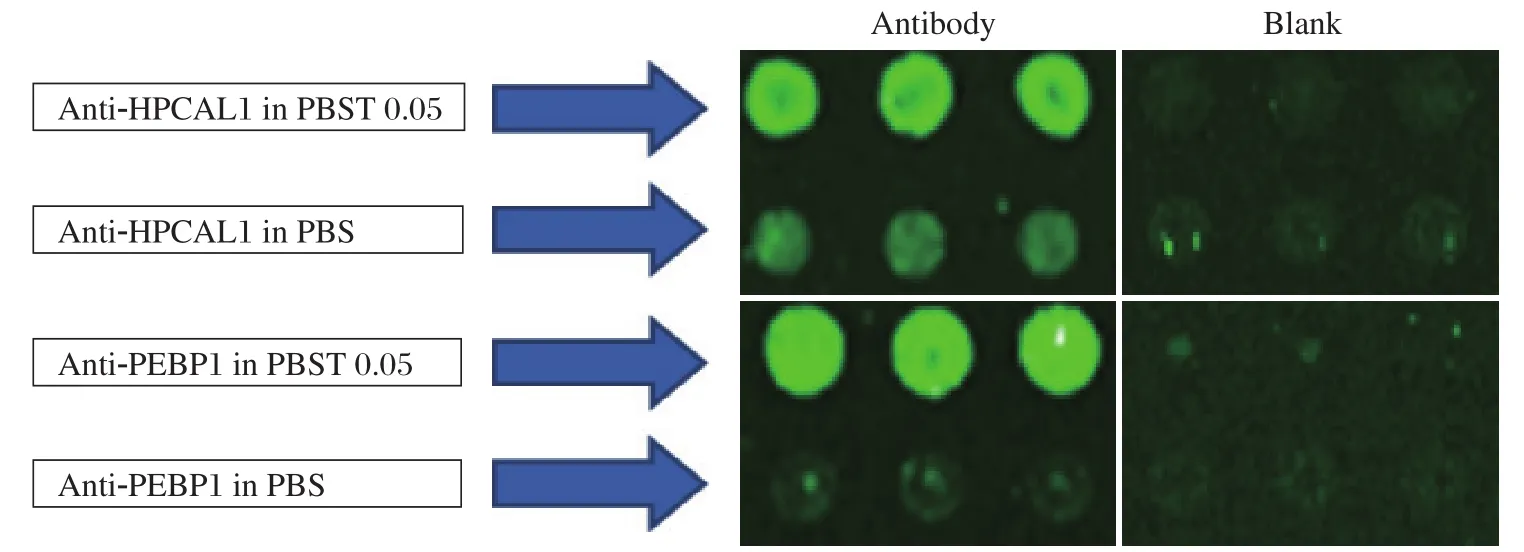
Fig. 3 Comparison of capture antibodies diluted in PBS and PBST0.05. Microarray slides were patterned as in Fig 1. The two proteins were applied to the arrays, respectively, followed by detecting with detection antibodies and fluorescence labeling with PE.
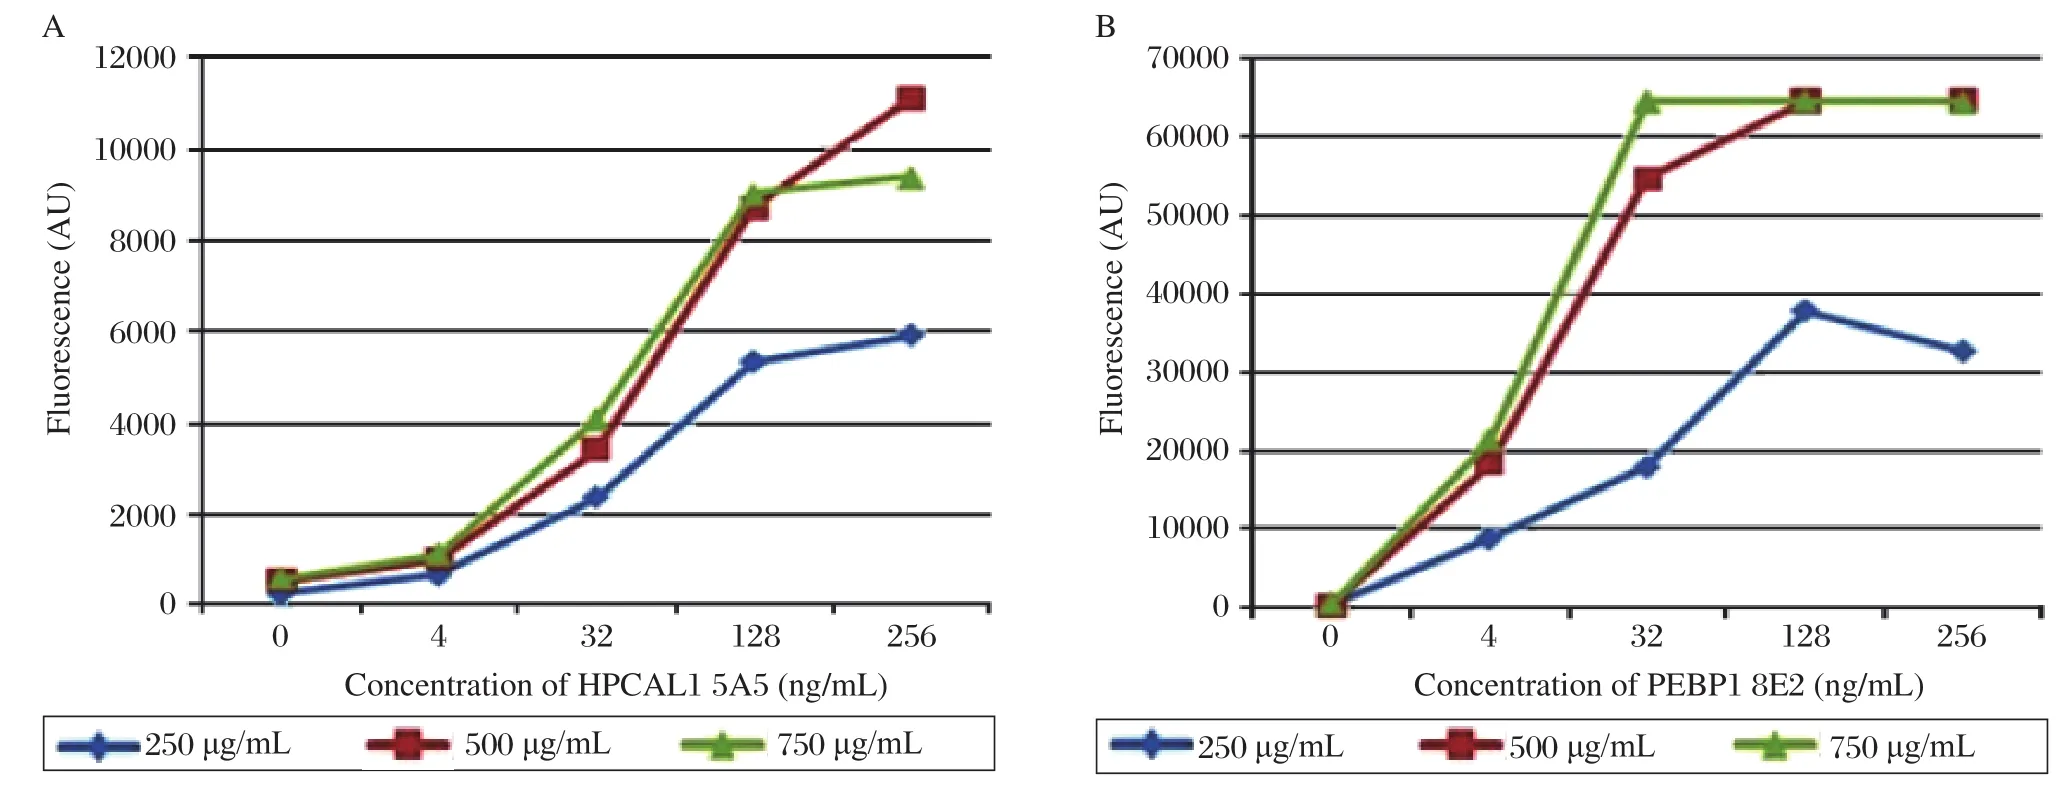
Fig. 4 Concentration comparison of the capture antibodies. (A)Serially diluted HPCAL1 in PBST0.1 containing 0.1% Brij were applied to the arrays which were printed with different concentrations of the capture antibody anti-HPCAL1 5A5. (B)Serially diluted PEBP1 in PBST0.1 containing 0.1% Brij were applied to the arrays which were printed with different concentrations of the capture antibody anti-PEBP1 8E2.
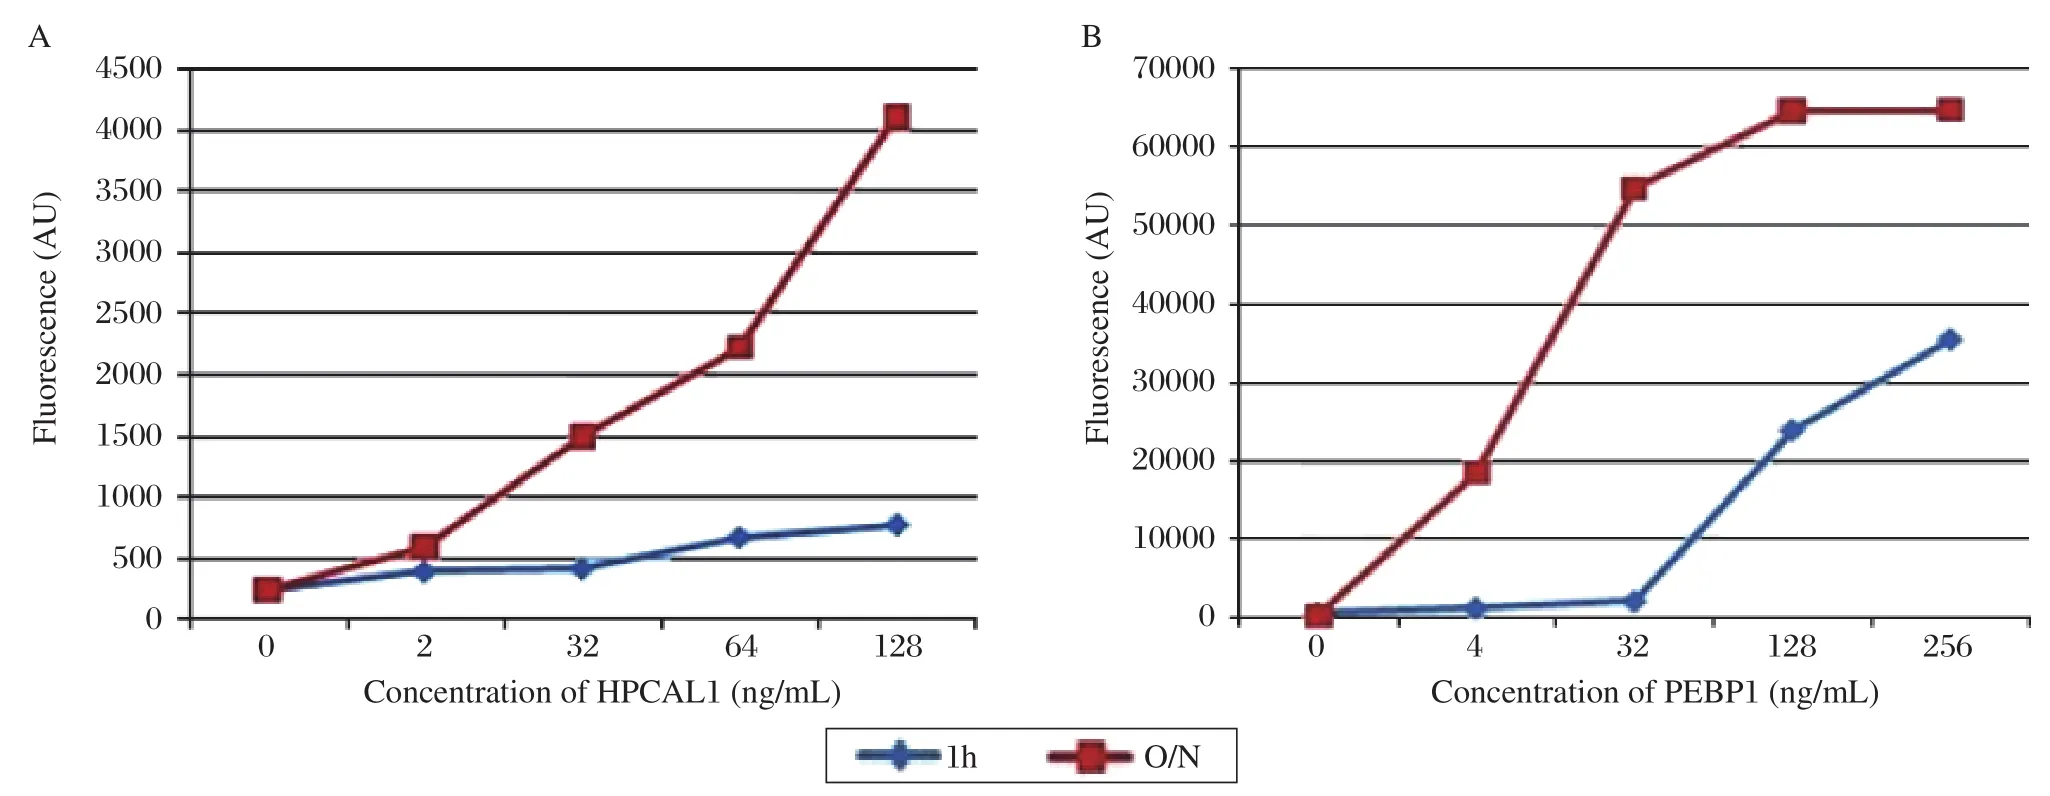
Fig. 5 Comparison of protein incubation for 1 h at room temperature and overnight at 4°C. The results showed that the signal of overnight at incubation 4°C was much stronger than that of 1 h at room temperature. A: HPCAL1; B: PEBP1.
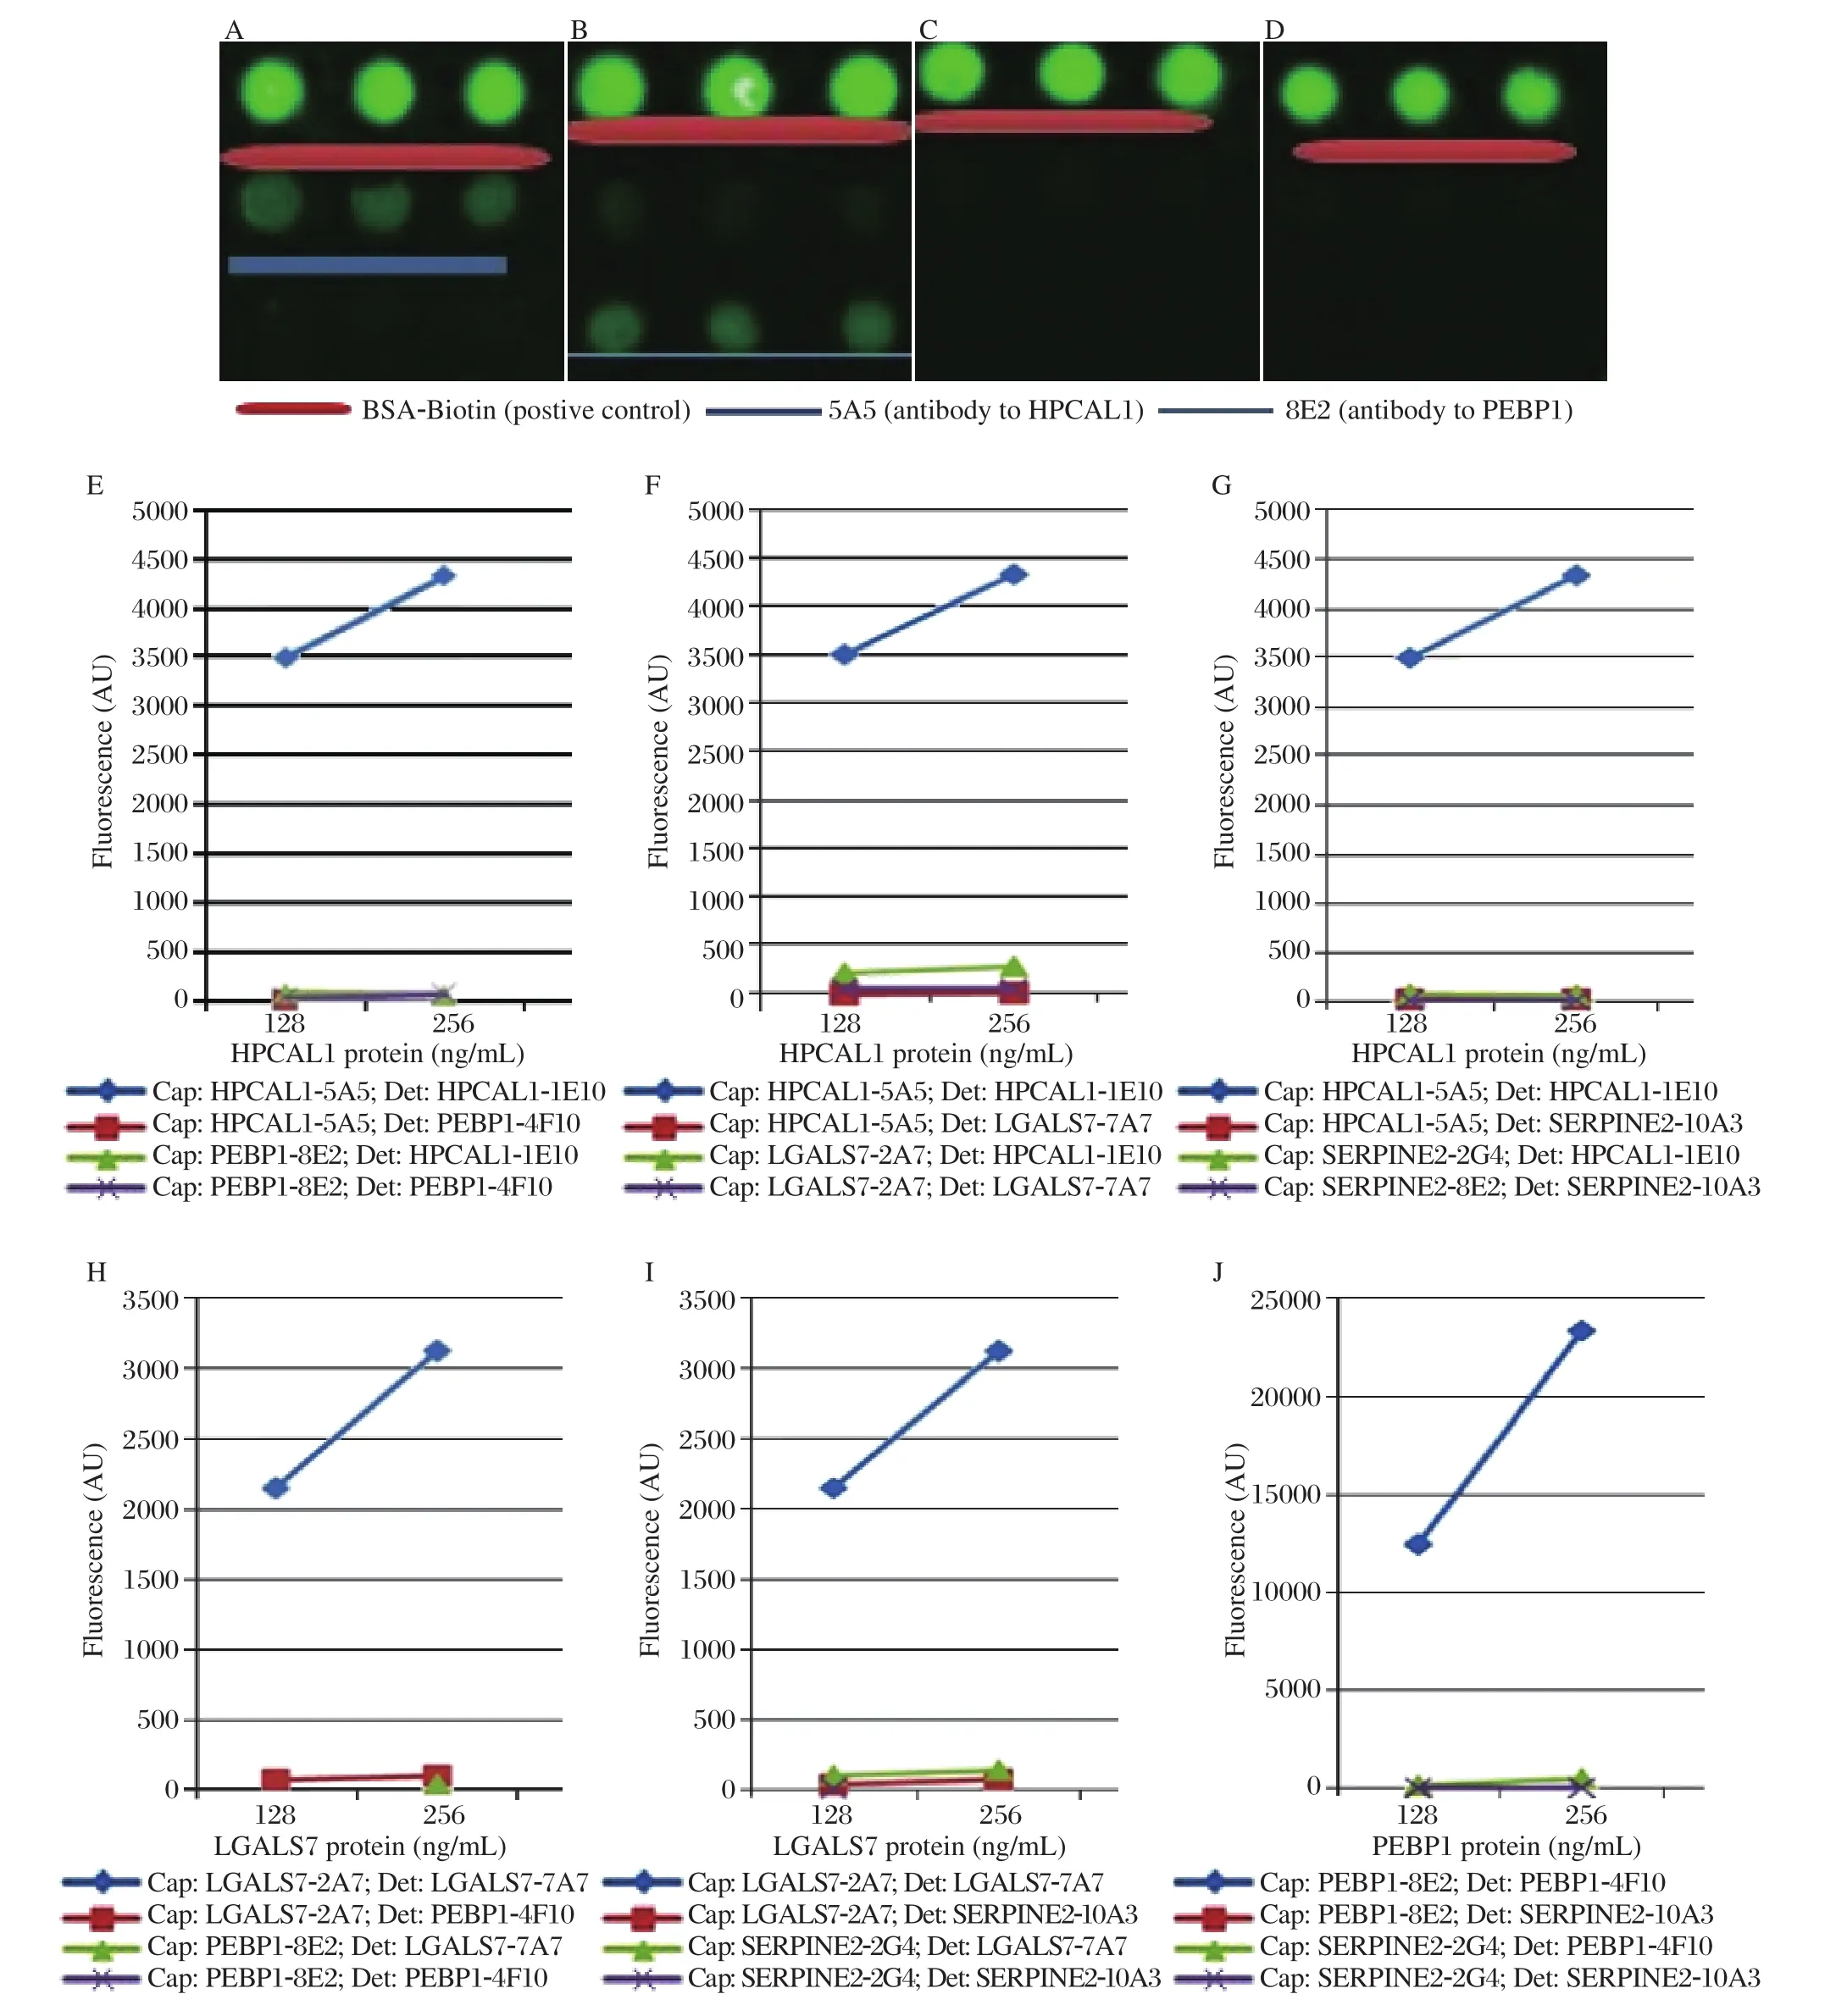
Fig. 6 Antibody specificity tests. Firstly, the cross-reactivity was tested between HPCAL1 and PEBP1, and the results (A-E)showed that there was no cross-reactivity observed. A: HPCAL1 protein was added and the detection antibody was HPCAL1 1E10.B: PEBP1 protein was added and the detection was PEBP1 4F10. C: HPCAL1 protein was added, and the detection antibody was PEBP1 4F10. D: PEBP1 protein was added, and the detection antibody was HPCAL1 1E10. Secondly, the cross-reactivity tests were conducted among HPCAL1-5A5, PEBP1-8E2, LGALS7-2A7 and SERPINE2-2G4. The results showed that there were no crossreactivities betweeh each two of the four proteins. E: cross-reactivity tests between HPCAL1 and PEBP1. F: cross-reactivity tests between HPCAL1 and LGALS7. G: cross-reactivity tests between HPCAL1 and SERPINE2. H: cross-reactivity tests between LGALS7 and PEBP1. I: cross-reactivity tests between LGALS7 and SERPINE2. J: cross-reactivity test between PEBP1 and SERPINE2. Cap:Capture antibody; Det: Detection antibody.
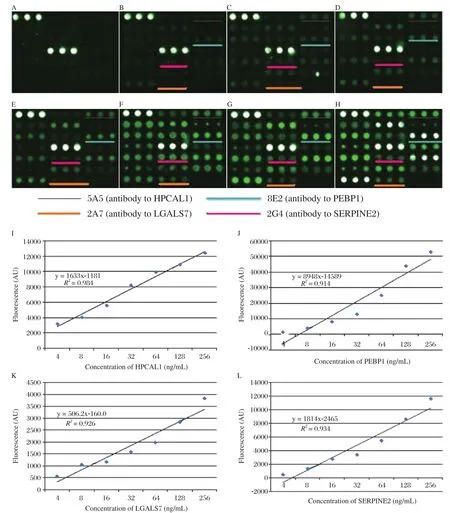
Fig. 7 Simultaneous detection of HPCAL1, PEBP1, LGALS7 and SERPINE2 by detection cocktail antibodies. Serially diluted mixture of HPCAL1, PEBP1, LGALS7 and SERPINE2 (A: blank control. B: 2 ng/mL. C: 4 ng/mL. D: 16 ng/mL. E: 32 ng/mL. F: 64 ng/mL. G: 128 ng/mL. H: 256 ng/mL)were probed, followed by detection with antibody cocktail. The other spots not underlined were other different proteins not shown in this paper. I-L showed that when the concentration of these four markers were below 256 ng/mL, the fluorescence and biomarker concentration displayed a linear correlation (I: HPCAL. J: PEBP1. K: LGALS7. L:SERPINE2).
DISCUSSION
In this study we optimized the conditions of antibody arrays. Four potential biomarkers for pancreatic cancer diagnosis were chosen, and their correspond-ing antibodies were printed on coated glass slides. We found that when the concentration of the capture antibodies was at 500 μg/ml in PBST0.05 and the slides were incubated overnight at 4°C, the arrays gave the strongest signals. Simultaneous detection of these four markers worked very well with almost no crossreactivity. Moreover, the fluorescence and biomarker concentration displayed a linear correlation.
The experimental features of microarrays have advantages for cancer research. The advantage of low sample volume results in the consumption of small amounts of both precious clinical samples and expensive antibodies. The assays can be run efficiently in parallel, enabling studies on large populations of samples that are necessary for biomarker discovery and validation. In addition, the assays have good reproducibility, high sensitivity and quantitative accuracy over large concentration ranges[26].
In the future, we hope to establish collaboration with hospitals or clinical diagnostic laboratories, run pancreatic cancer serum samples using antibody array format to identify differences in these potential biomarkers compared to normal and pancreatitis serum samples. Patient sera with different types and stages of pancreatic cancer will also be examined. Pancreatic cancer continues to have a high mortality rate due to detection at a late stage of the disease. We hope that the antibody array technology would eventually be able to provide a practical means to characterize patterns of variation in hundreds of thousands of different proteins in clinic and research applications.
Acknowledgements
We thank Drs. Brian Haab and Tingting Yue at Van Andel Research institute for their advices and help with the antibody array technology and Ms. Amy Nelson for her administrative assistance.
[1]Mishra A, Verma M. Cancer Biomarkers: Are We Ready for the Prime Time? Cancers 2010;2:190-208.
[2]Li D, Xie K, Wolff R, Abbruzzese JL. Pancreatic cancer.The Lancet 2004;363:1049-1057.
[3]Wu XC, Hotes JL, Fulton PJ. Cancer in North America-1999, North American Association of central cancer Registries, Springfield, IL (1995), P.2002.
[4]Jemal A, Siegel R, Ward E, Murray T, Xu J, Thun MJ.Cancer statistics, 2007. CA Cancer J Clin 2007;57:43-66.
[5]S.S.Nitecki, M.G. Sarr, T.V. Colby, J.A. Van Heerden.Long term survival after resection of ductal adenocarcinoma of the pancreas: is it really improving? Ann Surg 1995;59-66.
[6]Cleary SP, Gryfe R, Guindi M, Greig P, Smith L, Mackenzie R, et al. Prognostic factors in resected pancreatic adenocarcinoma: analysis of actual 5-year survivors. J Am Coll Surg 2004;198:722-31.
[7]Tanase CP, Neagu M, Albulescu R, Hinescu ME. Advances in Pancreatic cancer detection. Adv Clin Chem 2010;51:145-80.
[8]Mann DV, Edwards R, Ho S, Lau WY, Glazer G. Elevated tumour marker CA19-9: clinical interpretation and influence of obstructive jaundice. Oncol 2000;26:474-479.
[9]Ferrone CR, Finkelstein DM, Thayer SP, Muzikansky A,Fernandez-delCastillo C, Warshaw AL. Perioperative CA19-9 levels can predict stage and survival in patients with resectable pancreatic adenocarcinoma. J Clin Oncol 2006;24:2897-2902.
[10]Boeck S, Stieber P, Holdenrieder S, Wilkowski R, Heinemann V. Prognostic and therapeutic significance of carbohydrate antigen 19-9 as tumor marker in patients with pancreatic cancer. Oncology 2006;70:255-264.
[11]Chang CY, Huang SP, Chiu HM, Lee YC, Chen MF, Lin JT. Low efficacy of serum levels of CA 19-9 in prediction of malignant diseases in asymptomatic population in Taiwan. Hepatogastroenterology 2006;53:1-4.
[12]Buxbaum JL, Eloubeidi MA. Molecular and clinical markers of pancreas cancer. JOP 2010;11:536-44.
[13]Wigmore SJ, Fearon KC, Sangster K, Maingay JP, Garden OJ, Ross JA. Cytokine regulation of constitutive production of interleukin-8 and -6 by human pancreatic cancer cell lines and serum cytokine concentrations in patients with pancreatic cancer. J Oncol 2002;21:881-886.
[14]Fearon KC, Barder MD, Falconer JS, McMillan DC,Ross JA, Preston T. Pancreatic cancer as a model: inflammatory mediators, acute-phase response, and cancer cachexia. World J Surg 1999;23:584-8.
[15]Dube DH, Bertozzi CR. Glycans in cancer and inflammation--potential for therapeutics and diagnostics. Nat Rev Drug Discov 2005;4:477-88.
[16]Li C, Simeone DM, Brenner DE, Anderson MA, Shedden KA, Ruffin MT, et al. Pancreatic cancer serum detection using a lectin/glycol-antibody array method.Journal of Proteome Research 2009;8:483-92.
[17]KunoA, Uchiyama N, Koseki-kuno S, Ebe Y, Takashima S, Yamada M. et al. Evanescent-field fluorescenceassisted lectin microarray: a new strategy for glycan profiling. Nat Mathods 2005;2:851-6.
[18]Zhao J, Patwa TH, Qiu W, Shedden K, Hinderer R, Misek DE, et al. Glycoprotein microarrays with multi-lectin detection: unique lectin binding patterns as a tool for classifying normal, chronic pancreatitis and pancreatic cancer sera. Journal of Proteome Research 2007;5:1864-74.
[19]Qiu Y, Patwa TH, Xu L, Shedden K, Misek DE, Tuck M,et al. Plasma glycoprotein profiling for colorectal cancer biomarker identification by lectin glycoarray and lectin blot. Journal of Proteome Research 2008;7:1693-1703.
[20]Ingvarsson J, Wingren C, Carlsson A, Ellmark P, Wahren B, Engstrom G, et al. Detection of pancreatic cancer using antibody microarray-based serum protein profiling.Proteomics 2008;11:2211-9.
[21]Haab BB. Applications of antibody array platforms. Current Opinion in Biotechnology 2006;4:415-21.
[22]Orchekowski R, Hamelinck D, Li L, Gliwa E, vanBrocklin M, Marrero JA, et al. Antibody microarray profiling reveals individual and combined serum proteins associated with pancreatic cancer. Cancer Research 2005;23:11193-202.
[23]Wang X, Wang S, Tang X, Zhang A, Grabinski T, Guo Z,et al. Development and evaluation of monoclonal antibodies against phosphatidylethanolamine binding protein 1 in pancreatic cancer patients. Journal of Immunological Methods 362 (2010)151-160
[24]Zhou H, Bouwman K, Schotanus M, Verweij C, Marrero JA, Dillon D, et al. Two-color, rolling-circle amplification on antibody microarrays for sensitive, multiplexed serum-protein measurements. Genome Biol 2004;5:R28.
[25]Lian W, Wu D, Lim DV, Jin S. Sensitive detection of multiplex toxins using antibody microarray. Analytical Biochemistry 2010;401:271-9
[26]Haab, BB, Dunham MJ, Brown PO. Protein microarrays for highly parallel detection and quantitation of specific proteins and antibodies in complex solutions. Genome Biol 2001;2:1-13
杂志排行

THE JOURNAL OF BIOMEDICAL RESEARCH的其它文章
- A mutation in the type II hair keratin KRT86 gene in a Han family with monilethrix☆
- Single-dose and multiple-dose pharmacokinetics of zaltoprofen after oral administration in healthy Chinese volunteers
- The role of microRNAs during the genesis of medulloblastomas induced by the hedgehog pathway
- 《生物医学研究杂志(Journal of Biomedical Research)》宣布与汤森路透合作——采用国际一流的在线投审稿系统ScholarOne Manuscripts
- Instructions for Authors
- Cryptosporidiosis-an overview