Temporal Trend and Source Implication of Soil PCDD/Fs in South Korea
2011-01-15JINGuangzhuQUANHongmei
JIN Guang-zhu, QUAN Hong-mei
(1.Chem ical Research Division,Department of Environmental Health Risk Research,National Institute of Environmental Research,Environmental Research Com p lex,Incheon 404-708,Korea;
2.Department of Chem istry,College of Sciences,Yanbian University,Yanji 133002,China)
Temporal Trend and Source Implication of Soil PCDD/Fs in South Korea
JIN Guang-zhu1, QUAN Hong-mei2
(1.Chem ical Research Division,Department of Environmental Health Risk Research,National Institute of Environmental Research,Environmental Research Com p lex,Incheon 404-708,Korea;
2.Department of Chem istry,College of Sciences,Yanbian University,Yanji 133002,China)
This study set out to review temporal trend of soil polychlorinated dibenzo-p-dioxins and dibenzofuran(PCDD/F)levels for ten years and identified potential PCDD/F emission sources for different type soils in South Ko rea.Soil samp les showed high variations between the different samp ling sites and periods.However,compared w ith air samp les,no significant decline trend of PCDD/F levels in Ko rea surface soil was observed during 1999—2009.Soil act as a reservoir fo r persistent o rganic pollutants(POPs)and the degradation half life time(17—274 years)of PCDD/Fs in soil is long,these suggesting gradual declineof the PCDD/F levels in soil.Principal component analysisof 17 PCDD/F congeners reveal that PCDD/Fs in the industrial soil and rural air were mainly influenced by urban industrial sources,w hile those of the agricultural soil were influenced other sources such as agricultural chemicals.
soil;PCDD/Fs;temporal trend;congener p rofile;source imp lication
1 Introduction
So far,numerous soil monito ring of po lychlorinated dibenzo-p-dioxins and dibenzofurans(PCDD/Fs)were conducted for both global and regional-scale.Few toxic congeners of PCDD/Fs could be originated from some old used pesticides in agriculture such as PCP,CNP[1].Higher concentrations of PCDD/Fs in paddy soils than those in the non-agricultural soils have been reported[2],paddy soils could be a secondary source fo r PCDD/Fs in aquatic environment[3].
The number of PCDD/Fs studies in the Korean environment has increased recently thanks to a series of global initiatives on POPs and an increasing concern about the risks that these chem icals pose to human health and the environment.However,there wasonly limited information at the temporal trend regarding the current status of PCDD/Fs pollution in the soil on a national scale in South Ko rea,and w hen undertaken,the focus w as on existing heavily polluted areas,especially in the large scale incinerato rs etc.Therefore,Korea M inistry of Environment has initiated a national survey p roject to investigate the POPs levels in air,soil,water,sediment from 2008.This paper is review ed the temporal trend of recent ten years of PCDD/F levels in surface soil in South Korea,and also evaluated possible sources of soils PCDD/Fs in South Ko rea.Results from this study are very important to obtain national scale background database of those chem icals.
2 Data Collection and Statistical Analysis Data of soil PCDD/Fs referred from p revi-
ously published research p roject report or papers during 1999 and 2009[4-5],w hich were mainly conducted by National Institute of Environment Research,Korea.Principal component analysis(PCA)fo r 17 toxic PCDD/F congeners was conducted w ith SPSS 12.0 to compare the PCDD/F p rofiles in the soils[6]and air[7]samp les.Some concentrations below detection limits were substituted by a value of zero.Then,the concentrations of 17 PCDD/Fs were normalized by dividing by the total PCDD/Fs concentrations for each samp le,p roducing data ranging from 0-1.Finally,these no rmalized PCDD/F compositions were used as input data for PCA.The first p rincipal component(X-axis:PC1)accounted fo r 36.8%of the variance,and the second p rincipal component(Y-axis:PC2)accounted for 28.5%of the variance.
3 Levelsand Possible Sources
Elevated levels observed in soil samp les from industrial area than other category(residential,agricultural,etc)sites.There are no unified international guidelines for PCDD/Fs in soils.Concentrations of PCDD/Fs in soils samp les from 57 sites in 2008[6],were ranged from 0.04 to 10.8 pg I-TEQ/g d.w.,w ith median and mean values of 0.99 and 1.90 pg I-TEQ/g,12%of samp les exceed the Canada guideline value of 4 ng TEQ/kg for all land use.Based on the agricultural soil guidelines of 4.0-10 pg/g d.w.from Newzealand,Gemany and Canada[8-10],most soil samp les could be judged as no t polluted by PCDD/Fs.Spatial distributions of soil PCDD/Fs(Fig.1)show s that the levels of soil PCDD/Fs were found to be the highest in industrial area of South Ko rea(I2:10.8 pg I-TEQ/g,I8:10.4 pg I-TEQ/g),followed in agricultural area(A 5:7.40 pg I-TEQ/g).Site I2 is located in a big industrial comp lex and a high population density area.Site I8 is located in a big steel p roduction comp lex.In general,the spatial distributions of soil PCDD/Fs w ere m uch differ w ith that of air PCDD/Fs w here relatively high air levels w ere observed vicinity of site I8,I9 and A 5[6].Therefore,there is might other sources influenced soil PCDD/Fs than air PCDD/Fs.In this study,site A 5 located in rural paddy field and surround w ith woods and fields and 5 km far from east coast of Korea.Surrounding areas of site I9(6.9 pg I-TEQ/g),w as famous fo r typical paddy field for a long time in South Korea,and they have areas of paddy fields of mo re than app roximately 26%in each city[11].Higher levels of PCDD/Fs also have been detected soil samp le f rom paddy field in Japan and major potential source were identified as impurities in some herbicides such as PCP and CNP[3].The PCDD/Fs in sediment samp les f rom Gw angyang Bay(near site I9),South Korea were found to come from a m ixture of the impurities of pentachlo rophenol(PCP),chloronitrofen(CNP)and com bustion[12]. These PCDD/F sources have been influenced by the characterization associat-ed w ith this region w hich w as both an agricultural-centered and industrial-centered area[12].The PCN consump tion w asmost abundant in the 1970s and CNP consump tion was peaked during the 1970s and 1980s and all of both decreased untilmiddle of the 1990sw hen their usageswere inhibited[13].Site I1 near the demilitarized zone(DM Z)in the 38th parallel in South Korea,there are no large industrial sources o r know n extensive emission sources.However,relatively higher soil PCDD/Fs levels(5,416 fg TEQ/g)than that of background sites(1.0 pg TEQ/g)w as observed in this study.This is need to mo re field investigation in the future.These results are suggesting the po tential impacts of industrial and agricultural sources of PCDD/Fs.
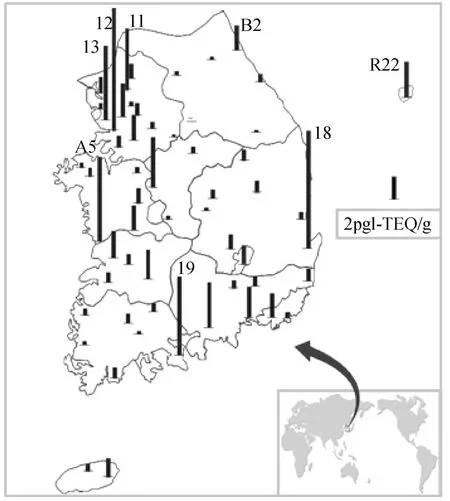
Fig.1 Spatial distributions of PCDD/Fs in surface soils in South Korea in 2008I.industrial 9;R.residential 28;A.agricultural 16;B.background 4
4 Temporal Trend
PCDD/Fsmonito ring in environmental samp les in South Korea have been conducted from late 1990[14-15].The Korean government has regulated PCDD/F em issions from M SW Is since 1997(>50 ton/d,old 0.5 ng I-TEQ/m3,new 0.1 ng I-TEQ/m3)w hich resulted small size incinerato rs became the majo r point source of PCDD/Fs emission in Korea[16],and reinforced the regulation in 2004 (>25 kg/h,old 10 ng ITEQ/m3,new 5 ng I-TEQ/m3)[17],resulting in a total decrease of PCDD/Fs emissions.Meanw hile,biannually national dioxin em ission inventories of the atmosphere were announced from 2005.In January 2007,South Korea became an official signatory of the Stockholm Convention.Fo r the effective imp lementation of the Stockholm Convention,the Korean government p romulgated a special law on POPs management in 2008 and regulated PCDD/F emissions f rom other industrial sources(such as metallurgy and non-metallic industries etc.)from 2009.As a result,the contribution to atmospheric PCDD/Fs from incinerators has decreased from 88%to 49%during 2001 and 2007.In 2007,the amount of PCDD/F and PCB emissions to the atmosphere in South Ko rea w as estimated to be 188 g,w hich means a decrease of 81%compared to 2001 (1 004 g/year)[18]. Those decreasing amounts of atmospheric emissions of PCDD/Fs mostly contributed to the decreasing trend of atmospheric levels.The law reinforcement and imp lementation of best available techniques/best environmental p ractices (BA T/BEP) at the emission sources resulted in the reduction of PCDD/Fs from those facilities[19-20].Fig.2 show s tempo ral trend of soil levels of PCDD/Fs in South Korea f rom 1999 to 2009.Decreasing trend of PCDD/F levels has been observed in environmental samp les[20-23]and biota samp les[24]from South Ko rea.Fo r atmospheric PCDD/Fs,mean concentrations decreased from 425 to 28 fg I-TEQ/m3from 1999 to 2008 w hich accounts fo r a 93%reduction in air levels.Similar trend also observed in soil samp les from other counties or regions[25]. However,no significant decline trend of PCDD/F levels in Ko rea surface soil was observed during 1999—2009.Compared w ith air samp les,soil samp les show ed high variations between the different samp ling sites and periods.Soil act as a reservoir fo r POPs and the degradation half life time(17—274 year)of PC-DD/Fs in soil is long[26],these suggesting gradual decline of the PCDD/F levels in soil.

Fig.2 Tem poral trend of PCDD/F levels in Korea surface soil from 1999 to 2009(Median,max,m in value).
5 Congener Pattern and Source Im plications
The congener pattern usually p rovides clues about the source &fo rmation of these substances[27-28].W ith regard to congener patterns of 17 toxic PCDD/F isomers w ere different by sampling period and sampling area.According to soil PCDD/Fs monitoring for 57 soil sample in 2008[6],the dominant congeners of PCDD/Fs in soil samp les were OCDD(67%)followed by 1,2,3,4,6,7,8-HpCDD(8.1%).Industrial areas show ed higher fractions of 1,2,3,4,6,7,8-HpCDD(9.3%)and 1,2,3,4,6,7,8-HpCDF(11%)and lower OCDD (46%)than those of other area.OCDD and 1,2,3,4,6,7,8-HpCDF are indicatory PCDD/Fs of atmospheric emission sources such as w aste incinerato r,metallurgical industries and traffic mobile sources[29].The operation of incinerator have been found directly influenced the observed PCDD/F congener p rofiles of the around environmental samp les,such as soil,air,and pine needles[30].The dominant congeners of PCDD/Fs in air samp les were OCDD(annual 31%)follow ed by 1,2,3,4,6,7,8-HpCDF(annual 25%).An elevated 1,2,3,4,6,7,8-HpCDF level w as observed in samp les collected during w inter and sp ring and elevated OCDD values w ere observed in summer and autum n samp les.The dominant congeners of PCDD/Fs in PCP formulation was reported as OCDD(mean:79%,61%—98%),follow ed by 1,2,3,4,6,7,8-HpCDD(mean:8.2%,0.73%—16%)and OCDF(mean:7.6%,0.80%—15%)[31].Elevated levels of OCDD w as also observed in soil samp les from agricultural area(77%),followed by residential area(69%),background area(65%)and industrial area(46%),suggesting that PCDD/Fs in agricultural soil were mainly influenced by old used PCP fo rmulations and industrial areas w ere mainly influenced by industrial sources such as combustion p rocess.For air PCDD/Fs,samp les from residential and industrial areas w ere mainly influenced by anthropogenic sources,w hile those of the rural area were influenced by long range transport of PCDD/Fs from urban sources.Principal component analysis(PCA)of 17 PCDD/F congener in soil samp le of four categories and ambient air samp les from three categories show s that the data points can be clustered into four typical groups,that is industrial soil,agricultural soil,industrial air and rural air.The score p lot reveals that PCDD/Fs in the industrial soil and rural air w ere mainly influenced by urban industrial sources,w hile those of the agricultural soil w ere influenced other sources such as agricultural chem icals.
[1] Seike Nobuyasu,Hasegawa Jun,Nishimo ri Mariko,et al.Distribution and Congenaric Patterns of PCDD/Fs in Environmental Components from Matsuyama,Japan[J].O rganohalogen Compounds,2001,5192-5195.
[2] Kiguchi Osamu,Kobayashi Takashi,Wada Yoshihisa,et al.Polychlorinated Dibenzo-p-dioxins and Dibenzofurans in Paddy Soils and River Sediments in Akita,Japan[J].Chemosphere,2007,67(3):557-573.
[3] Seike Nobuyasu,Kashiwagi Nobuhisa,Otani Takashi.PCDD/FContamination over Time in Japanese Paddy Soils[J].Environmental Science&Technology,2007,41(7):2210-2215.
[4] N IER.Monitoring of Persistent Endocrine Disrupting Compounds in Environment[R].Incheon:National Institute of Environmental Research,2006.
[5] Kim Dong Gi,M in Yoon Ki,Jeong Ju Yong,et al.Ambient Air Monito ring of PCDD/Fs and Co-PCBs in Gyeonggi-do,Korea[J].Chemosphere,2007,67(9):1722-1727.
[6] N IER.Surveying Resultsof Persistent O rganic Pollutants in POPs Monitoring Sites[R].National Institute of Environmental Research,Korea M inistry of Environment,2009.
[7] Shin Sun Kyoung,Jin Guang Zhu,Kim Woo Il,et al.Nationw ide Monito ring of A tmospheric PCDD/Fs and Dioxin-like PCBs in South Ko rea[J].Chemosphere,2011,83(10):1339-1344.
[8] M fE/Mo H.Health and Environmental Guidelines fo r Selected Timber Treatment Chemicals[S].New Zealand:Wellington,1997.
[9] BMU.Federal Soil Protection and Contaminated Sites Ordinance(BvodSchV)[S].Germany,1999.
[10] CCM E.Canadian Environmental Quality Guide
lines[S].Canada,2003.
[11] KM I.Expert Workshop for Estimation of Environmental Status in Environmental Protection Region.Gwangyang Bay[R].Korea Maritime Institute,2004.
[12] Kim Y S,Eun H,Cho H S,et al.The Characterization of PCDDs,PCDFs and Cop lanar PCBs during the Past 50 Years in Gwangyang Bay,South Ko rea[J].Journalof Hazardous Materials,2008,154(1-3):756-765.
[13] Korea.Agrochemicals Year Book[R].Ko rea Crop Protection Association,2008.
[14] Oh Jeong-Eun.Distributions and Fates of PCDD/Fs in Soil/air A round Emission Sources[D].Pohang University of Science and Technology.Schoolof Environmental Science and Engineering,2001.
[15] Im Sook Hyeon,Kannan Kurunthachalam,Giesy John P,et al.Concentrations and Profiles of Polychlo rinated Dibenzo-p-Dioxins and Dibenzofurans in Soils from Ko rea[J].Environmental Science&Technology,2002,36(17):3700.
[16] Oh Jeong-Eun,Lee Kyung-Tae,Lee Jae-W han,et al.The Evaluation of PCDD/Fs from Various Korean Incinerato rs[J].Chemosphere,1999,38(9):2097-2108.
[17] Yeo Hyun-Gu,Choi M inkyu,Chun Man-Young,et al.Concentration Characteristics of A tmospheric PCBs for U rban and Rural A rea,Ko rea[J].Sci Total Environ,2004,324(1/3):261-270.
[18] KMOE.Evaluation of the National POPs Contamination Status 2008[R].Korea M inistry of Environment,2010.
[19] Kim Kyoung Soo,Song Byung-Joo,Kim Jong-Guk,et al.A Study on Pollution Levels and Source of Polychlo rinated Biphenyl(PCB)in the Ambient Air of Ko rea and Japan[J].J KSEE,2005,27(2):170-176.
[20] Lee Se-Jin,Choi Sung-Deuk,Jin Guang-Zhu,et al.Assessmentof PCDD/F Risk After Imp lementation of Emission Reduction at a MSW I[J].Chemosphere,2007,68(5):856-863.
[21] Moon Hyo-Bang,Choi M inkyu,Choi Hee-Gu,et al.Historical Trendsof PCDDs,PCDFs,Dioxinlike PCBs and Nonylphenols in Dated Sediment Co res from a Semi-enclosed Bay in Ko rea:Tracking the Sources[J].Chemosphere,2009,75(5):565-571.
[22] Kim Kyoung-Soo,Shin Sun-Kyoung,Kim Kyoung-Sim,et al.National Monitoring of PCDD/DFs in Environmental M edia A round Incinerato rs in Ko rea[J].Environment International,2008,34(2):202-209.
[23] N IER.Surveying Results of Persistent Organic Pollutants in POPs Monito ring Sites[R].National Institute of Environmental Research,Korea M inistry of Environment,2010.
[24] Kim Meekyung,Choi Si Weon,Kim Dong-Gyu.Decreasing Concentrations of PCDD/Fs in Po rk Based on Ko rean Monitoring in Years 2002 and 2005[J].Food Additives and Contaminants,2008,25(10):1280-1284.
[25] Abad Esteban,Martínez Karell,Gustems Lluís,et al.Ten Years Measuring PCDDs/PCDFs in Ambient Air in Catalonia(Spain)[J].Chemosphere,2007,67(9):1709-1714.
[26] Sinkkonen Seija,Paasivirta Jaakko.Degradation Half-life Times of PCDDs,PCDFs and PCBs for Environmental Fate Modeling[J].Chemosphere,2000,40(9-11):943-949.
[27] Cleverly David H,Mo rrison Rayburn M,Riddle Brenda L,et al.Regulato ry Analysis of Pollutant Emissions,Including Polychlo rinated Dibenzo-pdioxins(CDDs)and Dibenzofurans(CDFs),from the Stacks of M unicipal Waste Combustors[J].Chemosphere,1989,18(1/6):1143-1153.
[28] Carballeira A lejo,Fernández J Ángelé,Aboal Jesús R,et al.Moss:A Powerful Tool fo r Dioxin Monitoring[J]. A tmospheric Environment,2006,40(30):5776-5786.
[29] Lee Wei-Shan,Chang-Chien,Guo-Ping,et al.Source Identification of PCDD/Fs fo r Various A tmospheric Environments in a Highly Industrialized City[J].Environmental Science&Technology,2004,38(19):4937-4944.
[30] Kim Byung-Hoon,Lee Se-Jin,M un Su-Jung,et al.A Case Study of Dioxin Monito ring in and A round an Industrial Waste Incinerator in Korea[J].Chemosphere,2005,58(11):1589-1599.
[31] M asunaga Shigeki,Takasuga Takumi,Nakanishi Junko.Dioxin and Dioxin-like PCB Impurities in Some Japanese Agrochemical Formulations[J].Chemosphere,2001,44(4):873-885.
1004-4353(2011)02-0160-05
韩国土壤中二恶英浓度的时间变化趋势和污染源识别
金光洙1, 全红梅2
(1.韩国国立环境科学院环境健康部化学物质研究科,韩国仁川404708;2.延边大学理学院化学系,吉林延吉133002)
综述了近十年来韩国土壤中二恶英浓度随时间的变化趋势,并分析了不同土壤中潜在的二恶英排放源.研究显示:采样地点和时间不同,土壤中二恶英的浓度不同;但是1999—2009年,土壤中二恶英的浓度未呈现明显的减少趋势;由于二恶英其半衰期较长(17~274年)在土壤中分解缓慢,通过对土壤和大气中17种二恶英异构体的主成分分析表明,工业区土壤和农村地区大气中的二恶英主要来源于城市工业源,而农业区土壤中的二恶英主要来源于农业用化学物质等.
土壤;二恶英;时间趋势;异构体组成;污染源
2011-05-14
金光洙(1973—),男,博士后研究员,研究方向为环境分析.
X503.1
A