Perpendicular Drought Index and its Application in Hubei Zhanghe Irrigation System
2010-09-05LIZheTANDebaoQINQiingZHANGSuiSpatialInformationTechnologyApplicationInstituteYangtzeRiverScientificResearchInstituteWuhan43000ChinaSchoolofEarthandSpaceSciencePekingUniversityBeijing0087China
LIZhe,TAN De-bao,QIN Qi-m ing,ZHANG Sui(.Spatial Information Technology Application Institute,Yangtze River Scientific Research Institute,Wuhan 43000,China;.School of Earth and Space Science,Peking University,Beijing 0087,China)
Perpendicular Drought Index and its Application in Hubei Zhanghe Irrigation System
LIZhe1,TAN De-bao1,QIN Qi-m ing2,ZHANG Sui1
(1.Spatial Information Technology Application Institute,Yangtze River Scientific Research Institute,Wuhan 430010,China;2.School of Earth and Space Science,Peking University,Beijing 100871,China)
Remote sensing droughtmonitoring model is an important research realm in irrigation and water conservation.From a supposition that the spectral characteristic of bare soilmeets linear distribution(Zhan,2005;Abuduwasit,2004)in the NIR(Near Infrared)-Red reflectance spectral in feature space,a simple and effective remote sensing model has been used tomonitor droughtwhich was validated in Ningxia Hui-nation Autonomous region and achieved better results.In order to verify feasibility of PDI(perpendicular drought index)under the dense vegetation cover condition,Hubei Zhanghe Irriga-tion System was selected as the research area.PDIwas calculated with ETM+data,and 2-5 cm soilmoisture observa-tion resultwas used in comparison with PDI.Result shows that2-5 cm in-situ observation and PDIcalculation display ba-sically the same trend and they are consistentwith the fieldmeasured drought indices.To sum up,PDIcan reflect the land cover and water-heat combination.PDI has many advantages such as simplicity,practicality,easy-to-useage,versatility and universality.And it is suitable tomonitor regional drought under complex underlying surface conditions.
NIR-Red Spectral Space;Perpendicular Drought Index;Hubei Zhanghe Irrigation System
1 INTRODUCTION
Regional drought brought by global climate chan-ges ismenacing directly human’s food supply and sur-vival environment,and it becomes a hot issue ofmany scientists and government administrations.Remote sensing hasmany advantages such as large cover,high spatial resolution,short interval,and convenient data acquisition,whichmakes remote sensing droughtmoni-toring become an important research realm.Drought index is a comprehensive descriptor of surface drought and wet condition(Narasimhan&Srinivasan,2005).Owing to different physical and radiant characters of soil,remote sensing droughtmonitoring model can be divided to three categories:Visible-NIR model,ther-malmodel and microwave model.Considering soil re-flectivity depressing with the increase of soilmoisture,Visible-NIRmodel calculates indirectly through vegeta- tion index and water stress index,such as AVI and spectrum space methods.But because of different soil structures,exterior shapes and organic mechanisms,the precision of Visible-NIR model tomonitor drought is strictly restricted.Thermal model calculates soil moisture through soil surface emissivity and land sur-face temperature on the basis of soil water balance e-quation and energy balance equation,such as thermal inertiamodel,vegetation evaporation model and water depression index.Watson et al.(1971)brought out a simple thermal inertia equation with land surface tem-perature.Price(1977;1985),Kahle(1977),England(1990),Zhang(1997),Tian(1991)also developed many application experiments.Thermal inertia model is sensitive to bare soil or rare vegetation condition,but not very effective to dense vegetation condition.Because soil moisture affects vegetation evaporation greatly,it is effective to use the ratio of apparent evap-oration to latent evaporation to describe soil moistureunder dense vegetation condition.Jackson(1981)brought out Crop Water Stress Index(CWSI).Tian(1991)found the relationship between soil moisture and CWSIusing land surface temperature,water evap-oration and meteorology data.CWSIhas clear physical meaning,but it requires ground observation data and meteorology data,which decreases its calculation pre-cision.Microwave model relies on the relationship a-mong soil permittivity,emissivity and soil moisture.Microwave remote sensing can observe earth surface all day and all night,but it cost too much,and not very sensitive to soilmoisture under dense vegetation condi-tion.So there raises a question whether we can carry out a new droughtmonitoringmethod which is success-ful under complex underlying surface condition.
Land surface temperature(LST),vegetation index(VI)and albedo are key factors to monitor soilmois-ture,and their comprehensive application can exactly reflect surface drought and water condition.Goward and Hope(1989)found out that LST-NDVI spectral space showed a triangle distribution.Price(1990)be-lieved LST-NDVI spectral space displayed a trapezium distribution,then used a mathematical formulation to describe it,and applied it to analyse land surface va-porization.Zhan(2005),Abuduwasit(2004)found out that NIR-Red channel of ETM+images formed a spectral space which was similar to NDVI-LST spectral space,so perpendicular drought index(PDI)was brought out based on NIR-Red spectral space and in-situ soilmoisture observation from Ningxia Hui-nation Autonomous Region which was successfully used to val-idate PDImodel.Ningxia Hui-nation Autonomous re-gion is located in North China,which has lower vegeta-tion coverage.Can PDIalso be successful under com-plex underlying surface condition?Motivated by this question,the authors carry out deep research.
2 METHODOLOGY
2.1 6S Atmospheric Correction
In order to reduce atmosphere interference and improve retrieval precision of biophysical parameter,atmospheric correction to remote sensing image is re-quired.Commonly atmospheric correction models in-clude 6S(second simulation of satellite signal in the so- lar spectrum),MODTARN(moderate resolution trans-mission),LOWTRAN(low resolution transmission),ATCOR(a spatially-adaptive fast atmospheric correc-tion).6S atmospheric correction model is used in this paper.
The gray number of remote sensing image is con-verted to image brightnesswhich has physicalmeaning(Chander and Markham,2003).Its formulation is

Where:θs,s,θvandvrepresent incident zenith,in-cident azimuth,observation zenith and observation azi-muth respectively,ρTOA(θs,θv,v)is apparent reflectiv-ity(also called top atmospheric spectral reflectivity)which is obtained after radiation correction;d denotes sun-earth chronometer unit distance;Eλrepresents aver-age top atmospheric radiance in channelλ(unit in W· m-2·μm-1);θsindicates sun zenith.
Considering atmospheric aerosol multi-scatter effect and vapor absorb influence and neighborhood phenomenon of anisotropic earth surface,the relation-ship between surface reflectivity and apparent reflectiv-ity may be expressed as follows(Vermote,et al.,1997):
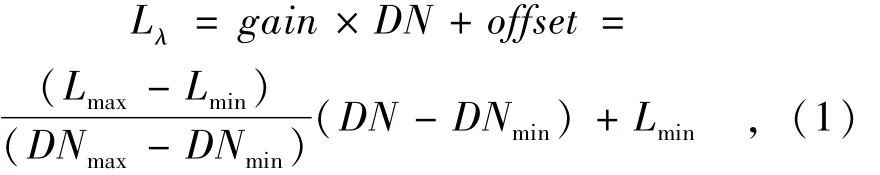
Where:Lλrepresents radiation brightness of each channel(unit in W·m-2·μm-1·sr-1),and offset and gain are regression parameters brought by image header(unit in W·m-2·μm-1·sr-1),DN is cor-rected gray number,DNmaxand DNminare maximum and minimum gray number respectively,Lmaxand Lminare corresponding radiation brightness ofmaximum and minimum gray numbers(unit in W·m-2·μm-1· sr-1).
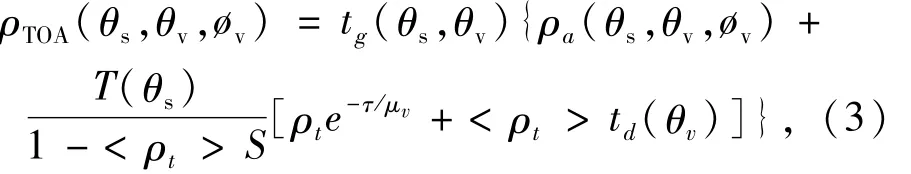
Top atmospheric reflectivity may be expressed as follows:
Where:ρTOA(θs,θv,v)is apparent reflectivity,tg(θs,θv)represents atmospheric aerosol multi-scatter and vapor-absorption factors;ρa(θs,θv,v)shows length radiation which is carried outby Rayleigh scatterand aerosol scatter;θv,vrepresent observation zenith and observation azimuth respectively;T(θs)expresses total transmission of down radiation;<ρt>is environ-ment neighborhood effect to surface pixel reflectivity ρt,e-τ/μvand td(θv)represent emissivity of direct ra-diation and up radiation respectively,S is spherical al-bedo.
2.2 NIR-Red Spectral Space
This paper uses the Red channel(band 3:630-690 nm)and NIR channel(band 4:775-900 nm)reflectivities of ETM+images to construct NIR-Red spectral space.After atmospheric correction,Red channel and NIR channel reflectivities of ETM+are used to construct a triangle scattermap,which is simi-lar to NDVI-LST spectral space.This triangle scatter map can not only express vegetation coverage,but also describe surface drought.
Richardson and Wiegand(1977)built NIR-Red spectral spacewith MSSgray values of red channel and NIR channel,then used vertical distance between each point and soil line to describe vegetation coverage,so perpendicular vegetation index(PVI)was formed.Fig.1 shows the relationship between NIR-Red spectral space and vegetation coverage.Line A-E-D indicates the vegetation coverage changes from all cover(A),to partial cover(E),to bare soil(D).Fig.1 also shows the relationship between NIR-Red spectral space and soilmoisture.Line B-D-C shows that soil wet changes from fullwet(B),to partialwet(D),to dry(C).Line B-D-C is vertical to PVI,and parallel to soil line.To sum up,surface spectral feature has close relationship with land cover and soilmoisture,and it can be used to indicate regional drought.NIR-Red spectral space uses NIR and red channel reflectivity to monitor drought,which is effective and easy to perform.
2.3 Remote Sensing Drought M odeling Based on NIR-Red Spectral Space
NIR-Red spectral space constructed by ETM+re-mote sensing images displays a triangle shape.B-C is soil line,and soil moisture decreases from B to C.Mathematical formulation of B-C soil line can be ex-pressed as follows:

Where:Rnirrepresents NIR channel reflectivity;Rredindicates Red channel reflectivity;M and I represent coefficients respectively.
In Fig.2,line L which is vertical to B-C soil line passes coordinate origin,and it can be expressed as follows:
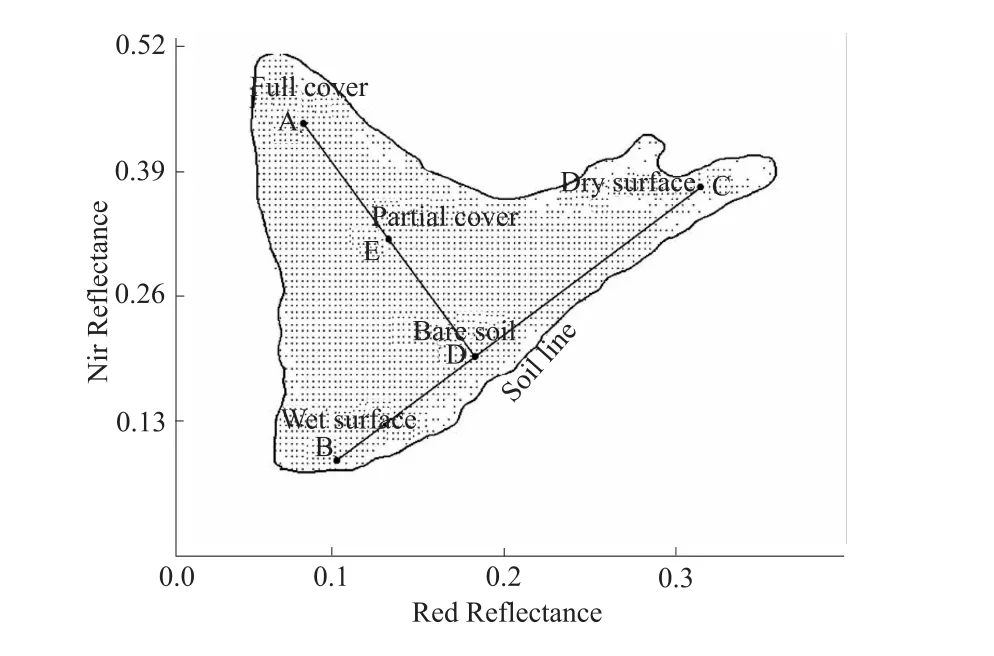
Fig.1 NIR-Red Spectral Space

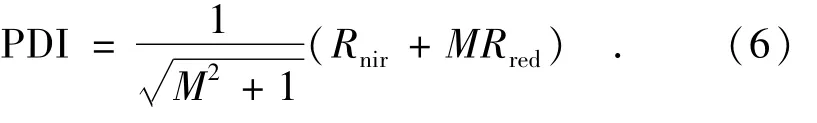
In NIR-Red spectral space,the vertical distance from each point to Line L describes surface drought.Soil moisture increases with the vertical distance de-creases,and vice versa.To a blackbody,its vertical distance is zero,which means it is located at coordi-nate origin.Other non-blackbody displays higher wet-ness when approaching coordinate origin.In general,space near line L represents water or wet object,and space far from line L is drought area.So the vertical distance EF from each point to Line L in NIR-Red spectral space can be used to describe regional soil moisture,so a remote sensing droughtmonitoringmod-el based on NIR-Red spectral space can be given by the following formula:
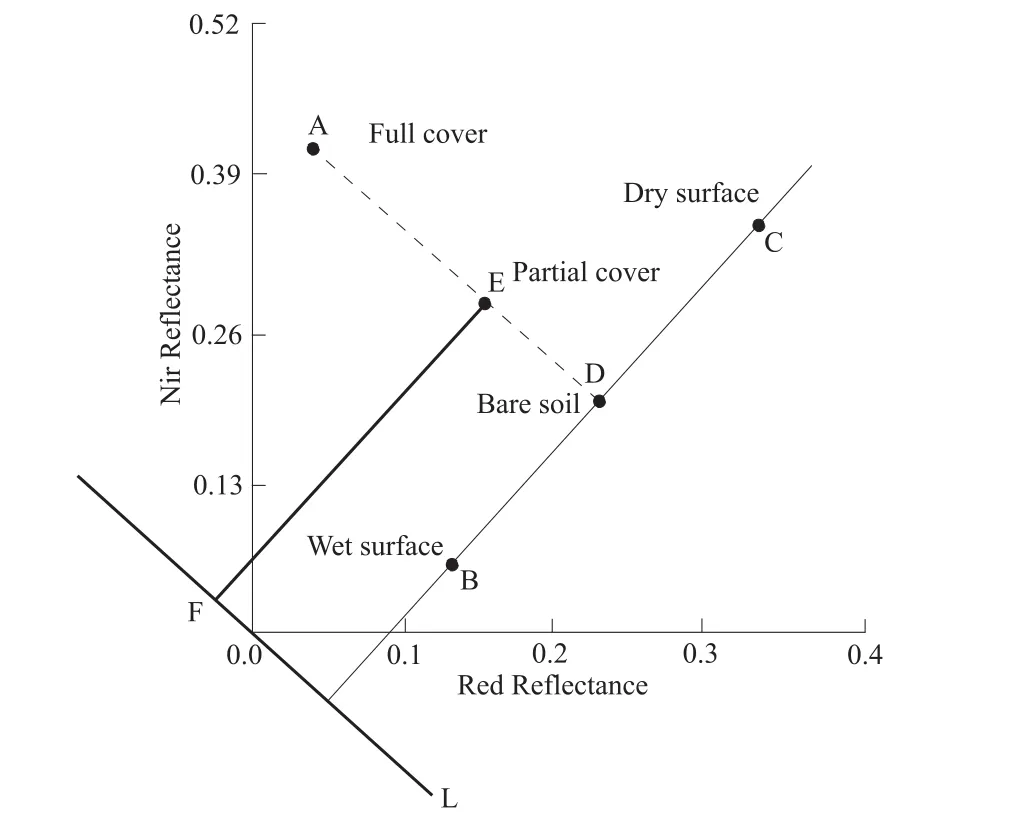
Fig.2 Princip le of Perpendicular Drought Index
3 MODEL APPLICATION
3.1 Research Area
Zhanghe Irrigation System is located at the center of Hubei Province,China.Its latitude ranges from 30° 00′to 31°42′N,and its longitude ranges from 111°28′to 111°53′E.It tilts from high northwest towards low southeast.From north to south,it is about 115 km,and from east to west,it is about60 km.Its total area is approximately 5 543.93 square kilometers.The re-gion is clay and loam soils,staggered in the framework of the whole area,in which the distribution of clay is about 57%of the total area,loam about 43%.The entire irrigated area is divided into two parts,hills and plains.The hilly area is about 4 658.64 square kilo-meters,accounting for84%of the total area,the plain area is about855.29 square kilometers,accounting for 16%of the total area.The total area of cultivated land is 244.75million acres,ofwhich 219.69million acres are paddy field,25.06million acres are dry land.The main crop is rice,it is an important grain-producing base in Hubei Province.
Zhanghe Irrigation System is a sub-tropical conti-nental climate zone,climate moderation,abundant rainfall,long frost-free period for agricultural produc-tion.Its annual average temperature is15.6-16.1℃.The annual frost-free period is 246-270 days.It has abundant rainfall,which changes in large,uneven dis-tribution of every year.Multi-year average precipitation is 968.5 mm.Rainfall mainly concentrate from April to October,accounting for 81.7 percent of the whole year,inter-annual difference is up to 2.2 times.The distribution of rainfall in the region is unbalance as South is bigger than North,and West is bigger than East.
3.2 Field Observation
From September to October in 2006,the research-ers from Yangtze River Scientific Research Institute(YRSRI),Wuhan University(WHU)and Chinese U-niversity of Hong Kong(CUHK)conducted a integrat-ed satellite-land simultaneous experiment,collected spectral characteristic curves of vegetation,water bodies,bare soil,and ordered many ETM+multi-spectral remote sensing images which were acquired during the same period.In the third channel of Zhang-he Irrigation System four simultaneous observations were deployed,of which four positioning observation points were selected.There are central observation(C1-C4),northwestobservation(NW1-NW4),north-east observation(NE1-NE4)and southeast observa-tion(SE1-SE4).Each observation point deployed 4 samples occupying 400 square meters.Every sample contains soil content from 2 to 5cm depth.Soilmois-ture was calculated using CNC-503DR neutron mois-turemeter.After calibration,the weight of aluminum box was converted to the weight of water content,which means unit soil weight divided by the water it contained.
This paper uses in-situ observation data of 2-5 cm depth at NW1,NW2,NW3 and NW4 on Septem-ber 29,2006,which is simultaneous with satellite transit.
3.3 Result and Analysis
According to bare land spectral reflectivity infor-mation extracted by soil line(Fig.3),and its equa-tion can be expressed as follows:

We extract M=1.332 4 and I=-0.120 5 from above equation,PDI can be expressed as follows:
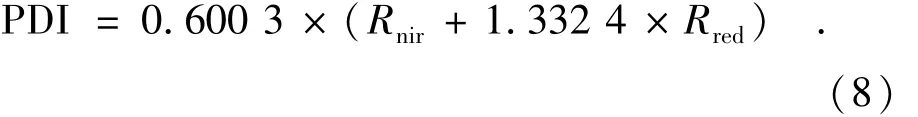
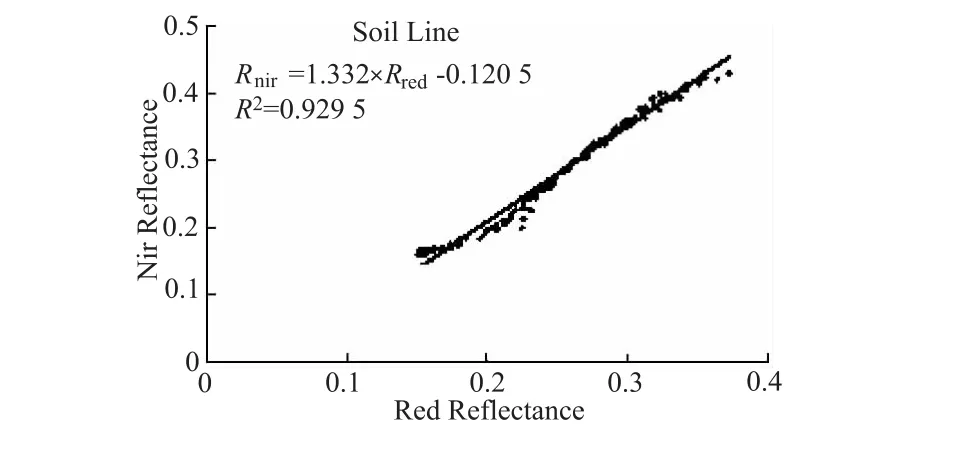
Fig.3 Soil line extraction and determ ining of slope parameters
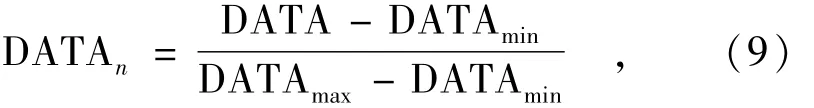
ETM+data has a higher resolution,so the coordi-nates of observation points can be found on geometri-cally corrected ETM images.For purposes of compari-son,formula(10)is used to normalize remote sensing drought indices and measured soilmoisture.Where:DATAnrepresents normalized value,DATA is original value,DATAmaxand DATAminare themaximum and minimum values of all sample respectively.
As it shows in Fig.4,2-5 cm in-situ field ob-servations and PDI calculations displays basically the same trend and have a coefficient of 0.76.In PDI,thismodel is a comprehensive descriptor of both soil and vegetation,not eradicating vegetation interference.Also,CNC-503DR neutron moisturemeter is easily af-fected by surface wind,climate and human activities,so its relationship is not so good.
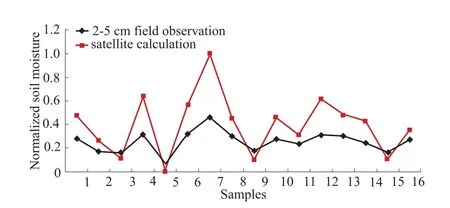
Fig.4 Comparison of PDI calculation and in-situ observation
The rate of crop and soil absorption field capacity,wilting crop coefficient and effective soilmoisture con-tent are closely related to regional drought conditions.In remote sensing droughtmonitoring,a comprehensive drought index combined soil moisture and water bal-ance displays a more comprehensive reflection of drought situation.In-situ measuring drought indicator is picked up to validate PDI.Itsmathematical formula-tion is
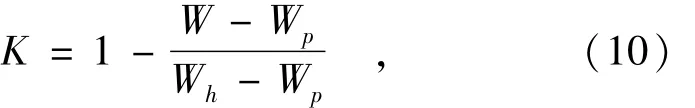
Where:K is drought index,W iswatermoisture(%),Whis the upper limit that soil can maintain,which is also called field capacity(%),Wpis soil wilting coef-ficient(%).
Fig.5 shows that PDI is consistent with field measured drought indexes.
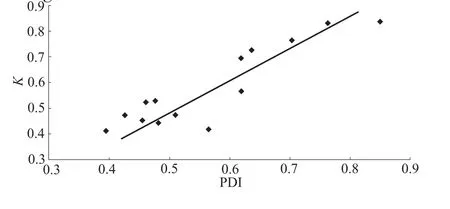
Fig.5 Relationship between PDI and in-situ measured drought indicator K
4 CONCLUSION
Perpendicular drought index may reflect the land cover,water-heat combination and changeswith amore specific biophysicalmeaning.It hasmany advantages such as simplicity,practicality,easy-to-use,versatility and universality.In practice,only NIR-Red reflec-tance spectra space can be effectively carried out on droughtmonitoring in middle and lower Yangtze River Basin.
However,there are still two problems to need fur-ther research.Firstly,although 2-5 cm in-situ obser-vation and PDI calculation display basically the same trend and have a coefficientof0.76,the relationship is not so good,maybe the reason lies in that PDI is a comprehensive descriptor of both soil and vegetation,and doesn’t eradicate vegetation interference.Second-ly,PDI is based on the mathematical expression of a fixed soil line,and this is only an ideal assumption.In fact,the shape of soil line has close relationship with soil types and fertilization conditions.Strictly speak-ing,soil line is notnecessarily to be a line,whichmay lead to errors.Future work should focus on effectively separating vegetation and soil information from NIR-Red feature space and improvingmathematical expres-sion equation.
REFERENCES:
[1] WASTON K,ROWEN LC,OFFIELD TW.Application of thermalmodeling in geologic interpretation of IR images[J].Remote Sensing Environment,1971,3:2017-2041.
[2] PRICE JC.On the analysis of thermal infrared imagery:the limited utility of apparent thermal inertia[J].Re-mote Sensing of Environment,1985,18:59-93.
[3] KAHLE A B.A simple thermalmodel of the earth’s sur-face for geologicmapping by remote sensing[J].Journal of Geophysical Research,1977,82:1673-1680.
[4] ENGLAND A W.Radiobrightness of diurnally heated freezing soil[J].IEEE Transactions on Geoscience and Remote Sensing,1990,28(3):464-476.
[5] ENGLAND AW,GALANTOWICZ JF,SCHRETTER M S.The radio brightness thermal inertia measure of soil moisture[J].IEEE Transactions on Geoscience and Re-mote Sensing,1992,30(1):132-139.
[6] ZHANG Ren-hua.Thermal inertiamodel and its applica-tion[J].Chinese Science Bulletin,1991,(12):924-927.
[7] TIAN Guo-liang.Remote sensing monitoring for soil moisture[J].Remote Sensing of Environment,1991,6(2):89-99.
[8] JACKSON R D,IDSO SB.Canopy temperature as a crop water stress indicator[J].Water Resources Research,1981,17:133-138.
[9] WIGNERON JP,CALVET JC,PELLARIN T,et al.Retrieving near-surface soil moisture from microwave ra-diometric observations:Current status and future plans[J].Remote Sensing of Environment,2003,85:489-506.
[10]HUISMAN JA,HUBBARD SS,REDMAN JD,et al.Measuring soil water content with ground penetrating ra-dar:A review[J].Vadose Zone Journal,2003,2:476-491.
[11]CASHION J,LAKSHMNIV,BOSCH D,et al.Micro-wave remote sensing of soil moisture:Evaluation of the TRMM microwave imager(TMI)satellite for little river watershed tifton,georgia[J].Journal of Hydrology,2005,37:242-253.
[12]WANG C,QIJ,MORAN S,etal.Soilmoisture estima-tion in a semiarid rangeland using ERS-2 and TM imagery[J].Remote Sensing of Environment,2004,90:178-189.
[13]GOWARD SN,HOPE A S.Evaporation from combined reflected solar and emitted terrestrial radiation:Prelimina-ry FIFE results from AVHRR data[J].Advances in Space Research,1989,9:239-249.
[14]PRICE JC.Using spatial context in satellite data to infer regional scale evapotranspiration[J].IEEE Transactions on Geoscience and Remote Sensing,1990,28:940-948.
[15]RIDD L.Exploring a V-I-S(vegetation-impervious sur-face-soil)model for urban ecosystem analysis through re-mote sensing:Comparative anatomy for citied[J].Inter-national Journal of Remote Sensing,1995,16:2165-2185.
[16]GILLESS.A verification of the trianglemethod for obtai-ning surface soil water content and energy fluxes from re-motemeasurements of the normalized difference vegetation index(NDVI)and surface radiant temperature[J].In-ternational Journal of Remote Sensing,1997,18(5):3145-3166.
[17]HAN Li-juan,WANG Peng-xin,WANG Jin-di,et al.Research on VI-LST spectral space[J].Science in China Series D,2005,35(4):371-377.
[18]GHULAM A,QIN Q,WANG L,et al.Development of broadband albedo based ecological safetymonitoring index[C]∥2004 IEEE International Geoscience and Remote Sensing Symposium(IGARSS),Anchorage,Alaska,Egan Convention Center,USA,September 20-24,2004:4115-4118.
[19]ZHAO Wen-jing,Massayuki Tamura,Hidenori Taka-hashi.Atmospheric and spectral corrections for estimating surface albedo from satellite data using 6S code[J].Re-mote Sensing of Environment,2000,76:202-212.
[20]RICHARDSON A J,WIEGAND C L.Distinguishing veg-etation from soil background information[J].Photogram-metric Engineering and Remote Sensing,1977,43(12):1541-1552.
(Edited by LIU Yun-fei,YIXin-hua)
垂直干旱指数在湖北漳河灌区遥感旱情监测中的应用
李 ?1,谭德宝1,秦其明2,张 穗1
(1.长江科学院空间信息技术应用研究所,武汉 430010;2.北京大学地球与空间科学学院,北京 100871)
遥感技术具有覆盖范围广、空间分辨率高、重访周期短、数据获取快捷方便等优点,遥感干旱监测已经成为干旱监测的重要研究方向之一。詹志明(2005)、阿布(2004)等假设裸露土壤的光谱特征满足线性分布,在NIR-Red光谱特征空间中提出了垂直干旱指数(PDI),并在我国西北干旱区-宁夏固原地区进行了模型验证。为了进一步验证PDI在茂密植被覆盖条件下的可行性,选择长江中下游流域的典型灌区湖北漳河灌区作为研究区域,采用ETM+数据计算PDI,与2~5 cm平均土壤水分相比较,结果表明:模型观测值变化曲线和实测土壤水分变化趋势保持一致,2~5 cm平均土壤水分相关系数为0.76,与实测干旱指标基本吻合。PDI模型能够有效地反映地表覆盖和水热组合,简单实用,具有通用性和普适性,适宜于复杂下垫面条件下的遥感旱情监测。
NIR-Red光谱特征空间;垂直干旱指数;湖北漳河灌区
P237;TP79 Document code:A
1001-5485(2010)01-0067-06
date:2009-07-02;Revised date:2009-11-10
Funds of Agriculture Scientific and Technological Achievements Transformation(05EFN2l6800404);Special Funds of Yangtze River Scientific Research Institute(YJJ0910/KJ02)
LIZhe(1980-),male,engineer,Ph.D.,graduated from Department of Earth and Space Sciences,Peking University,Chi-na,in 2009.Hismain research activities cover regional eco-environmentmonitoring and evaluation,flood and drought disas-termonitoringmodels,digital watershed.(Tel.)027-82926550(E-mail)lizhe@mail.crsri.cn