One-dimensional Dynamic Modeling and Simulation of a Planar Direct Internal Reforming Solid Oxide Fuel Cell*
2009-05-12KANGYingwei康英伟LIJun李俊CAOGuangyi曹广益TUHengyong屠恒勇LIJian李箭andYANGJie杨杰
KANG Yingwei (康英伟), LI Jun (李俊), CAO Guangyi (曹广益), TU Hengyong (屠恒勇), LI Jian (李箭) and YANG Jie (杨杰)
One-dimensional Dynamic Modeling and Simulation of a Planar Direct Internal Reforming Solid Oxide Fuel Cell*
KANG Yingwei (康英伟)1,**, LI Jun (李俊)1, CAO Guangyi (曹广益)1, TU Hengyong (屠恒勇)1, LI Jian (李箭)2and YANG Jie (杨杰)2
1Institute of Fuel Cell, Shanghai Jiao Tong University, Shanghai 200240, China2School of Materials Science and Engineering, Huazhong University of Science and Technology, Wuhan 430074, China
This article aims to investigate the transient behavior of a planar direct internal reforming solid oxide fuel cell (DIR-SOFC) comprehensively. A one-dimensional dynamic model of a planar DIR-SOFC is first developed based on mass and energy balances, and electrochemical principles. Further, a solution strategy is presented to solve the model, and the International Energy Agency (IEA) benchmark test is used to validate the model. Then, through model-based simulations, the steady-state performance of a co-flow planar DIR-SOFC under specified initial operating conditions and its dynamic response to introduced operating parameter disturbances are studied. The dynamic responses of important SOFC variables, such as cell temperature, current density, and cell voltage are all investigated when the SOFC is subjected to the step-changes in various operating parameters including both the load current and the inlet fuel and air flow rates. The results indicate that the rapid dynamics of the current density and the cell voltage are mainly influenced by the gas composition, particularly the H2molar fraction in anode gas channels, while their slow dynamics are both dominated by the SOLID (including the PEN and interconnects) temperature. As the load current increases, the SOLID temperature and the maximum SOLID temperature gradient both increase, and thereby, the cell breakdown is apt to occur because of excessive thermal stresses. Changing the inlet fuel flow rate might lead to the change in the anode gas composition and the consequent change in the current density distribution and cell voltage. The inlet air flow rate has a great impact on the cell temperature distribution along the cell, and thus, is a suitable manipulated variable to control the cell temperature.
solid oxide fuel cell, direct internal reforming, planar, dynamic model, simulation
1 INTRODUCTION
The solid oxide fuel cell (SOFC) is attracting more and more interests as a clean and highly efficient device for power generation [1]. Since it uses an oxide ceramic material as the electrolyte, high operating temperature (typically 600-1000°C) is required to achieve sufficient ionic conductivity. The high temperature makes it possible that the fuel reforming, when a hydrocarbon is used as the fuel, is carried out directly within the anode channels, giving rise to a direct internal reforming SOFC (DIR-SOFC) [1]. The direct internal reforming eliminates the need for a separate fuel reformer, and can lead to a more compact and efficient system design. In addition, the high operating temperature also produces high quality waste heat, which can be recycled by heat recovery devices or gas turbines to make combined heat and power (CHP) or hybrid systems with very high overall efficiency.
As an SOFC system in operation is normally subjected to frequent load changes, it’s crucial to investigate the dynamic behavior of an SOFC caused by variable load or other operating parameters. Dynamic modeling is a valid tool for predicting the dynamic behavior of the SOFC. Through model-based dynamic simulations, some dynamic features of the SOFC can be revealed and control strategies can furthermore be developed. Up to now, a number of SOFC models can be found in the published works. Although most of them describe SOFC steady-state performance [2-5], dynamic issues have also been addressed by several authors. Hall and Colclaser [6], and Xue. [7] developed one-dimensional dynamic models to analyze the transient behavior of tubular SOFCs. However, the internal reforming effect was not included in their models. Achenbach. [8, 9] presented a three- dimensional dynamic model for a planar SOFC with inclusion of the internal reforming effect and examined the transient cell voltage response to load changes as well as the influence of several design parameters on the transient performance. However, the transient current density response of the SOFC is not yet well known. Aguiar. [10, 11] proposed a one-dimensional dynamic model for a planar DIR-SOFC, by which the steady and dynamic performance of the SOFC was investigated. However, in their model, some gas properties, such as gas densities, heat capacities and velocities, were taken as constant values. Moreover, besides the response to load changes, none of the above authors considers the transient behavior caused by changes in other operating parameters (.., the inlet fuel and air flow rates), which can give insight into the effects of these operating parameters and benefit developing appropriate control strategies.
The main objective of this article is to investigate the transient behavior of a planar DIR-SOFC more comprehensively. In this article, the dynamic responses of important SOFC variables, such as cell temperature, current density, and cell voltage, will all be considered when the SOFC is subjected to the changes in various operating parameters including both the load and the inlet fuel and air flow rates. The authors, here, try to provide a clear picture of these variables as functions of position and time. For this purpose, a one-dimensional dynamic model of a planar DIR-SOFC is first developed based on mass and energy balances, and electrochemical principles. Furthermore, a solution strategy is presented and a MATLAB code is designed to solve the model. Next, the International Energy Agency (IEA) benchmark test [12] is used to validate the present model. Then, through model-based simulations, the steady-state performance of a co-flow planar DIR-SOFC under specified initial operating conditions, and its dynamic response to introduced operating parameter disturbances are investigated in detail.
2 MODEL DEVELOPMENT
Figure 1 shows the schematic diagram of a unit planar DIR-SOFC. Its core component is a tri-layer structure (often referred to as the PEN) consisting of two porous electrodes, anode and cathode, separated by a dense ion-conducting electrolyte. Two interconnect plates with machined gas channels are placed above and below the PEN to form a unit cell. To compose an SOFC stack, repeating unit cells need to be further connected in series. The methane mixed with water steam (or their product after pre-reforming of some degree) is usually used as fuel at the anode side, and air is used as an oxidant at the cathode side. Because of the high temperature in anode channels, the methane is reformed to H2, CO, and CO2directly on the anode mainly through two reactions,.., the methane steam reforming and the water-gas shift (WGS). The H2, which is produced, is then electrochemically oxidized by oxygen ions that migrate through the electrolyte from the cathode side, producing water and heat, and releasing electrons. The released electrons drive the external load to perform electrical work and return to the cathode, where they electrochemically reduce the O2to oxygen ions. All the reactions taken into account in the present model are listed in Table 1. Although the electrochemical oxidation of CO also occurs on the anode, it is neglected, here, because its speed is 2-5 times slower than that of H2oxidation [12, 13].
For model development, several assumptions are made as follows:
(1) Each unit cell in the SOFC stack operates identically, and there is no heat transfer between adjacent unit cells. Therefore, a unit cell can be investigated to represent the full stack performance.
(2) The SOFC is treated as a one-dimensional plant along the gas flow direction. Therefore, this model allows for the co-flow and counter-flow rather than cross-flow configuration although the equations presented next are for the co-flow case. Correspondingly, a one-dimensional coordinate system is built with its coordinate origin located at the anode channel inlet and the forward direction of-axis along the fuel flow direction (see also Fig. 1).

(4) All gases are assumed to be ideal gas.
(5) The pressure in the gas channels is assumed to be constant.
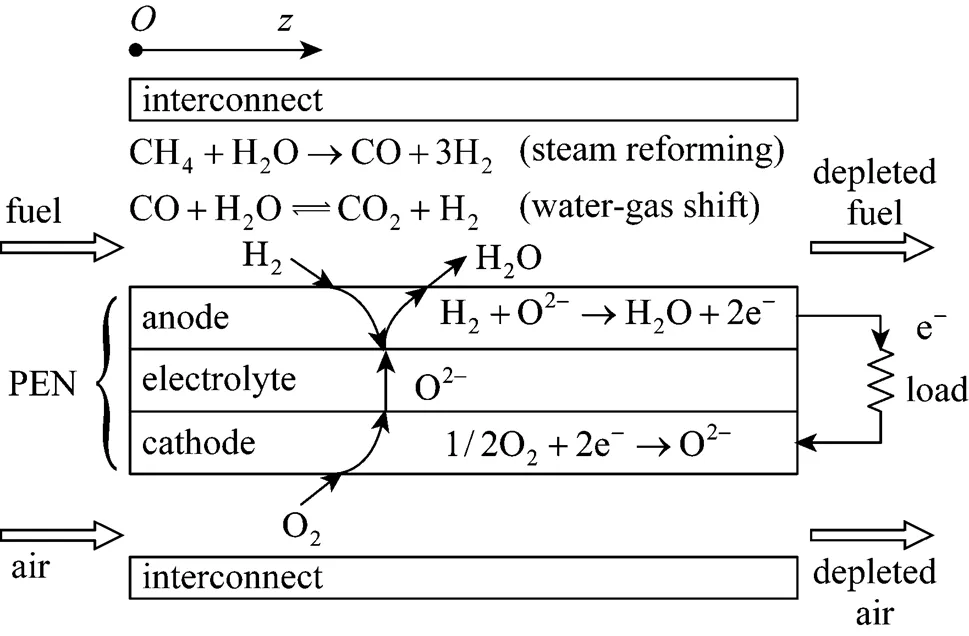
Figure 1 Schematic diagram of a unit planar DIR-SOFC

Table 1 Reactions considered in the model
2.1 Mass balances
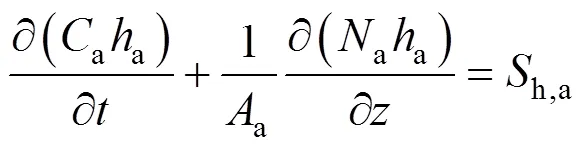
According to the reactions listed in Table 1, there are five gas species in the anode channels,.., CH4, H2O, H2, CO, and CO2, and two gas species in the cathode channels,.., O2and N2. By applying the molar balance to speciesin the anode channels, the following equation is obtained:
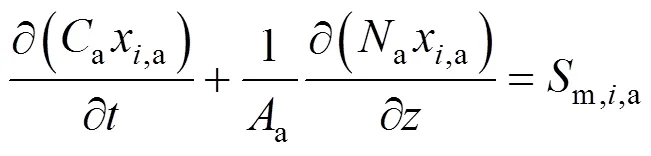

whereais the total molar concentration of anode gases,x,athe molar fraction of speciesin the anode gas stream,athe total sectional area of anode channels,athe molar flow rate of the anode gas stream, andm,i,athe mass source term of speciesin anode channels.
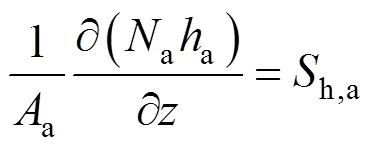
For the gases in the anode channels, the following total molar balance equation can also be built:
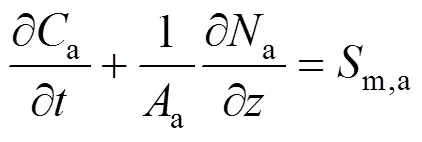
wherem,ais the total mass source term of the gases in the anode channels.
Insertion of Eq. (2) into Eq. (1) yields the following molar fraction dynamic equation of speciesin the anode channels:
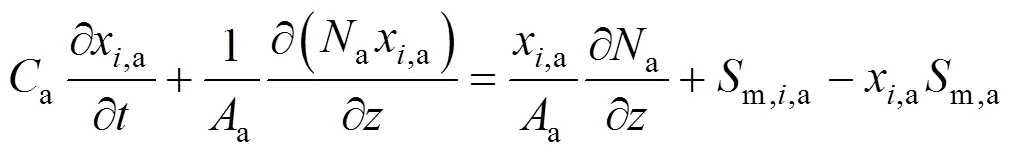
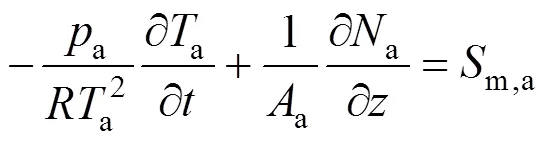
whereais the pressure in the anode channels,ais the temperature of anode gas phase, andis the universal gas constant.
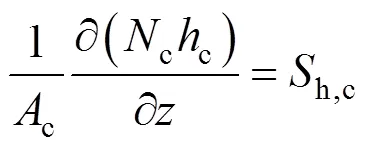
Similarly, the molar fraction dynamic equation and temperature dynamic equation for cathode gases can also be derived as follows:

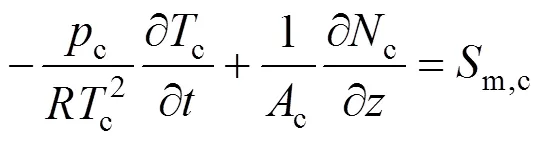


and

The reaction rate of the steam reforming is calculated by the following equation [8, 10, 14]:

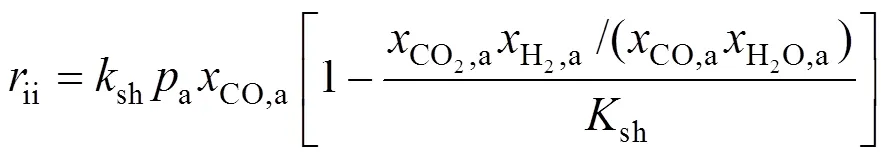
The WGS reaction is usually considered a very fast one and is assumed to be at its equilibrium. The formula proposed by Aguiar. [10] is used here to account for this effect:
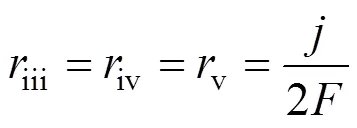
According to the charge conservation, the reactions (iii)-(v) have the same reaction rate, which is related to the local current densityand can be calculated by Faraday’s law:
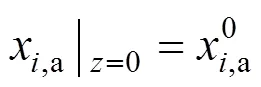
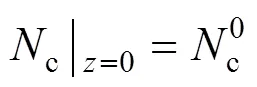
The boundary conditions of Eqs. (3)-(6) are specified by the inlet gas conditions. For the co-flow configuration, they can be written as follows:
2.2 Energy balances
According to Assumption (3), the energy balance is applied to the gas phase in the anode and cathode channels, and the SOLID, respectively. The energy balance for the anode gas phase can be written as:
whereais the molar specific enthalpy of the anode gas mixture, andh,ais the heat source term for the anode gas phase. Ifais roughly considered to be a linear function of temperature, the first term on the left hand side of Eq. (14), which represents the energy accumulation in the gas phase, becomes zero by inserting the ideal gas law into it and applying the constant pressure assumption. Therefore, this term can be neglected and the following ordinary differential equation is obtained:
Similarly, for the cathode gas phase, we can obtain:
The energy balance equation for the SOLID can be written as:

wheres,c,s,s,s, andh,sdenote the density, mass specific heat capacity, temperature, thermal conductivity, and heat source term of the SOLID, respectively. As there is no macroscopic flow for the SOLID, the diffusion term rather than the convection term is included in this equation.
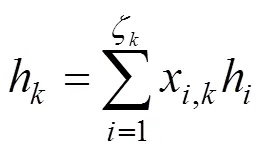
The heat source termsh,a,h,c, andh,sare given by:


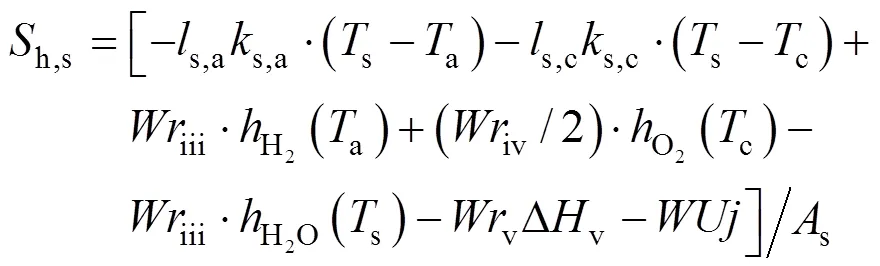
wheres,a(s,c) denotes the total sectional perimeter of the anode (cathode) channels,s,a(s,c) is the convective heat transfer coefficient between the anode (cathode) channels and the SOLID,h() is the specific enthalpy of gas speciesat the temperature of, ΔHis the enthalpy change of reactionat the temperature of 298.15 K,is the SOFC operating voltage, andsis the sectional area of the SOLID.
In the above energy balances [Eqs. (15)-(20)], the heat conduction in the SOLID, the enthalpy flux because of the convection in the gas flow direction, the convective heat transfer between the gas channels and the SOLID, the enthalpy flux associated with the gas diffusion (.., the reactive H2and O2enter the SOLID and the produced H2O leaves the SOLID), and the heat release or absorption of the reactions are all considered. The heat conduction is modeled by Fourier’s law. The convective heat transfer coefficient between the gas channels and the SOLID is calculated using a constant Nusselt number, which is taken to be 3.09 in this article [10, 16]. The diffusion rates of H2, O2, and H2O are assumed to be equal to their reaction or production rates in the electrochemical reactions.
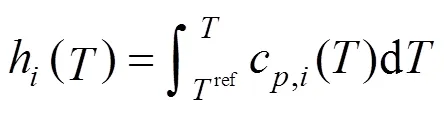
The specific enthalpy of gas speciesat the temperature of,h(), is calculated by:

The boundary conditions of Eqs. (15) and (16) are also specified by the inlet gas conditions. For the co-flow configuration, they can be written as follows:
The two ends of the SOLID are both assumed to be insulated. Therefore, the boundary conditions of Eq. (17) are given as insulation conditions:
whereis the cell length.
2.3 Electrochemical model
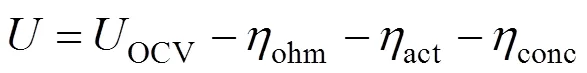
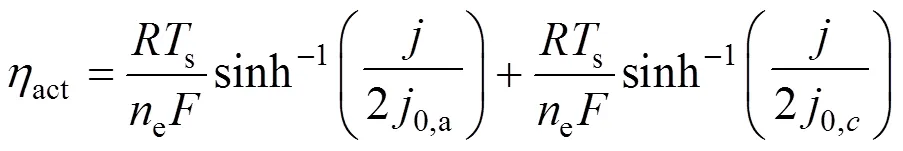
The electrochemical model is used to calculate the cell operating voltage and the current density distribution. The operating voltage of the SOFC is generically given by subtracting three kinds of overpotential losses,.., ohmic, activation, and concentration overpotentials from the reversible open circuit voltage as the following equation:
As both the electrodes and interconnects are normally good conductors, a constant operating voltage throughout the cell is considered (.., the electrodes and interconnects are considered as an equipotential surface), whereas the reversible open circuit voltage and various overpotentials are all local quantities, which depend on the local cell temperature, gas molar fractions, and current density, and will be explained next. To determine the cell operating voltage and the current density distribution, the average current density, which reflects the external load demand, also needs to be specified. The average current density is the average value of the local current density along the cell length and is defined by:

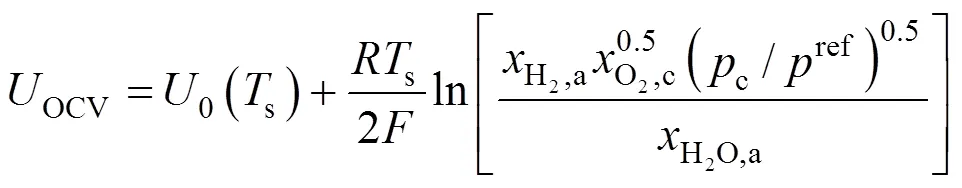
The reversible open circuit voltage,OCV, is determined by the Nernst equation:

whereohmis the internal resistance of the cell and is calculated from the conductivity of the individual layers [10] by


whereLis the limiting current density, at which the fuel is used up at a rate equal to its maximum supply speed.
3 SOLUTION METHOD
The Eqs. (3)-(8), (10)-(13), and (15)-(33) introduced above compose the SOFC model, which is an equation system consisting of a set of partial differential equations, ordinary differential equations, algebraic equations, and relevant boundary conditions. Once the average current density, the inlet gas conditions (including the inlet molar flow rates, molar fractions, and temperatures of the anode and cathode gas streams), and the initial conditions (including the initial molar fraction distribution of each gas species, and the initial temperature distributions of the anode and cathode gas streams and the SOLID) are specified, it can be solved using the numerical method [21, 22].
The SOFC domain is divided intouniform nodes along the cell length direction, with the grid points located at the centers of the nodes. The convection terms in the equation system are discretized using the first-order upwind scheme and the diffusion terms using the second-order central difference scheme. As the equation system is stiff, its transient terms are integrated using the stiff solver ode23s provided by MATLAB R2006a. In each time step, according to the specified average current density, the electrochemical model is first solved to obtain the cell voltage and the current density distribution through the use of the Newton-Raphson iteration. Afterwards, the mass source terms [Eqs. (7) and (8)] and heat source terms [Eqs. (18)-(20)] are calculated. Next, the molar flow rates,aandc, are calculated from Eqs. (15) and (16). Then, the state variables are updated from Eqs. (3)-(6) and (17). According to the solution strategy presented, a MATLAB code is designed to solve this model.
4 MODEL VALIDATION
The present SOFC model is validated by comparing its performance predictions with the results of the IEA benchmark test [12]. The benchmark test is a fuel cell stack modeling exercise conducted by IEA in 1995, which involves seven European countries and Japan. The simulated case used here for the model validation is a unit planar electrolyte-supported DIR-SOFC with co-flow configuration. The dimensions of the unit cell are given as follows: active area 100 mm×100 mm, anode thickness 50 μm, cathode thickness 50 μm, electrolyte thickness 150 μm, interconnect plate thickness 2.5 mm, number of channels 18, channel height 1 mm, channel width 3 mm, and rib width 2.42 mm. The input parameters of the benchmark test are listed in Table 2. To avoid discrepancies caused by different treatment of the electrochemical kinetics, the anodic and cathodic overpotentials (including the activation and concentration overpotentials) are regarded as being of the same amount as the ohmic loss of the electrolyte.
The comparison of the present model predictions and the IEA benchmark test results are given in Table 3. “High” and “low” in the table refer to the highest and lowest values reported by the participants of the IEA benchmark test. It can be found that in all compared items the present model predictions fall quite close to or lie between the high and low values of the IEA benchmark test. The cell voltage predicted by the present model is slightly higher than the IEA values (the voltage deviation is less than 3.5%). This is partly because of the negligence of the ohmic loss of interconnects. The good agreement between the present model predictions and the IEA benchmark results demonstrates the effectiveness of the present model.
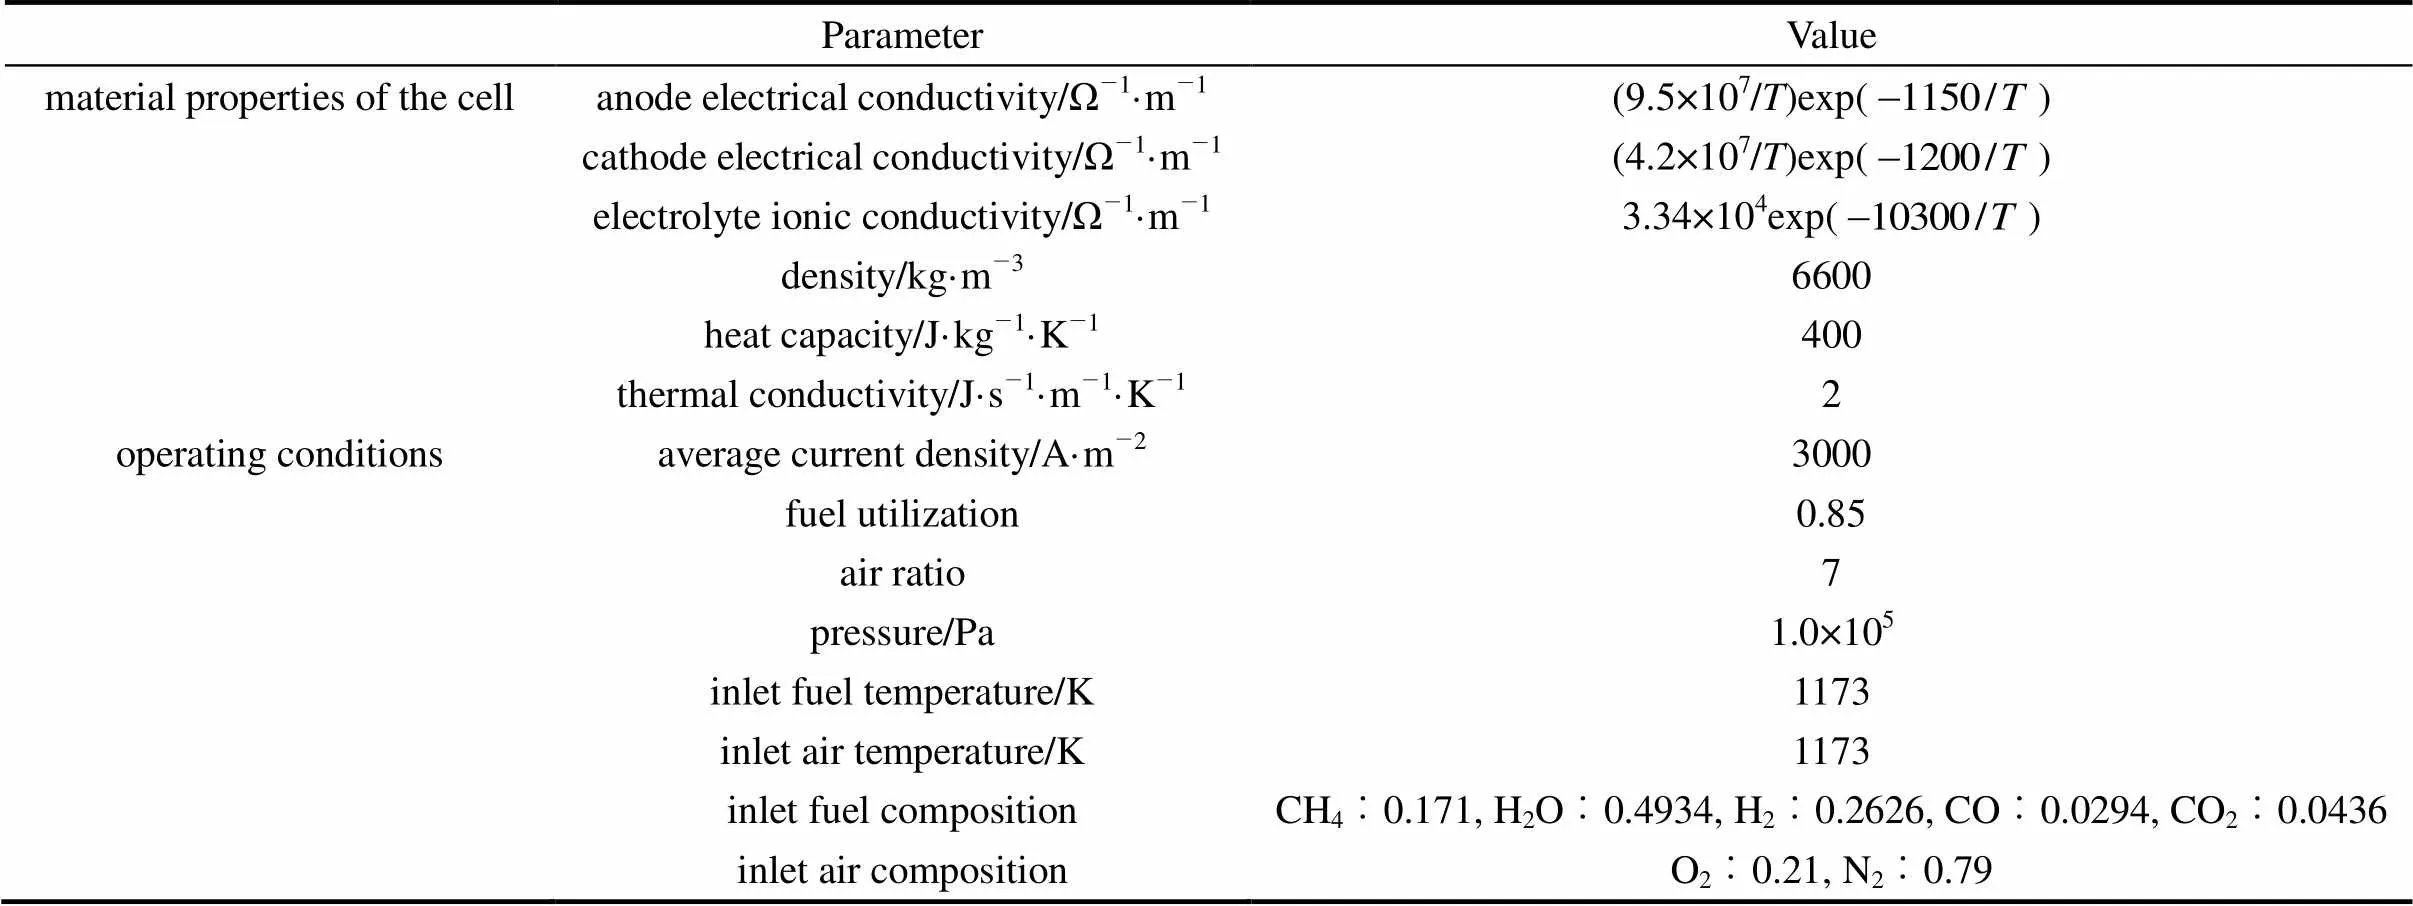
Table 2 Parameters used in model validation [12]
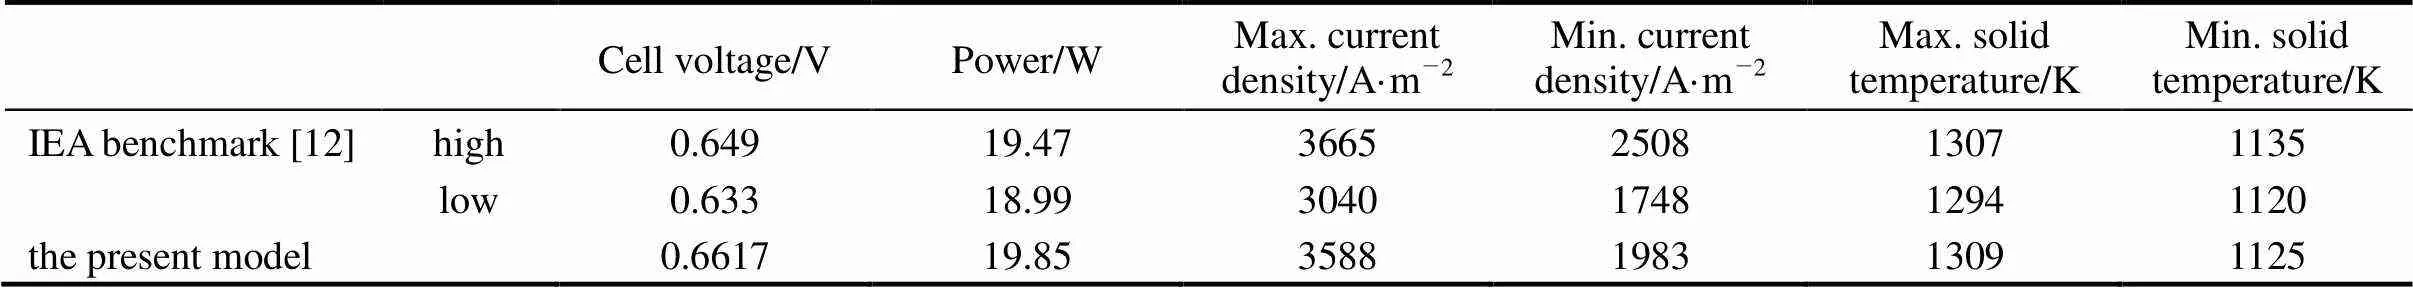
Table 3 Results of model validation
5 SIMULATION RESULTS AND DISCUSSION
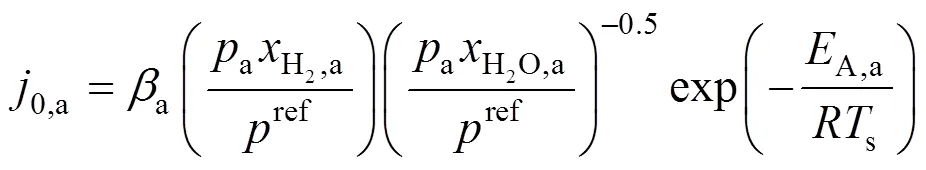
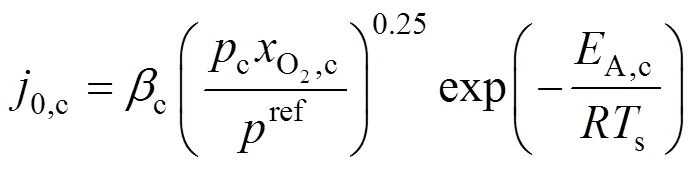
The present model is able to predict some SOFC variables, including the cell temperature, the gas molar fractions, the cell voltage and the current density, along the cell length as well as their variation with time. Using this model, simulations are performed to investigate the behavior of a co-flow planar anode-supported intermediate-temperature DIR-SOFC. Parameters used in the simulations are listed in Table 4. The activation energy and limiting current density are typical values for anode-supported intermediate-temperature SOFCs. The anodic and cathodic pre-exponential coefficients are determined to guarantee reasonable activation overpotentials. Here, the anode area specific resistance of not more than 1.0×10⁻⁵Ω·m2and the cathode one of around 2×10⁻⁵Ω·m2at 1073 K are considered reasonable for anode-supported intermediate-temperature SOFCs [10, 18]. For the initial operating conditions, the average current density value is chosen to make the cell operate at a voltage between 0.6 and 0.7 V. The air ratio value guarantees a temperature increase along the cell of around 100 K. The inlet fuel has a steam/ carbon ratio above 2 to avoid the occurrence of carbon deposition. In this section, the steady-state performanceof the cell for the initial operating conditions is first presented. Then, its transient behavior is analyzed when some operating parameter disturbances are imposed.
5.1 Steady-state performance for initial operating conditions
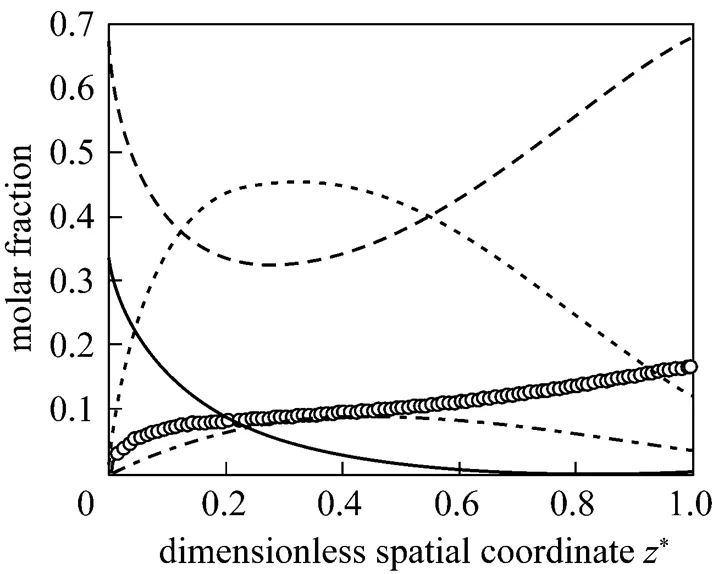
Figures 2-5 present the distributions of some variables of the SOFC along the cell length direction under the initial operating conditions. In these figures, the spatial coordinates have been made dimensionless for better illustration. Fig. 2 gives the molar fraction distributions of all the gas species in the anode channels. It can be seen that after the fuel stream is fed into the anode channels, the molar fractions of CH4and H2O decrease rapidly, while that of H2increases rapidly. This indicates that the steam reforming reaction is much faster at the inlet of the anode channels because of the high content of CH4there. The CH4is consumed gradually and is almost exhausted when*is larger than 0.6. After reaching their respective extrema, the molar fractions of H2O and H2start to increase and decrease, respectively. This indicates that, because of the consumption of CH4, the reforming reaction grows weak, while the hydrogen oxidation reaction, which consumes H2and produces H2O, becomes dominant. At the anode outlet, the composition of the gas stream is 67.73% in H2O, 12.39% in H2, 3.49% in CO, and 16.39% in CO2.
Figure 3 gives the temperature distributions of the anode and cathode gas phase, and the SOLID. It can be seen that these temperatures all decrease at the inlet of the fuel cell because of the cooling effect associated with the endothermic steam reforming reaction. Particularly, the anode gas temperature sharply decreases by more than 65 K in relation to its inlet value within a distance of several millimeters. As the steam reforming reaction grows weak and the exothermic hydrogen oxidation becomes dominant, these temperatures start to increase along the gas flow direction, with their maximum temperatures occurring at the cell outlet. The maximum and minimum SOLID temperature is 1122 and 980 K, respectively, leading to a maximum temperature difference of approximately 142 K.
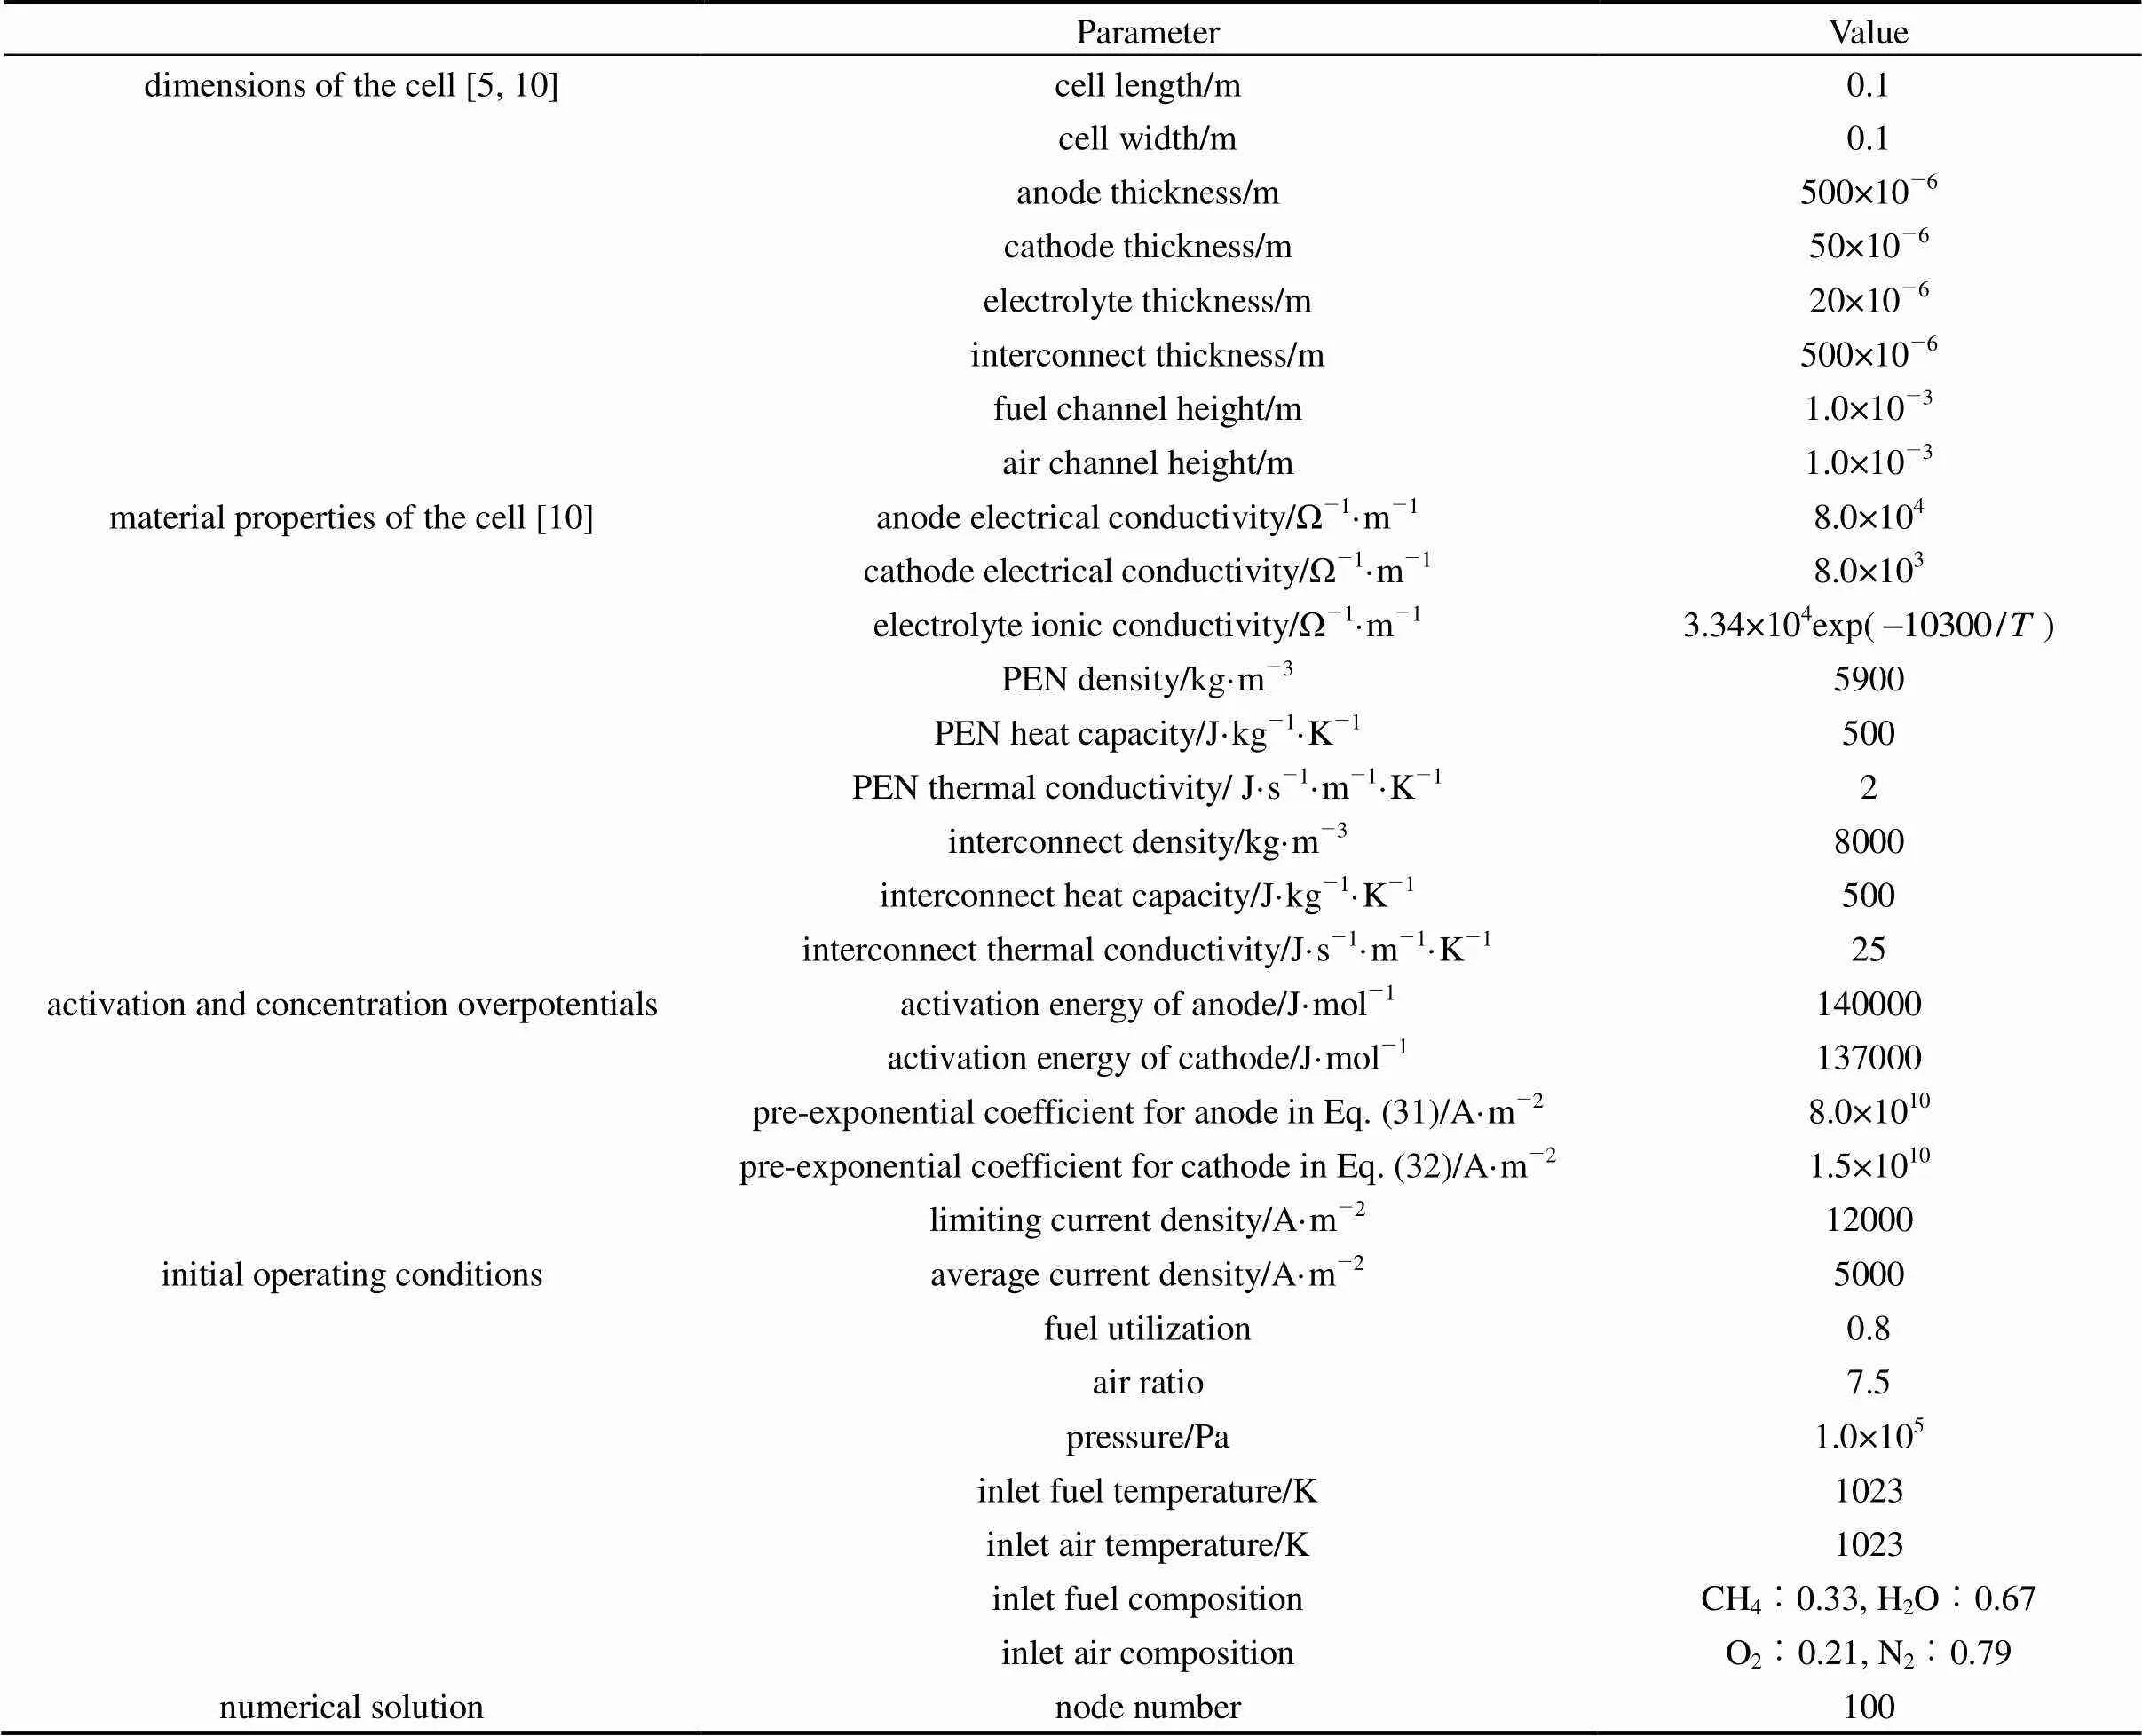
Table 4 Parameters used in simulation

As the thin film of the PEN is brittle and is apt to be damaged by excessive thermally induced stresses within it, attention should be paid to the temperature gradients of the PEN along the cell. The present model can calculate the temperature gradient distribution of the SOLID (see Fig. 4), which can reflect that of the PEN to a certain extent. It can be seen from Fig. 4 that there exist two extrema of the SOLID temperature gradient. The smaller one, which is near the cell inlet, results from the endothermic reforming reaction, whereas the larger one is because of the heat accumulation along the cell length direction. The trend of this curve is reasonable.
From the analysis on Figs. 2-5, it can be found that introducing the direct internal reforming has significant effects on the distributions of these variables. These profiles are in agreement with those reported by Aguiar. [10] and Nikooyeh. [5] using different SOFC models. Under this steady state, the SOFC has a voltage of 0.658V and an electrical efficiency of 50.7% (low heat value, LHV).
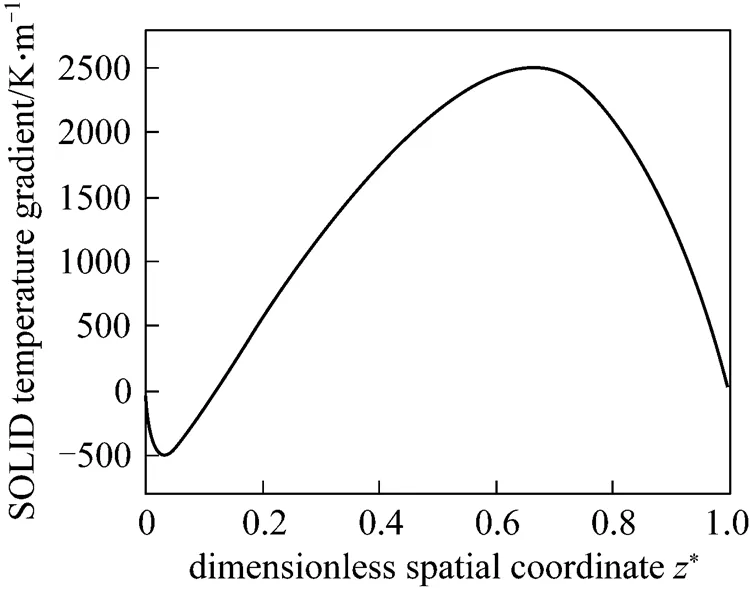
Figure 4 Steady-state temperature gradient distribution of the SOLID for the initial operating conditions in Table 4
Figure 5 Steady-state current density distribution for the initial operating conditions in Table 4
5.2 Transient behavior analysis
In this sub-section, the dynamic response of the SOFC to disturbances in several operating parameters, including the load current, and the inlet fuel and air flow rates, is analyzed with the above steady state as the initial state. For each operating parameter, both its step-decrease and step-increase are considered.
5.2.1
From Figs. 6 and 7, it can be seen that the SOLID temperature of each position and the maximum SOLID temperature gradient both decrease for the step-decrease in the average current density and both increase for its step-increase. The transient process of the SOLID temperature lasts approximately 400-600 s.
It can be seen from Fig. 8 that when the step-decrease/step-increase in the average current density occurs, the current density of each position has a pronounced instantaneous decrease/increase, followed by slight variations because of the SOLID temperature dynamics. At last, the current density of each position stabilizes at a lower/higher level than its initial value. In addition, it can also be found that the transient behavior of the local current density varies with the position.
It can be seen from Fig. 9 that when the average current density step-decrease occurs, the cell voltage first increases instantaneously, then gradually goes down, and finally, stabilizes at a new steady-state value higher than the initial voltage. The dynamic response of the cell voltage is characterized by an overshoot. This phenomenon can be explained as: immediately after the average current density decreases, the cell temperature is still high, while various overpotentials become lower at that point. The lower amount of waste heat produced at the lower average current density (.., 4000 A·m-2) causes the cell temperature to go down, which results in the gradual decrease in the cell voltage because of the cell overpotential increase. For the average current density step-increase, the cell voltage response shows the opposite trend.

5.2.2

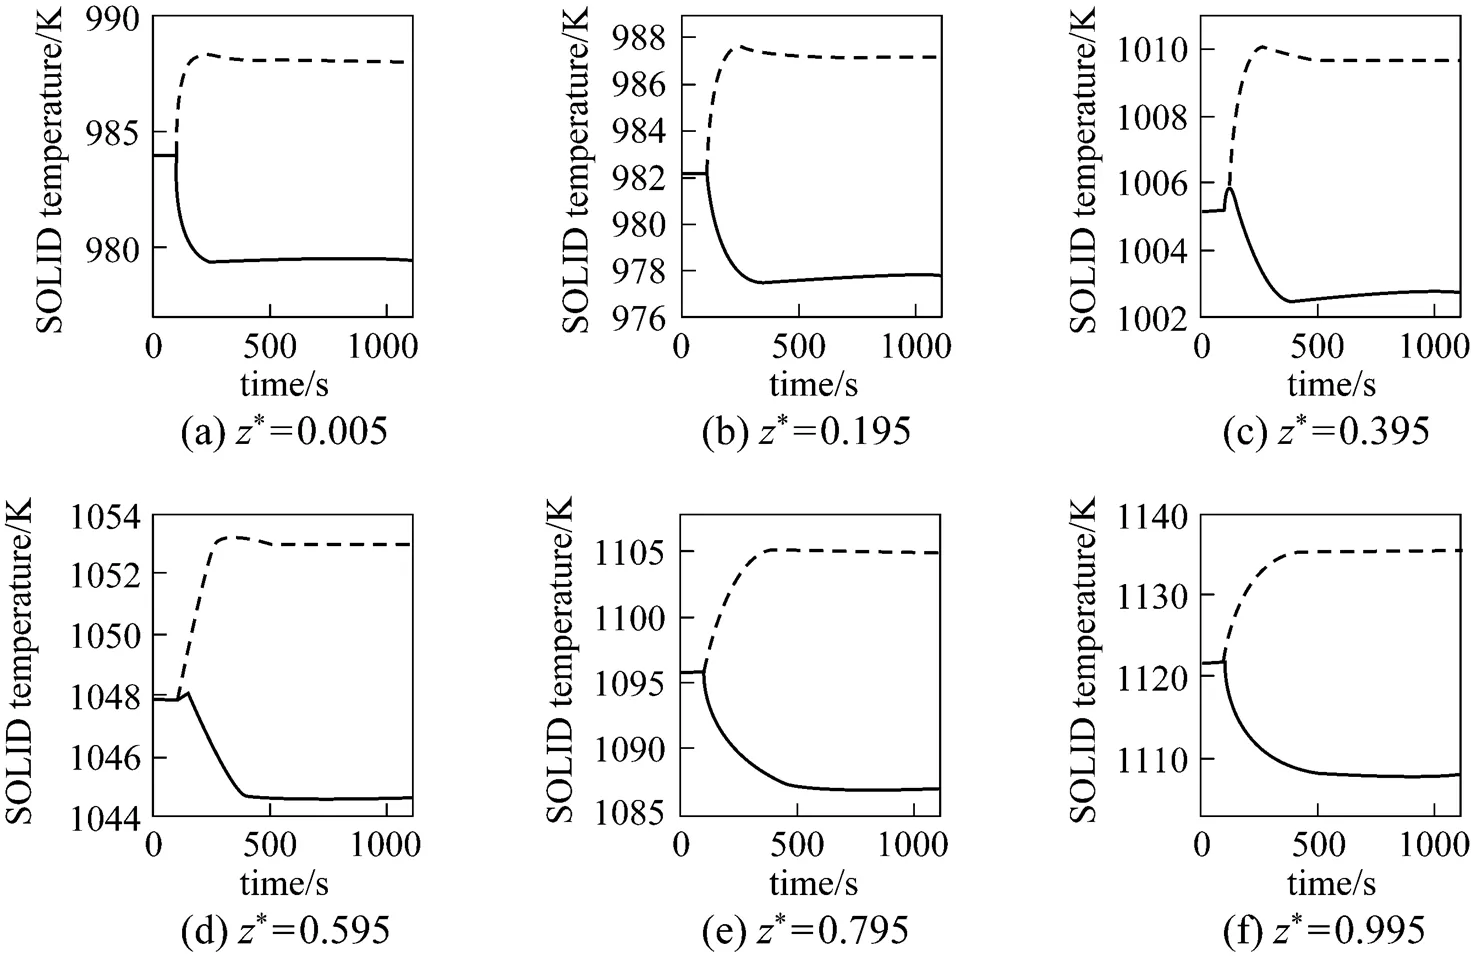
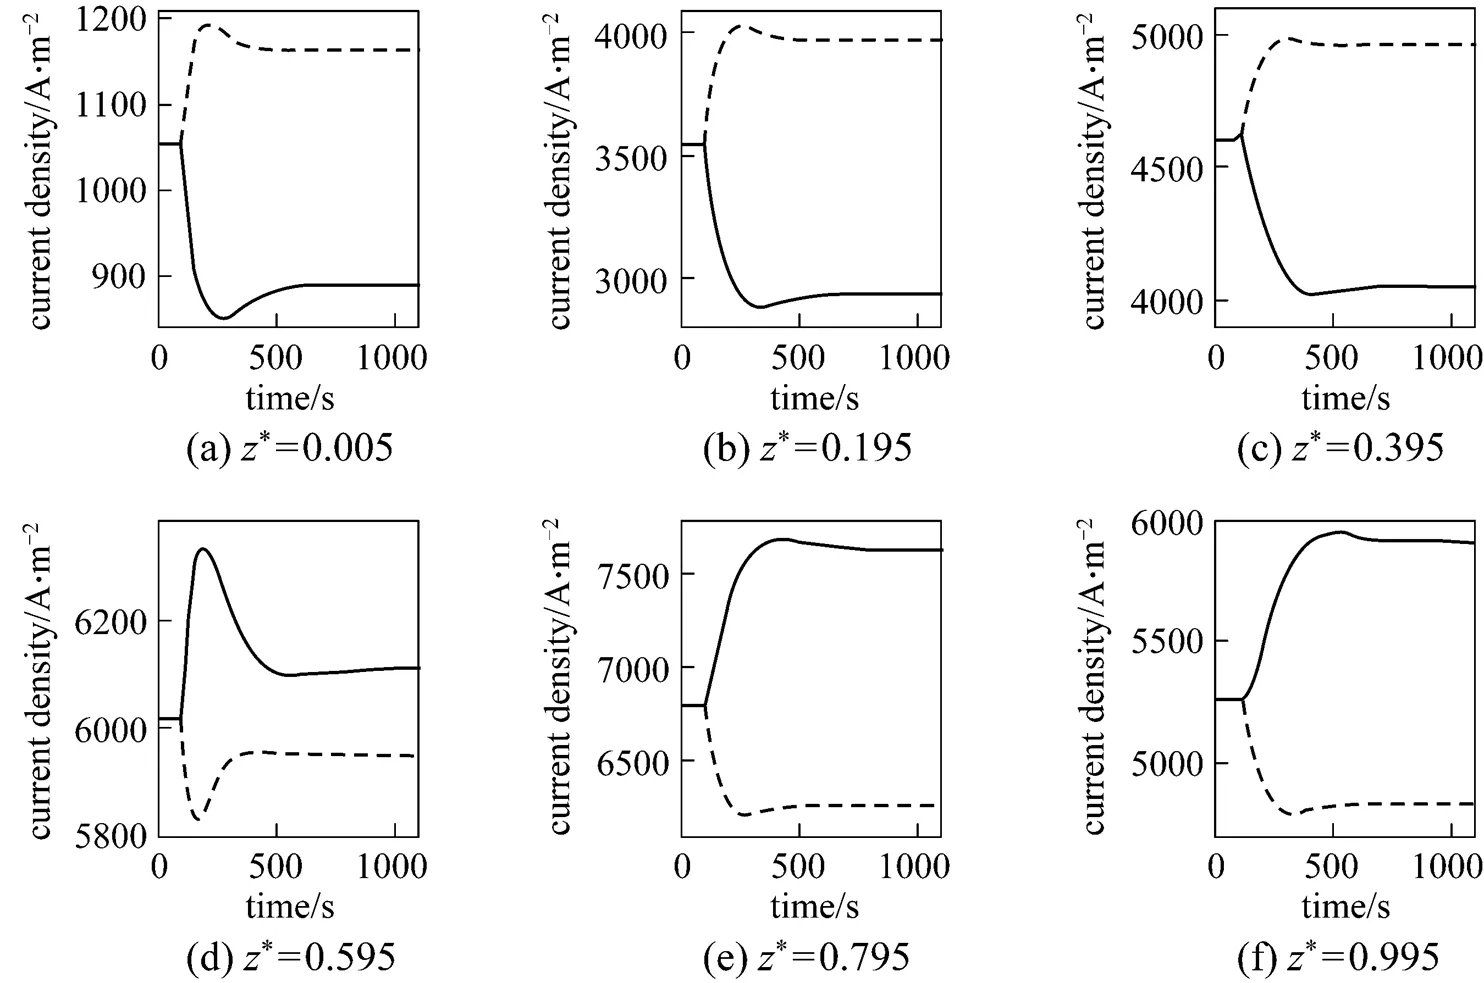
Figure 10 presents the corresponding dynamic response of the SOLID temperature. It can be seen that after the fuel utilization step-decrease, the SOLID temperature of each position decreases. This is because the amounts of heat absorbed by the steam reforming reaction and transferred by convection both increase because of the inlet fuel flow rate increase. In addition, it is worth noting that the SOLID temperature at the cell outlet has a slight increase before it decreases [Fig. 10 (f)]. The transient behavior is not owned by the SOLID temperature responses of other positions. From the current density dynamic response, shown in Fig. 11, it can be found that this SOLID temperature increase is related to the local current density increase there.
Figure 11 presents the corresponding dynamic response of the local current density. After the fuel utilization step-decrease, the current density of each position has a rapid change because of changes in the H2and H2O molar fractions, followed by slow variations resulting from the SOLID temperature dynamics. Finally, the current densities of some positions increase, while those of some positions decrease. This indicates that the current density distribution might change because of the fuel utilization change. This conclusion can be corroborated by Fig. 12, which illustrates the steady-state current density distributions for different fuel utilizations.
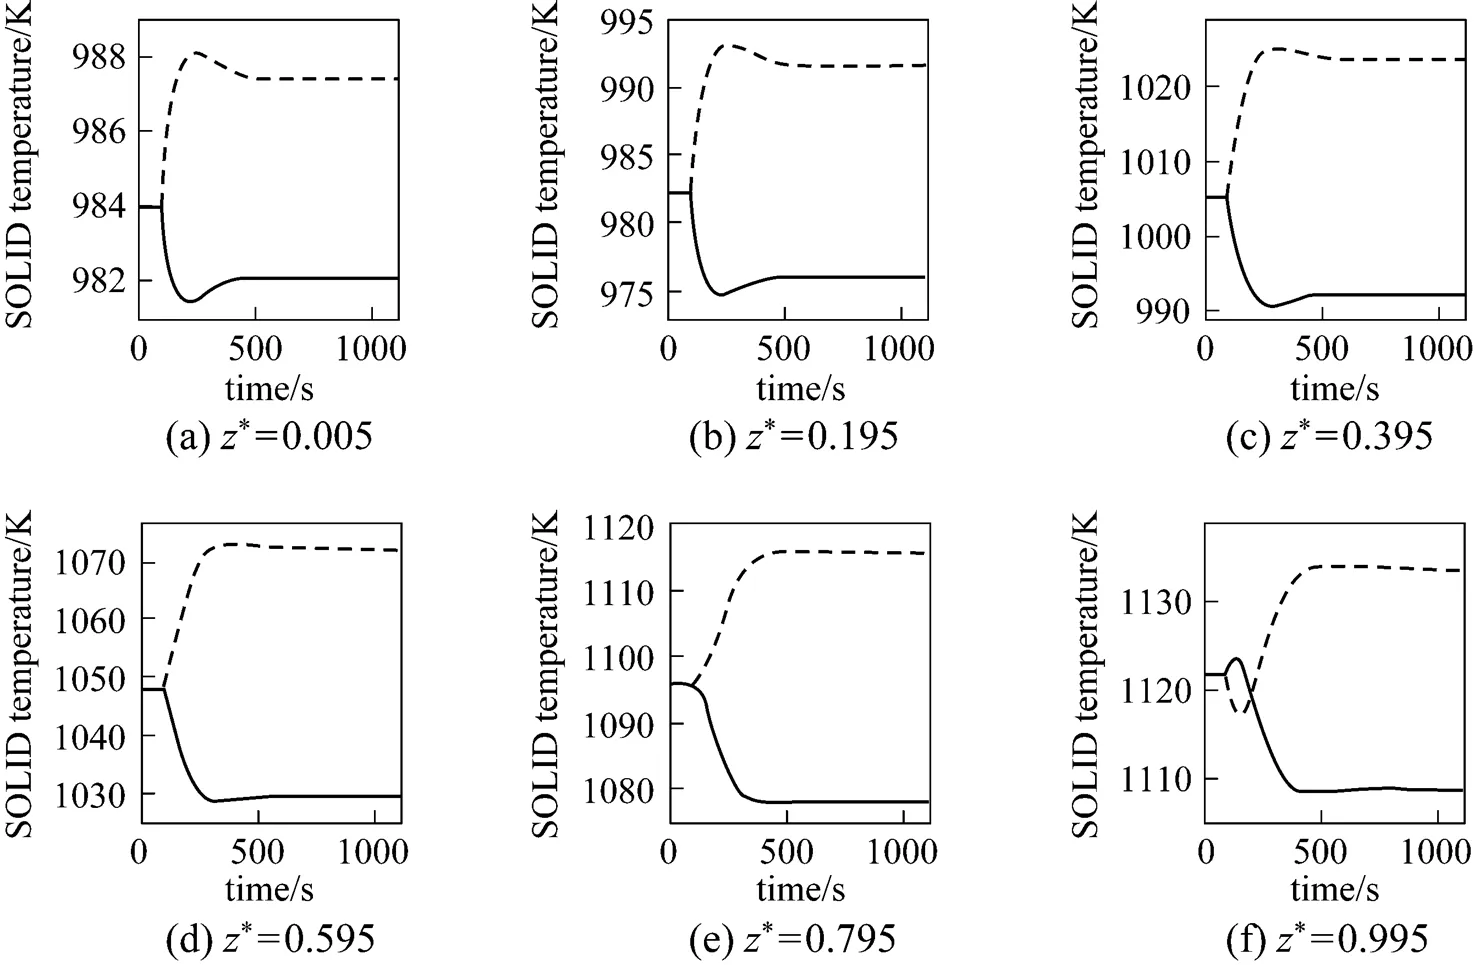
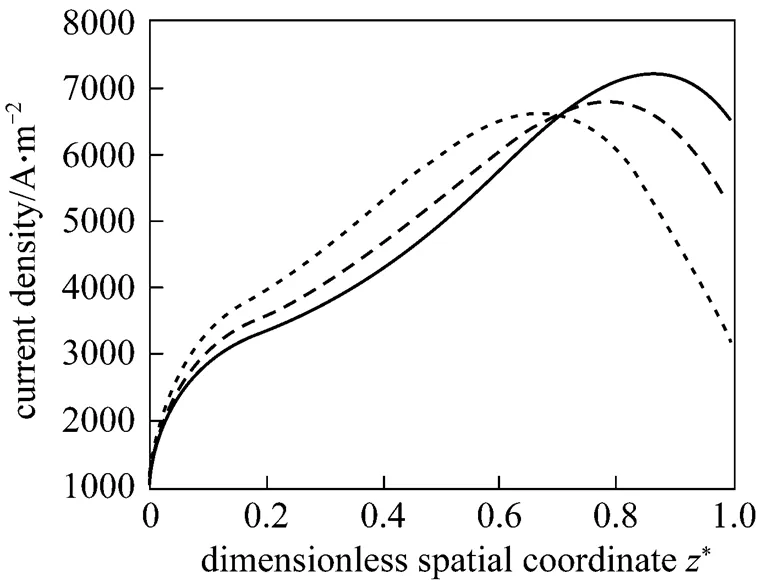
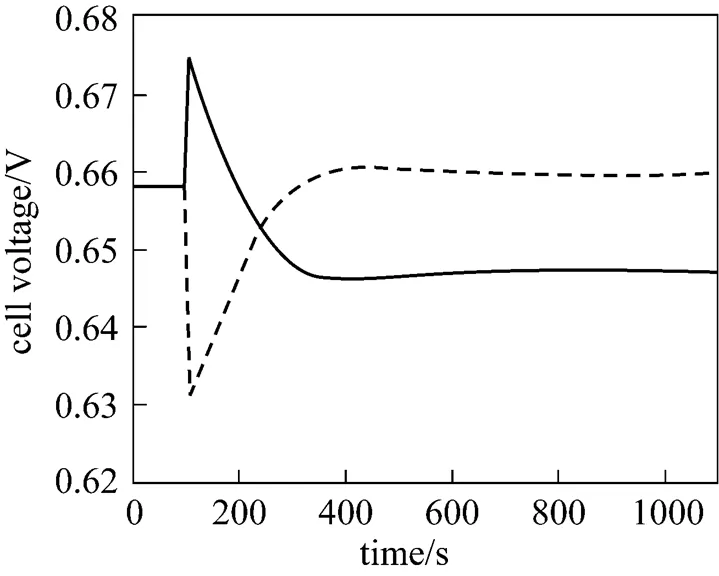
Figure 13 presents the corresponding dynamic response of the cell voltage. It can be seen that after the fuel utilization step-decrease, the cell voltage first increases instantaneously, and then, gradually decreases to a new steady-state value lower than its initial value. An overshoot can also be observed from the response curve of the cell voltage. The instantaneous voltage increase is caused by the H2molar fraction increase arising from the fuel flow rate increase and the subsequent voltage decrease results from the cell temperature decrease.
In addition, from Figs. 10, 11, and 13, it can also be found that the responses of the SOLID temperature, local current density, and cell voltage to the fuel utilization step-increase show the opposite trends to those of the fuel utilization step-decrease.
5.2.3
Figures 14 and 15 present the corresponding dynamic responses of the SOLID temperature and the local current density, respectively. It can be seen that after the air ratio changes, the SOLID temperatures and local current densities of some positions decrease, while those of some positions increase. These figures indicate that the inlet air flow rate change leads to the changes in the distributions of the SOLID temperature and the current density. In addition, it can be found from Fig. 15 that the current density dynamic process is mainly caused by the SOLID temperature dynamics, while the effect of the O2molar fraction change, which results from the inlet air flow rate change, on the current density is hardly noticeable.
To show the impact of the air ratio more clearly, Fig. 16 presents the steady-state distributions of the SOLID temperature and the local current density for different air ratios. It can be seen that the air ratio decrease can lead to steeper SOLID temperature profiles and to more uneven current density distributions, and its increase can flat the SOLID temperature and the current density distributions. Table 5 lists the corresponding maximum temperature, maximum temperature difference, and maximum temperature gradient of the SOLID for different air ratios. It can be seen that, with the air ratio increase, these variables all go down. This is the reason why the inlet air flow rate is often manipulated to control the cell temperature.
Figure 17 presents the corresponding dynamic response of the cell voltage for the air ratio disturbances. It can be found that when the air ratio step-decrease/ step-increase is introduced, the cell voltage first has a tiny step-decrease/step-increase, and then, undergoes a slow transient process characterized by an overshoot/ undershoot. The tiny voltage step-decrease/step-increase is caused by the O2molar fraction decrease/increase arising from the inlet air flow rate decrease/increase and the subsequent slow transient process results from the SOLID temperature dynamics.

Table 5 Maximum temperature, temperature difference and temperature gradient of the SOLID for different air ratios
6 CONCLUSIONS
A one-dimensional dynamic planar DIR-SOFC model has been developed based on mass and energy balances, and electrochemical principles. The model is able to predict some SOFC variables, including the cell temperature, the gas molar fractions, the cell voltage, and the current density along the cell length as well as their variation with time. The effectiveness of the present model has been verified by using the IEA benchmark test. Through model-based simulations, the steady-state performance of a co-flow planar DIR-SOFC under specified initial operating conditions and its dynamic response to the step-changes in several operating parameters including the load current, and the inlet fuel and air flow rates have been investigated. From the analysis of the simulation results, the following main conclusions can be drawn:
(1) The direct internal reforming process has significant effect on the distributions of the anode gas composition, cell temperature, SOLID temperature gradient, and current density along the cell length direction.
(2) Because of the spatially distributed property of the cell temperature and the current density, their transient behavior varies with the position.
(3) The rapid dynamics of the current density and the cell voltage are mainly influenced by the gas composition, particularly the H2molar fraction in anode gas channels, whereas their slow dynamics are both dominated by the SOLID temperature.
(4) As the load current increases, the SOLID temperature and the maximum SOLID temperature gradient both increase. Thereby, the cell breakdown is apt to occur because of excessive thermally induced stresses.
(5) Changing the inlet fuel flow rate might lead to the change in the anode gas composition and the consequent changes in the current density distribution and the cell voltage.
(6) The inlet air flow rate has a great impact on the cell temperature distribution along the cell. Its decrease can result in a steeper SOLID temperature distribution, whereas its increase can make the SOLID temperature distribution flat, leading to decreases in the maximum temperature, maximum temperature gradient, and maximum temperature difference of the SOLID. Therefore, the inlet air flow rate is a suitable manipulated variable to control the cell temperature.

NOMENCLATURE
area, m2
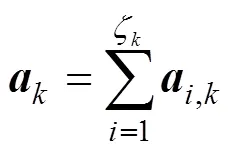
,kstoichiometric vector of speciesin streamin reactions (i)-(iv)
total stoichiometric vector of streamin reactions (i)-(iv)
gas molar concentration, mol·m-3
c,imolar specific heat capacity of gas species, J·mol-1·K-1
c,smass specific heat capacity of the SOLID, J·kg-1·K-1
Aactivation energy, J·mol-1
Faraday constant, C·mol-1
Δreaction enthalpy change at the temperature of 298.15 K, J·mol-1
gaseous molar specific enthalpy, J·mol-1
average current density, A·m-2
local current density, A·m-2
shequilibrium constant of WGS reaction
rsteam reforming reaction constant, mol·s-1·m-2·Pa-1
s,a,s,cconvective heat transfer coefficients between gas streams and the SOLID, J·s-1·m-2·K-1
shWGS reaction constant
cell length, m
s,a,s,ctotal sectional perimeter of anode, cathode gas channels, m
molar flow rate, mol·s-1
node number
enumber of electrons transferred per electrochemical reaction
pressure, Pa
universal gas constant
ohmcell internal resistance, Ω·m2
rreaction rate of reaction, mol·s-1·m-2
hheat source term, J·s-1·m-3
mmass source term, mol·s-1·m-3
temperature, K
cell operating voltage, V
OCVopen circuit voltage, V
0open circuit voltage at the standard pressure, V
cell width, m
x,kmolar fraction of gas speciesin stream
spatial coordinate, m
a,cpre-exponential coefficient for anode and cathode in Eqs. (31) and (32), A·m-2
ζnumber of gas species in stream
overpotential, V
thermal conductivity, J·s-1·m-1·K-1
density, kg·m-3
a,c,elelectrical conductivity of anode, cathode and electrolyte, Ω-1·m-1
a,c,elthickness of anode, cathode and electrolyte, m
Superscripts
ref reference condition (298.15 K, 1.0×10⁵Pa)
0 inlet gas conditions
* dimensionless
Subscripts
a anode
act activation
c cathode
con concentration
gas species
int interconnect
reaction
gas stream
ohm ohmic
PEN PEN structure
r steam reforming reaction
s SOLID
sh WGS reaction
1 Singhal, S.C., Kendall, K., Ormerod, R.M., High Temperature Solid Oxide Fuel Cells: Fundamentals, Design and Applications, Singhal, S.C., Kendall, K., eds., Elsevier Advanced Technology, UK, 1-2, 18, 333-341 (2003).
2 Ferguson, J.R., Fiard, J.M., Herbin, R., “Three-dimensional numerical simulation for various geometries of solid oxide fuel cells”,., 58, 109-122 (1996).
3 Selimovic, A., “Modelling of solid oxide fuel cells applied to the analysis of integrated systems with gas turbines”, Ph. D. Thesis, Lund Univ., Sweden (2002).
4 Li, P., Chyu, M.K., “Simulation of the chemical/electrochemical reactions and heat/mass transfer for a tubular SOFC in a stack”,., 124, 487-498 (2003).
5 Nikooyeh, K., Jeje, A.A., Hill, J.M., “3D modeling of anode-supported planar SOFC with internal reforming of methane”,., 171, 601-609 (2007).
6 Hall, D.J., Colclaser, R.G., “Transient modeling and simulation of a tubular solid oxide fuel cell”,..., 14, 749-753 (1999).
7 Xue, X., Tang, J., Sammes, N., Du, Y., “Dynamic modeling of single tubular SOFC combining heat/mass transfer and electrochemical reaction effects”,., 142, 211-222 (2005).
8 Achenbach, E., “Three-dimensional and time-dependent simulation of a planar solid oxide fuel cell stack”,., 49, 333-348 (1994).
9 Achenbach, E., “Response of a solid oxide fuel cell to load change”,., 57, 105-109 (1995).
10 Aguiar, P., Adjiman, C.S., Brandon, N.P., “Anode-supported intermediate temperature direct internal reforming solid oxide fuel cell (I) Model-based steady-state performance”,., 138, 120-136 (2004).
11 Aguiar, P., Adjiman, C.S., Brandon, N.P., “Anode-supported intermediate-temperature direct internal reforming solid oxide fuel cell (II) Model-based dynamic performance and control”,., 147, 136-147 (2005).
12 Braun, R.J., “Optimal design and operation of solid oxide fuel cell systems for small-scale stationary applications”, Ph. D. Thesis, Univ. of Wisconsin-Madison, USA (2002).
13 Matsuzake, Y., Yasuda, I., “Electrochemical oxidation of H2and CO in a H2-H2O-CO-CO2system at the interface of a Ni-YSZ cermet electrode and YSZ electrolyte”,..., 147, 1630-1635 (2000).
14 Achenbach, E., Riensche, E., “Methane/steam reforming kinetics for solid oxide fuel cells”,., 52, 283-288 (1994).
15 Campanari, S., Iora, P., “Definition and sensitivity analysis of a finite volume SOFC model for a tubular cell geometry”,., 132, 113-126 (2004).
16 Bossel, U.G., Final Report on SOFC Data: Facts and Figures, Swiss Federal Office of Energy, Berne (1992).
17 Kyle, B.G., Chemical and Process Thermodynamics, Prentice Hall, Englewood Cliffs (1984).
18 Chan, S.H., Khor, K.A., Xia, Z.T., “A complete polarization model of a solid oxide fuel cell and its sensitivity to the change of cell component thickness”,., 93, 130-140 (2001).
19 Costamagna, P., Honegger, K., “Modeling of solid oxide heat exchanger integrated stacks and simulation at high fuel utilization”,..., 145, 3995-4007 (1998).
20 Larminie, J., Dicks, A., Fuel Cell Systems Explained, John Wiley & Sons, Chichester, 51 (2000).
21 Patankar, S.V., Numerical Heat Transfer and Fluid Flow, Hemisphere, Washington (1980).
22 Yu, L.J., Yuan, J.Q., Cao, G.Y., Jiang, X.M., “Numerical simulation of dynamic performance of the molten carbonate fuel cell”,...., 12, 272-276 (2004).
2008-06-19,
2008-09-14.
the National High Technology Research and Development Program of China (2006AA05Z148).
** To whom correspondence should be addressed. E-mail: yingwei.kang@gmail.com
猜你喜欢
杂志排行

Chinese Journal of Chemical Engineering的其它文章
- Design and Performance Analysis of Micro Proton Exchange Membrane Fuel Cells*
- Isolation of Cordyceps ophioglossoides L2 from Fruit Body and Optimization of Fermentation Conditions for Its Mycelial Growth*
- Efficient and Comprehensive Utilization of Hemicellulose in the Corn Stover*
- Simulating Surface Aeration Systems at Different Scale of Mixing Time*
- Kinetics of Reaction-Crystallization of Struvite in the Continuous Draft Tube Magma Type Crystallizers—Influence of Different Internal Hydrodynamics
- Preparation and Characterization of Tungsten-substituted Molybdophosphoric Acids and Catalytic Cyclodehydration of 1,4-Butanediol to Tetrahydrofuran*