CeO2/RP-PSCFM@CoFe 阳极材料用于质子导体乙烷燃料电池共生乙烯和电能
2021-07-10樊赟陈国诞奚修安李俊王琦骆静利符显珠
樊赟,陈国诞,奚修安,李俊,王琦,骆静利,符显珠,*
1 深圳大学材料学院,广东 深圳 518060
2 中国地质大学材料科学与技术学院,北京 100083
1 Introduction
The steep rise in energy demand and the exhaustion of fossil fuel reserves have prompted the pursuit of high electrical energy generation efficiency and the development of renewable energy.Solid oxide fuel cells (SOFCs) can directly generate electricity without the restriction of the Carnot cycle1, they are theoretically more efficient and cleaner than the existing conventional energy conversion technology, and are currently a potential choice to make up for the rapid growth of power demand and reduce the environmental impact2. Compared with the traditional SOFCs that only generates electricity3, the proton conductor SOFCs using ethane as fuel can co-produce valueadded products and electricity4,5. By adjusting the discharge current and voltage as the reaction driving force to further control the synthesis process to spontaneously undergo thermodynamic changes6.
Perovskite structure oxides is widely studied as the stable reaction substrates due to the stable phase structure and flexibility of doping7–9. Modification of noble metal nanoparticles on the oxide surface is considered an effective means to improve catalytic activity. However, precious metals are difficult to use on a large scale due to high price and large ion radius10, and are prone to agglomeration and coarsening.Nanoparticles grownin situfrom the perovskite precursor can effectively control the distribution and growth of the particles and increase the catalytic active sites. Meanwhile, the strong interaction between the nanoparticles and the matrix inhibits agglomeration, and improves the stability and reliability of the anode11–13. Compared with noble metals, transition metals such as Fe14, Co15,16, and Ni17,18are easier to enter the perovskite structures due to small ion radius and low segregation energy,forming a metal-oxide composite structure in a reducing atmosphere. For example, double perovskite material Sr2FeMo2/3Co1/3O6−δis transformed into Ruddlesden-Popper structure Sr3FeMoO7and the uniformly precipitated Co-Fe alloy nanoparticles mixed phase at 850 °C in H2and exhibits excellent performance and stability under propane19. R-P phase structure of (Pr0.4Sr0.6)3(Fe0.85Mo0.15)2O7and Co-Fe alloy is obtained by reducing Pr0.4Sr0.6Co0.2Fe0.7Mo0.1O3−δat 900 °C in 10% H2/N2and successfully used in ethane conversion with outstanding performance20. In addition, the precipitation of Fe-Ni alloys also has been widely studied for using in hydrocarbon fuels21–23.
In the proton conductor SOFCs of ethane and other hydrocarbon fuels, the anode reaction process first promotes the catalytic dissociation of hydrocarbon fuels at high temperatures to obtain olefins, low-carbon alkanes and hydrogen, and the generated protons are then transferred to the cathode side through the electrolyte layer to promote a positive reaction24.However, the anode is easily deactivated due to coarse grains and catalyst agglomeration in hydrocarbon fuels. Consequently,stable catalytic activity for hydrocarbon fuels are very important for obtaining high yield of chemicals and high proton conductivity25. CeO2has electronic and ionic conductance at high temperature, which helps the adsorption and dissociation of hydrocarbons26. Usually, the immersion method is used to bring CeO2into the anode pore structure, effectively expand the threephase interface of the anode27, and form the effective Ce(IV)-Ce(III) redox pair in a reducing atmosphere to produce oxygen storage capacity, which is very beneficial to the oxidation reaction of the anode28.
Herein, impregnation is used to load a layer of CeO2on the Pr0.4Sr0.6Co0.2Fe0.7Mo0.1O3−δto improve the ionic conductivity of the electrode and inhibit the growth of grain nuclei on the anode surface. Then a novel type of CeO2/RP-PSCFM@CoFe composite anode containing nanoparticles is obtained in hydrogen, which demonstrates excellent performance for the coproduction of ethylene and electricity in proton conductive ethane fuel cells.
2 Experimental
2.1 Material preparation and cell fabrication
The Pr0.4Sr0.6Co0.2Fe0.7Mo0.1O3−δperovskite anode powders were prepared by the sol-gel method29with Pr(NO3)3·6H2O (≥99.99%), Sr(NO3)2(≥ 99.5%), Co(NO3)2·6H2O (≥ 99.99%),Fe(NO3)3·9H2O (≥ 99.99%) and (NH4)2MoO4(≥ 99.99%) were used as raw materials, dissolved in deionized water containing nitric acid according to the stoichiometric ratio to form a nitrate solution. Then citric acid monohydrate (≥ 99.5%) and ethylenediaminetetraacetic acid (EDTA, ≥ 99.5%) were added as chelating agent and burning agent to form a soluble complex.The molar ratio of citric : EDTA : total metal ions was 1.5 : 1 : 1.Ammonia was used to adjust the pH value of the solution and control it at 7–7.5 to facilitate the hydroxylation of metal salts.After stirring for 2 h, it was mixed well and heated to evaporate water until it was gelatinous. Then it was moved to an oven for constant temperature dehydration at 250 °C to obtain dry gel.The precursor was collected and put into a crucible and kept at 1050 °C for 6 h to obtain the required anode powders. Similarly,La0.6Sr0.4Co0.2Fe0.8O3−δ(LSCF) cathode material was synthesized by the same way. BaZr0.1Ce0.7Y0.2O3−δ(BZCY)electrolyte powders were prepared by traditional solid-phase method30. The stoichiometric high-purity BaCO3(≥ 99.0%),ZrO2(≥ 99.99%), CeO2(≥ 99.99%) and Y2O3(≥ 99.9%) were used as raw materials to be fully ball milled in ethanol for 24 h to make them uniformly mixed. Then the resulting suspension was dried at 80 °C for 24 h and calcined in air at 1100 °C for 6 h to obtain electrolyte powders, and repeated grinding and calcination until a pure phase was obtained.
PSCFM-BZCY/BZCY/LSCF-SDC single cells were assembled by BZCY electrolyte supporting. The BZCY electrolyte powders were subjected to uniaxial dry pressing at a pressure of about 200 MPa in a stainless steel mold, and then sintered in air at 1500 °C for 6 h to form dense electrolyte pellets,which were then polished to about 300 μm thickness. PSCFMBZCY electrode slurry was prepared by using PEG-400 as a binder, which was applied to one side of the electrode by screen printing and then sintered at 1000 °C for 2 h. The cathode was used the same method to screen print the LSCF-SDC paste onto the other side of the electrolyte, and then sintered at 1050 °C for 2 h to obtain a complete single cell. The effective electrode area was about 0.196 cm2. An Au paste was coated on anode side and Pt paste was coated on cathode side, respectively, which were both used as the current collector.
2.2 Preparation of composite anode by dipping method
The composite anode was prepared by the wet impregnation method. Ce(NO3)3·6H2O (≥ 99.0%) was dissolved in deionized water, glycine was added as the complexing agent, and the solution was stirred at room temperature to obtain 0.5 mol∙L−1cerium nitrate complex solution. The immersion liquid was dripped 0.5 μL onto the surface of the porous anode by using a pipette, and then moved to the vacuum degasser to make it evenly reach the porous structure of the anode. After repeated immersion twice, it was calcined at 800 °C for 2 h in air to obtain CeO2/PSCFM composite anode. Then the CeO2/ RP-PSCFM @CoFe composite anode was generatedin situin the reducing atmosphere (Fig. 1).
2.3 Material characterization and electrochemical performance test
X-ray diffraction (XRD) technology (Bruker D8 advance,Germany, Cu-Kαradiation source,λ= 0.1542 nm) was used to analyze the phase structure of the powders and the phase composition of the surface after immersion. Scanning electron microscope (SEM: SU-70, Elionix, Japan) was used to check the surface microstructure changes of the electrode. X-ray photoelectron spectroscopy (XPS: Thermo Fisher Scientific KAlpha, AlKαradiation source) was used to analyze the valence changes of Co, Fe and Mo in the synthesized and reduced PSCFM.
The electrochemical performance of the cell was measured by Solartron electrochemical workstation (Solartron Analytical,UK). The electrodes were brushed on both sides of the electrolyte, calcined and reduced in H2for 2 h at 800 °C. The impedance spectra (EIS) were recorded at 600, 650, 700, 750,and 800 °C, respectively and recorded in the frequency range of 0.1–105Hz under an OCV with an applied magnitude of 5 mV.Then, the volt-ampere characteristic curve scan (I–V) of the single cells before and after immersion were recorded at 650,700, and 750 °C, respectively. The stability of the SOFCs under discharge was evaluated by the long-term constant voltage discharge. The gas chromatograph (GC 2060) was used to analyze the anode reaction products.

Fig. 1 Schematic diagram of composite anode preparation.
3 Results and discussion
As shown in Fig. 2a, the impurity phases are not detected,indicating that the pure cubic perovskite structure of PSCFM is successfully obtained by calcining at 1050 °C for 5 h in air. After reduction at 800 °C for 2 h in humidified hydrogen (Fig. 2b),PSCFM perovskite is transformed into the Ruddlesden-Poppertype (RP) layered perovskite structure31, and the characteristic peaks of the (110) and (200) crystal planes of the CoFe alloys are found in the XRD pattern32. Thereby, the CoFe nanoalloy particles arein situexsolved on the surface of the RP phase matrix to form metal-oxide composite anode of RPPSCFM@CoFe under reducing atmosphere at 800 °C. Then the reduced sample is oxidized again at 900 °C for 2 h in air, and the pure perovskite structure is completely restored again (Fig. 2c),indicating the good redox reversibility of the composite anode materials.

Fig. 2 (a) XRD patterns of PSCFM powders calcined at 1050 °C for 6 h in air; and (b) reduced at 800 °C for 2 h in H2; and(c) re-oxidized at 900 °C for 2 h in air.

Fig. 3 XRD patterns of (a) BZCY, (b) PSCFM,(c) CeO2 impregnation treatment on the anode surface.
Fig. 3 shows the XRD patterns of BZCY electrolyte (Fig. 3a),PSCFM electrode (Fig. 3b) and CeO2(PDF#34-0314) on the anode surface after screen printing and calcining of the electrolyte (Fig. 3c), indicating that CeO2is successfully mixed into the pore structure of the anode, the typical anode structure of PSCFM-BZCY-CeO2co-existing is realized, and the required composite anode is obtained. Furthermore, no impurity peaks appear after the three-phase combination in Fig. 3c. The three phase materials have good chemical compatibility and will not cause a phase change due to chemical changes during the test.
The SEM image can clearly see the microstructure changes during the anode preparation process. Fig. 4a shows that the porous structure of the prepared PSCFM powders with glossy particle surface. After reduction, nanoparticles with particle size of about 30–50 nm are uniformly distributed on the surface of the substrate as shown in Fig. 4b. The precipitated nano-particles is expected to supply more active sites for the catalytic dissociation of the fuels, enhancing the electrochemical performance of the resultant electrode. After the immersion of the electrode, a large amount of CeO2are clearly observed to adhere to the pore structure, and there is no phenomenon of blocking the pore structure in Fig. 4c. After the electrochemical testing, the CeO2particles are still well dispersed and covered on the structure surface of the electrode together with the precipitated CoFe alloy particles (Fig. 4d). Comparing with the unimpregnated anode, the decrease of precipitated CoFe alloy particles is also clearly observed, which might be since nucleation and grain growth of the CoFe alloys might be inhibited by the addition of CeO2, effectively preventing the CoFe alloys from agglomerating and coarsening at high temperature. Consequently, the uniform distribution of the particles is ensured and then the gas adsorption and electrochemical reaction are expected to be promoted.

Fig. 4 SEM images of PSCFM powders (a) before and (b) after reduction at 800 °C for 2 h in H2; the anode cross section of (c)impregnated with CeO2 and (d) after reduction at 800 °C for 2 h in H2.

Fig. 5 XPS spectra of the as-prepared and reduced of PSCFM: (a) survey spectrum; (b) Mo 3d; (c) Co 2p; and (d) Fe 2p.
The XPS spectra is used to analyze the chemical states of Mo,Fe and Co elements on the surface of PSCFM anode material before and after reduction. Fig. 5a shows that the survey spectrums of synthesized and reduced the anode samples. The elements of Pr, Sr, Co, Fe, Mo, O are clearly observed in the anode materials before and after reduction. In the Mo 3dspectrum (Fig. 5b), two symmetrical peaks are clearly observed at 235.3 and 232.2 eV before reduction, corresponding to the 3d3/2and 3d5/2electron orbitals of Mo6+, respectively.Differently, after reduction, Mo cations show the co-existence of Mo5+and Mo6+. This redox pair could be beneficial for improving the catalytic activity of anode dehydrogenation33. In the Co 2pspectrum (Fig. 5c), the 2p3/2peak of Co is divided into two peaks with binding energies of 780.1 eV and 781.3 eV,corresponding to the Co2+and Co3+of Co element, Co exists in a mixed valence state of Co2+and Co3+in the material, and the size of the 2p3/2peak area reflects the ratio of ions in different valence states34. After reduction, the area corresponding to Co3+is reduced and the area corresponding to Co2+increases. The overall valence state of Co decreases, and a peak corresponding to Co0is found at the binding energy of 777.8 eV, which proves that there is precipitation of metal Co after reduction. Fig. 5d shows the XPS spectrum of Fe 2p. Fe2+and Fe3+appear in the 2p3/2peaks of Fe, and the binding energies at the peak positions are 709.3 eV and 710.9 eV, respectively. The peaks indicate that Fe is mixed in +2 and +3 valence states35. The binding energy of the peak position of Fe0after reduction is also observed at about 706.7 eV, suggesting the precipitation of Fe from the matrix. The change in the valence state of Co and Fe element further confirms the exsolution of CoFe alloys36.
In order to study the electrochemical activity of the PSCFM anode material, the symmetric half-cell of PSCFM|BZCY|PSCFM with ~300 μm thickness of BZCY electrolyte is prepared by screen printing, and then the RPPSCFM anode is obtained by reducing under a pure hydrogen atmosphere at 800 °C for 2 h. Fig. 6a,b show a typical electrochemical impedance spectroscopy (EIS) test of a half-cell with RP-PSCFM as an electrode in a hydrogen atmosphere under OCV at 600–800 °C. The polarization resistance (Rp) of the anode is calculated according to the distance between the arc intercepts under two compressions calculated from the real axis in the Nyquist curve of Fig. 6a. In order to clearly compareRpat different temperatures, the Ohmic resistance of the wire and electrolyte are subtracted.Rpis mainly caused by the resistance of the three processes in the high, medium and low frequency ranges. The high frequency resistance is related to the charge transfer process that occurs at the TPB, and the intermediate frequency resistance is related to the gas diffusion in the anode hole. The low frequency resistance can be attributed to the gas conversion in the anode and is related to the conversion efficiency of the fuel molecule adsorption and desorption process. The overall impedance of the anode material decreases significantly with the increase of temperature, and the polarization resistance at 800 °C is 0.79 Ω·cm−2, indicating that the temperature has great effect on the oxygen reduction kinetics.
The Bode diagram in Fig. 6b shows that the polarization impedance is mainly contributed by the mid-frequency and highfrequency bands. In the lower frequency band, the fuel gas adsorbs and desorbs smoothly on the surface of the electrode,indicating that the electrode has a good catalytic ability for gas37.As the temperature increases, the proton transfer rate is accelerated and the proton migration process is promoted at the three-phase interface, while the charge transfer process accelerates, so that the high and intermediate frequency impedances are reduced.
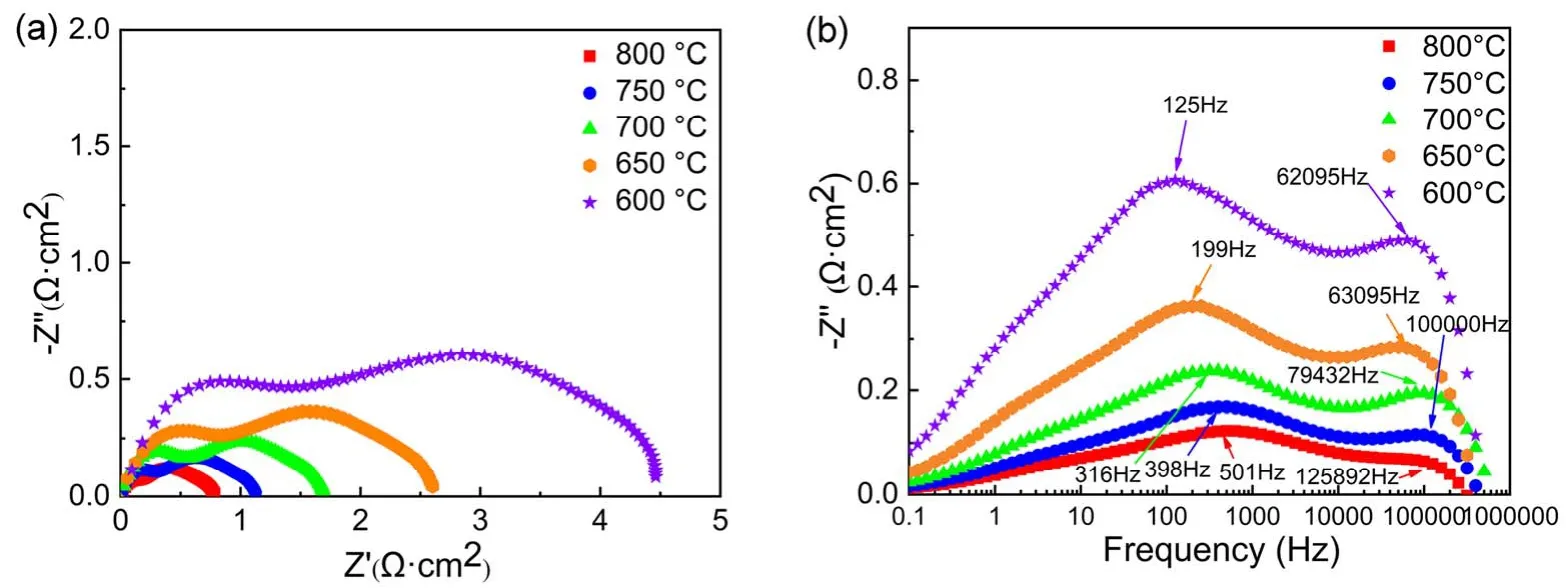
Fig. 6 (a) Nyquist plots of electrochemical impedance spectra (EIS) of RP-PSCFM|BZCY|RP-PSCFM half cell in H2 at 600–800 °C and (b) Bode plots of EIS.
The BZCY electrolyte supported proton conductor fuel cell with PSCFM-BZCY composite before and after CeO2immersion as the anode and LSCF-SDC as the cathode are constructed for electrochemical testing at different temperatures(650–750 °C) with H2as fuel gas and air as cathode gas. Firstly,it is reduced at 800 °C for 2 h to fully reduce the anode to precipitate and then test the cell discharge performance. Fig. 7 shows theI–VandI–Pcurves and corresponding impedance spectra of the single cell. The maximum power density of the cell without CeO2impregnation are 172, 133, and 95 mW·cm−2at 750, 700, and 650 °C,respectively (Fig. 7a), while the maximum power density of the impregnated cell reaches 253,177, and 129 mW·cm−2at 750, 700, and 650 °C (Fig. 7b),respectively. Obviously, the SOFC with the anode impregnated has higher electrochemical performance. TheRpcan be obtained by the difference between the total resistance of the cell and the Ohmic resistance of the BZCY electrolyte. In principle, the electrochemical performance depends on the electrode’s catalytic activity for oxygen reduction reaction. As the temperature decreases, the Ohmic impedance and polarization impedance of the single cell are gradually increasing. Similar to the test result of the half-cell, the polarization impedance of the cell in the higher frequency band is relatively large. The polarization impedance of the cell after immersion is smaller,indicating that the addition of CeO2effectively improves the three-phase reaction interface of the anode, increases the reactive area, and improves the rate of charge transfer. The Ohmic impedance occupies the main part of the total impedance of the cell, and the thickness of the electrolyte is the main reason that affects the Ohmic impedance.

Fig. 7 I–V and I–P curves of the BZCY-supported single cells with the (a) RP-PSCFM@CoFe|BZCY|LSCF/SDC and(b) CeO2/RP-PSCFM@CoFe|BZCY|LSCF/SDC measured from 750 °C to 650 °C in pure hydrogen; (c) and (d) corresponding to the EIS curves under OCV condition in pure hydrogen.
In order to study the electrocatalytic activity of the cell before and after immersion for hydrocarbon fuel, the as-prepared anode of the cell is poured into dry ethane at a flow rate of 30 mL·min−1,and then the power density of the cell before and after the anode immersion are compared at different temperature, as shown in Fig. 8. At high temperatures, ethane is partially dehydrogenated to ethylene, and then the produced protons are adsorbed and transferred to the cathode through the anode and proton conductive electrolyte, and combined with the oxygen ions of the cathode to produce water. At the same time, electrical energy is generated due to electrochemical reactions to achieve electrical energy and symbiosis of ethylene. The peak power density of the unimpregnated single cell at 750, 700, and 650 °C reaches 135, 73, and 26 mW·cm−2, while the impregnated cell is enhanced to 183, 116, and 25 mW·cm−2, respectively. The reason why the OCV decreases as the temperature decreases in ethane is that the temperature decreases and the rate of ethane dehydrogenation slows down, resulting in a slower proton conduction, which causes a drop in voltage. However, the open circuit voltage is close to the thermodynamically reversible potential, indicating that the cell has good sealing properties.Obviously, the effect of impregnating CeO2on ethane dehydrogenation conversion is more obvious above 700 °C.
Fig. 8c,d shows the EIS spectra at different temperatures under stable OCV conditions in ethane fuel. The total impedance of the cell using ethane as fuel is greater than the resistance when using H2, which is related to the oxidation kinetics of the anode material in ethane and hydrogen atmosphere. This result is also well consistent with the theoretical basis for slower oxidation kinetics of ethane38. By comparing the impedance of the cell before and after immersion in ethane atmosphere, the Ohmic impedance and polarization impedance of the cell after immersion at 700 °C or higher are significantly reduced, while the impedance is almost the same at 650 °C. When the temperature is above 700 °C, CeO2has high proton mass transfer capacity, which accelerates the transport of anode protons to the three-phase interface. At the same time, the increased active sites exhibit excellent adsorption and dissociation capabilities at high temperatures, which promotes the dehydrogenation rate of ethane. The increase in temperature promotes the increase of electronic and ion conductance, which has lower polarization resistance and catalytic activity.
The exhaust gas from the cell is connected to a gas chromatograph, and the composition of the anode product is analyzed by the internal standard method. Fig. 9 shows the conversion rate of ethane, the selectivity of ethylene and the yield of ethylene at the operating temperature of 650–750 °C.The calculation formula can refer to the previous report39. The ethane conversion rates of the unimpregnated anode at 650, 700,and 750 °C operating temperatures reach 14.43%, 21.45%, and 32.67%, respectively. The selectivity of ethylene is 98.7%,98.09%, and 94.54%, and the corresponding ethylene yield is 14.24%, 21.04%, and 30.88% (Fig. 9a). Using CeO2impregnated anodes, the ethane conversion at the operating temperature of 650 to 750 °C is 23.89%, 30.78%, and 36.04%,respectively. The selectivity of ethylene is 98.46%, 99.39%, and 94.61%, corresponding to the ethylene yield are 23.52%,30.59%, and 34.09% (Fig. 9b). The addition of CeO2corresponds to a significant increase in the conversion efficiency of hydrocarbon fuels. At 650 °C, both the maximum discharge power and the ethane conversion rate drop significantly,indicating that the anode has a poor catalytic ability for hydrocarbon fuels at 650 °C, and the lower temperature makes the hydrocarbon bond not easy to break and has a higher activation energy. The selectivity at 750 °C is lower than that of the other two lower temperatures, the main reason is that the temperature rises, the carbon-hydrogen bond is more likely to be broken, and the by-products increase, which causes the decreasing of the selectivity of ethylene.
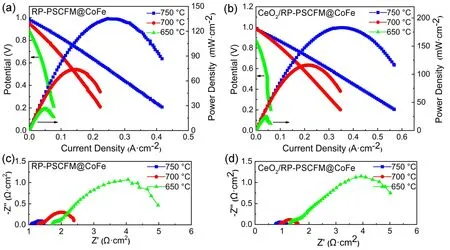
Fig. 8 I–V and I–P curves of the BZCY-supported single cells with the (a) RP-PSCFM@CoFe|BZCY|LSCF/SDC and(b) CeO2/RP-PSCFM@CoFe|BZCY|LSCF/SDC measured from 750 °C to 650 °C in dry ethane; (c) and (d) corresponding to the EIS curves under OCV condition in dry ethane.

Fig. 9 Product analysis of the single cells with (a) RP-PSCFM@CoFe and (b) CeO2/RP-PSCFM@CoFe anode material:ethane conversion, ethylene selectivity, and ethylene yield tested at the corresponding peak current density load vs. temperature.
Fig. 10a compares the discharge curves of the cells before and after anode immersion at 750 °C in H2and C2H6atmospheres.The maximum discharge power density of single cells without immersion in H2reaches 172 mW·cm–2, and the maximum discharge power density of single cells after immersion treatment is 253 mW·cm–2. When using ethane as fuel, the maximum discharge power densities of the two single cells are 135 and 183 mW·cm–2, respectively. Therefore, the composite CeO2anode can simultaneously improve the electrochemical performance of the single cell under hydrogen and ethane conditions. The typical peak power density obtained with C2H6as fuel is slightly lower than that obtained with H2as fuel,indicating that the oxidation kinetics in ethane atmosphere is slower than that of hydrogen.

Fig. 10 (a) Influence of adding CeO2 in anode on I–V curves and corresponding I–P curves of the cell in H2 and C2H6; (b) long-term stability test of CeO2/RP-PSCFM@CoFe and RP-PSCFM@CoFe anode materials under a constant voltage load of 0.6 V at 750 °C in dry ethane; the flow rate of ethane is 30 mL·min−1, and the cathode is exposed to air.
In order to compare the stability of the CeO2impregnated SOFCs cell under ethane atmosphere, the electrodes with and without CeO2impregnating are selected for stability testing at a working temperature of 750 °C, using the constant voltage about 0.6 V, and the result is shown in Fig. 10b. During the 10 h of operation, the current density of the single cell without CeO2impregnating displays no obvious deteriorating, suggesting that the PSCFM electrode has a good stability in operation in ethane.Furthermore, in the SOFC impregnated with CeO2, the current gradually increases during operation, indicating that the impregnation is effective in improving the performance of the cell. The reason for the increased current may be because that CeO2adheres to the surface of the porous anode. On the one hand, owing to its high temperature resistance, it ensures the ion transport channel when the cell is working. On the other hand,CeO2is also easily reduced in a reducing atmosphere to form some Ce(IV)-Ce(III) redox coupling pairs. As the reaction progresses, the coupling pairs gradually increase, and have a lower polarization overpotential at medium temperature, which promotes the increase of current. At the same time, the characteristics of high ionic conductivity and outstanding oxygen ion transport capacity accelerate the ion transfer rate inside the anode and improve the electrochemical reaction rate of the anode. In addition, the attached CeO2particles also effectively expand the anode three-phase reaction interface and increase the active area of the reaction.
4 Conclusions
CeO2/RP-PSCFM@CoFe anode material is obtained byin situreduction method in a hydrogen atmosphere. The anode exhibits excellent ethane dehydrogenation activity and stability when used in proton conductive fuel cells. The impregnation of CeO2could significantly improve the yield of value-added ethylene. The single fuel cells after anode immersion reach a peak power density of 253 mW·cm–2in H2and a peak power density of 183 mW·cm–2in C2H6at 750 °C. In addition, the fuel cells demonstrate more stable power output than that of the fuel cell without immersion of CeO2in the 10 h test due to the promoting effect on the anode’s catalytic activity and coke resistance of CeO2. The ethane conversion reaches 36.04% and the ethylene yield reaches 34.09% at 750 °C for the fuel cells.
