Influence of temperature and alloying elements on the threshold displacement energies in concentrated Ni–Fe–Cr alloys*
2021-05-24ShijunZhao赵仕俊
Shijun Zhao(赵仕俊)
Department of Mechanical Engineering,City University of Hong Kong,Hong Kong,China
Keywords: irradiation effects, molecular dynamics, threshold displacement energies, concentrated highentropy alloys
1. Introduction
Concentrated solid-solution alloys (CSAs), including high-entropy alloys (HEAs), have expanded the alloy design strategy significantly in recent years.[1,2]Composed of multiple principal elements in a simple crystal structure, CSAs exhibit intrinsic chemical disorder that significantly affects their properties. Depending on the composition, CSAs have demonstrated excellent mechanical properties[3,4]and promising irradiation resistance,[5–8]making them promising candidate structural materials for future nuclear applications. As a result,lots of efforts have been put into identifying the mechanism behind the irradiation performance of CSAs,specifically,the role of different alloying elements in influencing their irradiation response.[6,9,10]
Based on irradiation damage theory,[11]defect evolution is governed by defect production, defect recombination, and defect absorption by possible defect sinks. For single-phase CSAs, the role of defect sinks is minimized since no extra sinks,such as phase boundaries or interfaces,are present. Previous results have demonstrated interesting defect diffusion and defect recombination properties in CSAs depending on alloying elements. For example, diffusion of interstitial defects becomes slower in CSAs, which tends to delay defect evolution as observed in experiments.[12]Defect recombination probability can be enhanced considerably in CSAs due to the favorable binding of interstitial defects.[13]These results suggest the unique irradiation resistance mechanism in CSAs. Nevertheless,defect production properties,specifically the threshold displacement energies(Ed), are less understood in different CSAs.
The value of Edis a critical parameter to measure the irradiation damage of materials;it can be used to estimate the displacement per atom(dpa)based on the Kinchin–Pease model and its derivative models.[14–16]Edis usually defined as the minimum energy required to displace lattice atoms from their original lattice sites. Previous studies have revealed that Edvalues in crystalline materials are highly anisotropic. Therefore, the Edvalue in a material is usually an average value from all crystallographic directions. In metallic systems, it is known that ballistic collisions may generate a large number of defects followed by a strong defect recombination phase due to their good recrystallization abilities.[6]
The values of Edhave been studied in pure metals such as Ni and Fe, as well as in dilute alloys, both from experiments and simulations.[17–21]However,the properties of Edvalues in CSAs are seldom studied in previous works. Due to the chemically disordered states in CSAs, simulations based on firstprinciples methods are extremely costly as many PKAs should be sampled, and many crystallographic directions need to be simulated. The previous attempt has studied only in either ordered alloys[22]or selective directions[23]to gain insights into the Edvalues in CSAs. To reveal the angular dependence and the average values of Ed,one has to resort to molecular dynamics (MD) simulation, which is a widely adopted technique to study the nature of Edvalues in materials.[24–26]Nevertheless,the details of the empirical potential will undoubtfully have decisive influences on Edvalues. In previous MD studies on Edvalues in Ni,the Edvalues were usually presented from one type of potential,and no comparisons among different potentials were made.[20,21]A comparative study with several different potentials is,therefore,beneficial to gain complete insight into the properties of Edvalues.
In this work, we study the properties of Edvalues and their relationship with the primary damage in several facecentered cubic (FCC) Ni-containing CSAs by means of MD simulations. Several different empirical potentials are considered. Our results show that the differences in interatomic interactions at the intermediated range(1–2 ˚A)result in different Edvalues for different potentials. Based on the potentials,we further calculate the Edvalues in different CSAs at different temperatures. Finally, we study the properties of primary damage in these CSAs, and their correlations with Edvalues are discussed.
2. Metho d
MD simulations were performed using the LAMMPS software package.[27]The interatomic interactions were described with the embedded atom model (EAM)[28]potentials parametrized by Bonny et al.[29–31]Three EAM potentials were considered, denoted by Bonny2009, Bonny2011, and Bonny2013, respectively. Note that the short-range repulsive ZBL potential has been included in the original Bonny2013 potential,which is essential for cascade simulations.The original Bonny2011 has no ZBL interactions at short distances.A spline fitting to ZBL at a short distance has been made previously,[32]with the transition region fitting to ab initio data. This modified version of Bonny2011 potential was used in this study.
To calculate the Edvalues in different alloys, we randomly chose an atom as the primary knock-on atom(PKA)in a pre-equilibrated 20×20×20 FCC supercell. The PKA was then given an amount of kinetic energy to simulate the lowenergy recoil events. A variable timestep scheme was used together with an NVE ensemble, and the border region was temperature-controlled by a thermostat. The total simulation time is around 6 ps, which is proved to be long enough to allow possible defect recombination. The PKA energy was increased with a step of 2 eV until a stable Frenkel defect pair detected by the Wigner–Seitz defect analysis was created. The Edvalue was then determined by the minimum PKA energy that leaded to stable defect creation.
At 0 K, we determined the Edvalue by monitoring whether or not a Frenkel defect was created. In this case, we initiated the simulation directly in a perfect FCC lattice. At finite temperatures,the defect creation probability is no longer a step function due to thermal fluctuations. Therefore, defect production probability is simulated for a range of PKA energies. We first equilibrated the system at a given temperature(300 K, 600 K, and 900 K) for 100 ps and then initiated the PKA. At each energy, at least 400 independent simulations initiated by randomly chosen PKA and recoil direction were simulated. The defect production probability was then calculated from these calculations.
The primary damage at higher PKA energies was simulated in larger supercells (40×40×40 for energies below 10 keV, and 80×80×80 for energies higher than 10 keV).The temperature of boundary layers was controlled at 300 K by a thermostat. A total of 20 independent simulations were performed,and the results were averaged.
3. Result
3.1. Angular dependence of Ed values in FCC Ni
We first present the Edvalues in FCC Ni,since there are available experimental and ab initio data for comparisons. For concentrated disordered alloys, it is difficult to compare the results from different empirical potentials owing to the disordered nature. The angular dependence of Edvalues in FCC Ni calculated for three empirical potentials is provided in Fig.1.As we employ an energy increment of 2 eV to determine the Edvalues, the uncertainty on the data in Fig.1 is±1 eV.For high-symmetric directions,different features are observed for different potentials. Based on Bonny2013 and Bonny2009 potentials, it is shown that Edvalues along the [100] and [110]directions are low,whereas Edvalues are high along the[111]direction. In the non-symmetric directions,there are peaks between[100],[110],and[111]directions. A similar trend was also found in other FCC metals, such as Cu,[33]though the magnitude is different. The high Edvalues can be interpreted by the fact that a PKA along high-index directions tends to induce scattered collision regions,which helps to dissipate energy effectively. As a result, higher energies are required to create stable defects. The behavior is quite different for the revised Bonny2011 potential,particularly along the[110]and[111]directions. Specifically,the revised Bonny2011 predicts a peak along the [110] direction and low Edvalues along the[111]direction,comparing to the other two potentials.
Comparison among the three empirical potentials indicates that Bonny2013 generally results in higher Edvalues in pure Ni,then the Bonny2009,finally the modified Bonny2011 potential. It is surprising that the differences in Edvalues for Bonny2013 and modified Bonny2011 potentials are as high as 20 eV, though both potentials have included the short-range repulsive ZBL potential. To further evaluate the performance of these three potentials at short interatomic distances, we plot the potential energy between two Ni atoms at distances smaller than 2.5 ˚A, as shown in Fig. 2. It can be seen that both Bonny2013 and Bonny2011 coincide with the ZBL potential for short distances less than 0.7 ˚A.In the intermediate distance (0.7–2 ˚A), Bonny2013 and Bonny2011 behave very differently. The revised Bonny2011 gives rise to much softer interactions than Bonny2013. In this region,the potential energy for Bonny2009 locates just between that of Bonny2011 and Bonny2013. These results suggest that the short-range repulsive ZBL interactions at a shorter distance (less than 1 ˚A)have minor effects on Edvalues. Instead, the interactions in the intermediate range play dominant roles in determining Edvalues for FCC Ni. This observation is consistent with the findings in body-centered cubic (BCC) Fe, where Edvalues are sensitive to the repulsive potential only at an intermediate distance(1.4–2 ˚A).[24,34]An analysis into the closest interatomic distances in Edcalculations indicates that the minimum distance is around 1.48–1.65 ˚A in FCC Ni,suggesting that the potential characteristics at this range have the most influences on Edvalues.
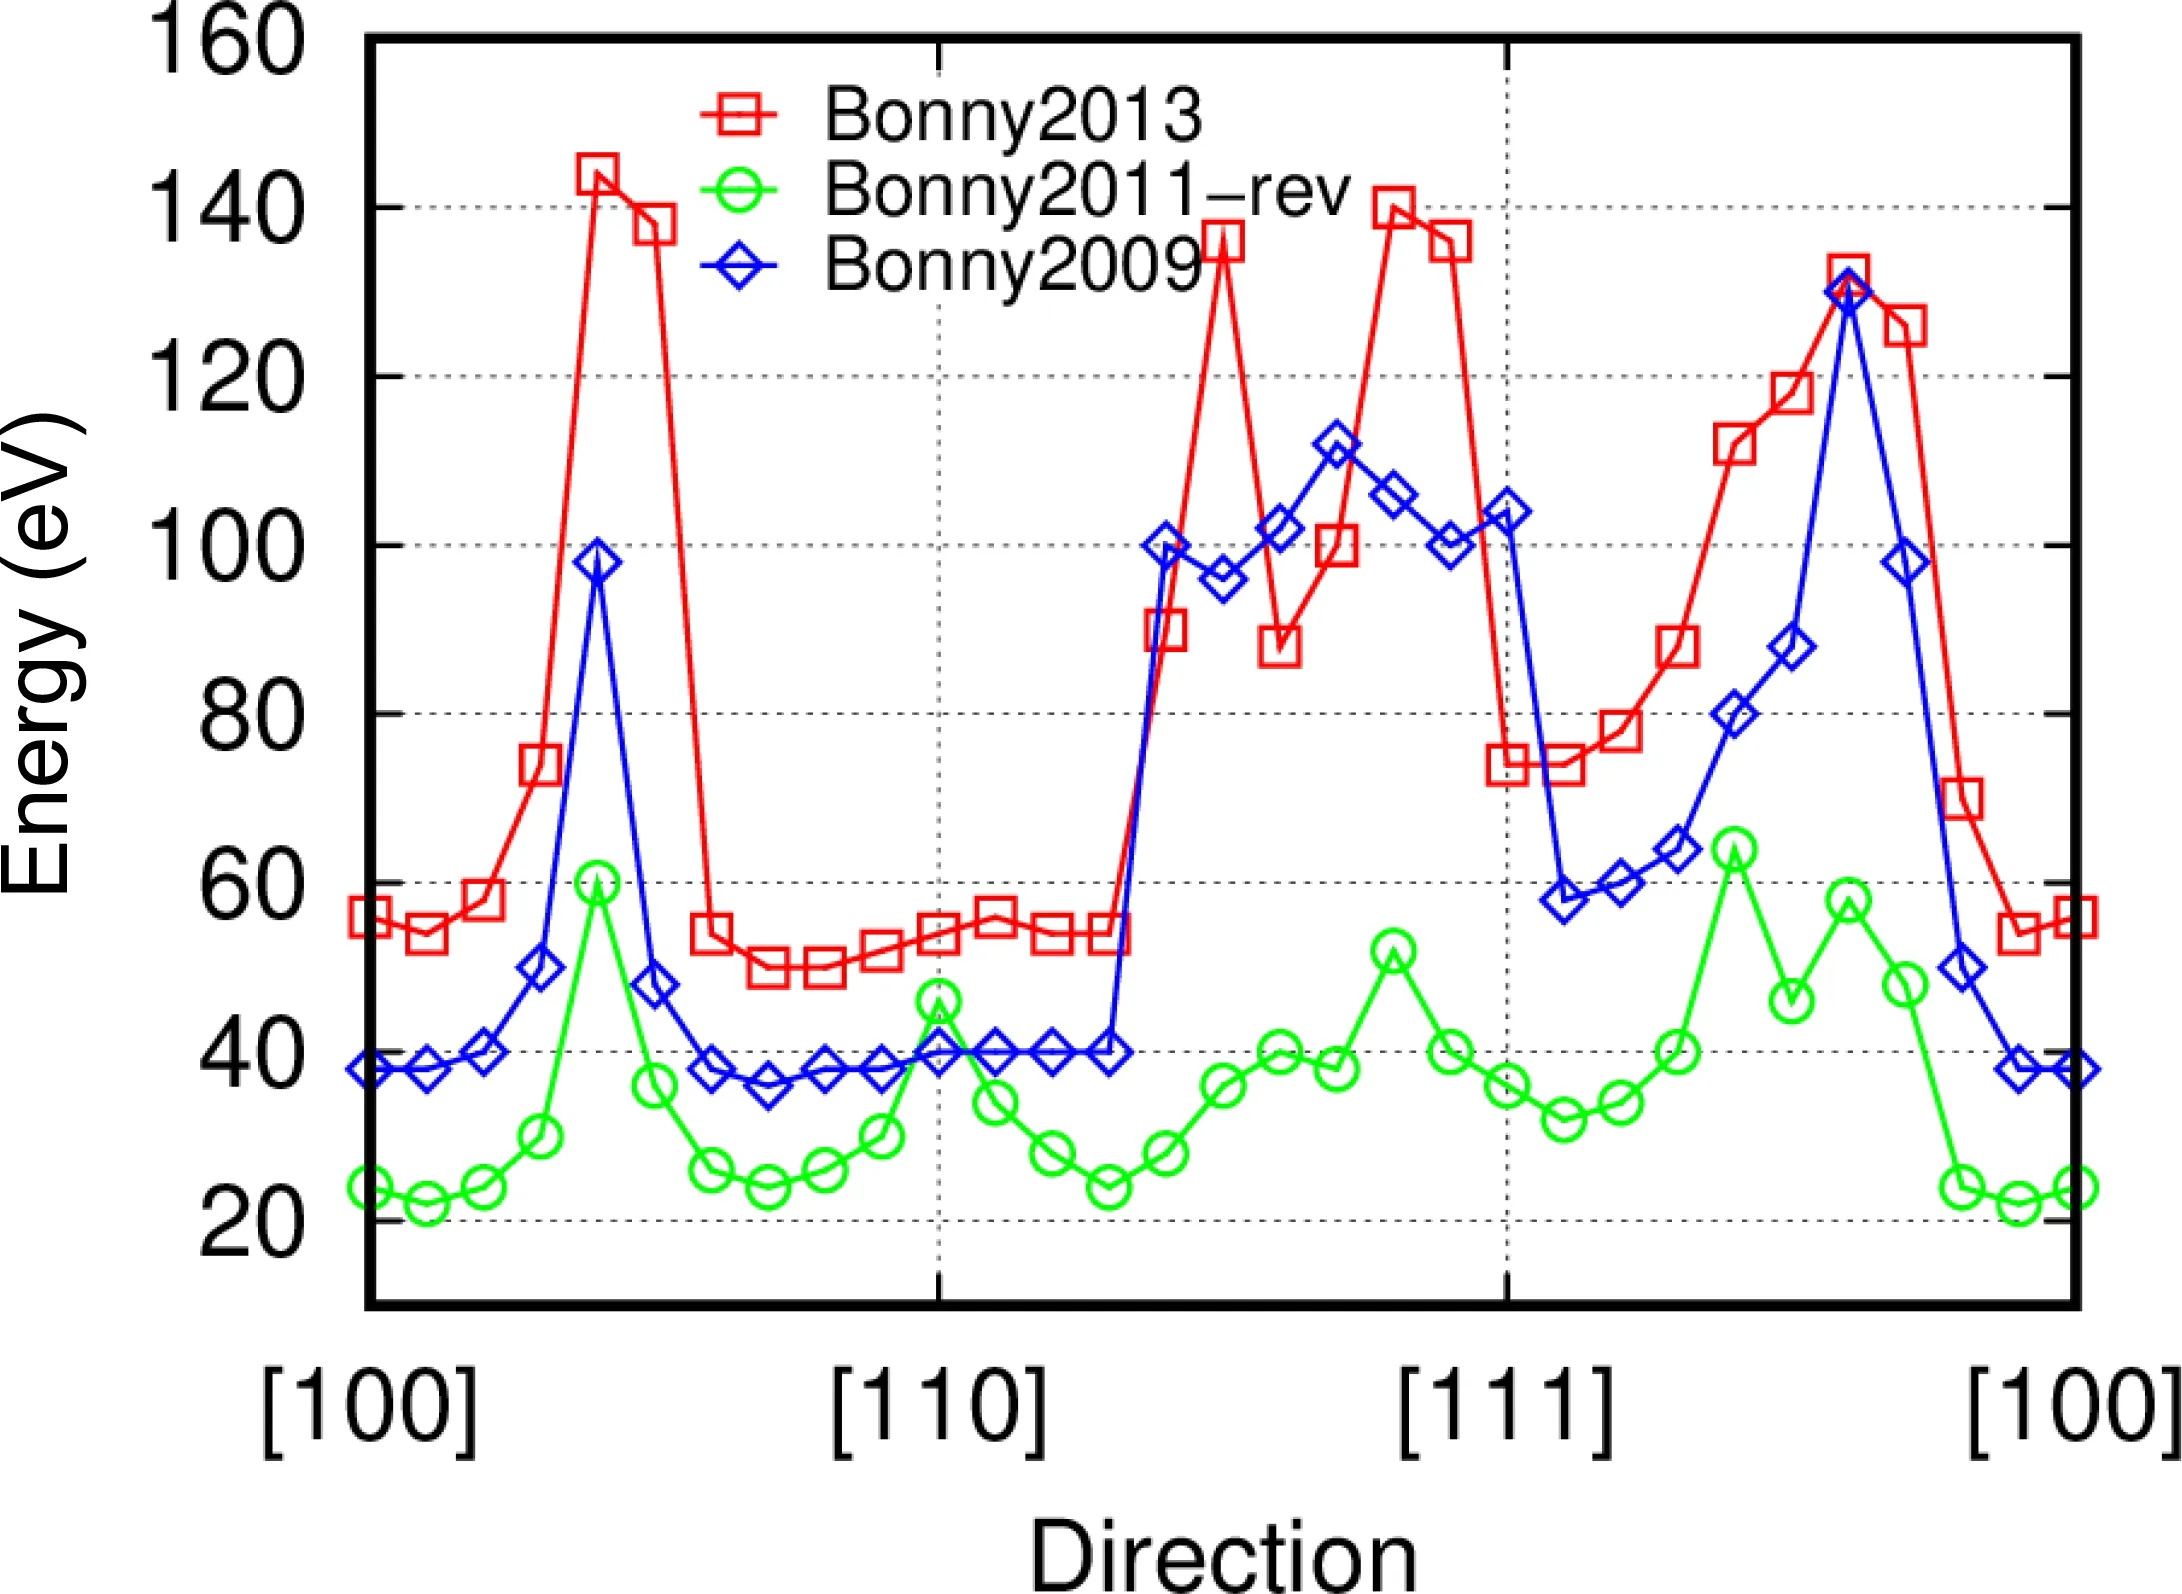
Fig. 1. Angular dependence of Ed values in pure Ni at 0 K calculated based on three different empirical potentials: the original Bonny2009,[30] the modified Bonny2011,[31,32] and the original Bonny2013[29] potentials. The uncertainty on the data is±1 eV,since we use an energy increment of 2 eV to determine the Ed values.

Fig. 2. The variation of potential energy along with the interatomic distance for two Ni atoms based on different empirical potentials. The results for the ZBL potential are also included.
Besides the pair part,we have compared the density function and embedding function of the three potentials.Except for the Bonny2009 potential, both density functions in the modified Bonny2011 and Bonny2013 potential are constant at short distances less than ~1.5 ˚A. For Bonny2009, the density just goes up with decreasing distance, which in part compensates for the absence of short-range ZBL interactions. Therefore,the main differences in revised Bonny2011 and Bonny2013 will be in the pair part.
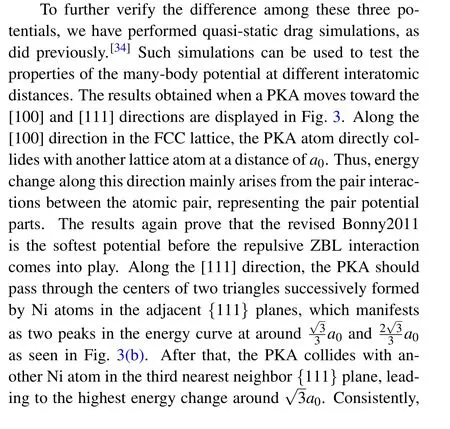

Fig.3. Energy change when a PKA moves toward(a)[100]and(b)[111]directions in a rigid lattice. All other atoms are fixed in the simulation.

A comparison of the calculated Edvalues with previous data in Ni is summarized in Table 1. The reported Edvalues in Ni from the low-temperature electron irradiation experiments are 38 eV, 21 eV, >60 eV along the [100],[110],and[111]directions,respectively.[35]The averaged values from the whole angular dependence are 23–24 eV based on different experiments.[18,36]DFT results along these three high-symmetric directions are consistent with the experimental values.[22,23]Our results based on the Bonny2013 potentials are 56 eV, 54 eV, and 74 eV for the [100], [110], and[111] directions, respectively, all higher than the experimental values. The results for the modified Bonny2011 are much smaller,i.e.,24 eV,46 eV,and 36 eV,respectively.The data for the Bonny2009 potential are in the middle,i.e.,38 eV,40 eV,and 104 eV,respectively.Compared to the experiments,the results for the Bonny2013 correctly reproduce the relative trend in these three directions, with the highest Edvalue found in[111], and then [100], and finally [110]. A similar trend is also observed for the Bonny2009 potential. Nevertheless,the modified Bonny2011 results in a high Edvalue along the[110]direction,in contrast to the other two potentials.
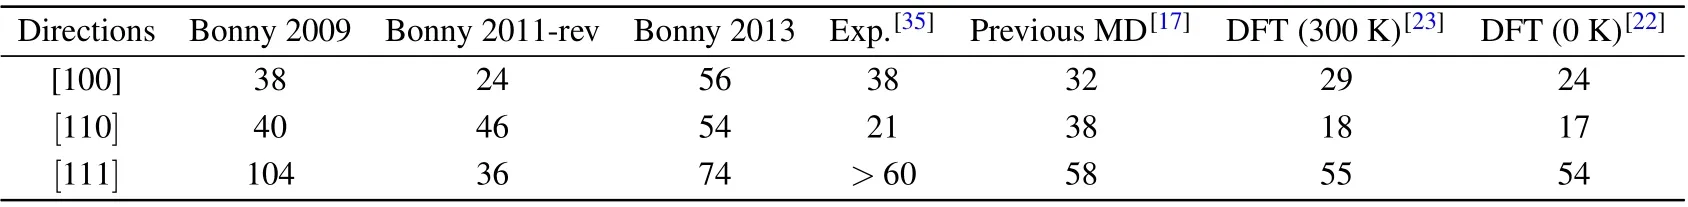
Table 1. Comparison of threshold energies in Ni(in eV).
It is worth pointing out that the interactions in the revised Bonny2011 were fitted to ab initio data in the intermediate distance(1–2 ˚A),[32]suggesting its high precision in this transition region.The Edvalue along the[100]direction is in good agreement with DFT calculations. Yet, this potential yields a peak along the[110]direction in the angular dependence of Edvalues. As a result,the Edvalue in[110]is the highest,which is inconsistent with experiments. Along the [111] direction,we find a lower Edvalue based on the revised Bonny2011 potential compared to DFT.As the PKA moves from its original location,it creates an interstitial,leaving behind a vacancy. If the PKA energy is small, the interstitial would go back and recombine with the vacancy,and no defect production occurs.Therefore,the magnitude of Edvalues is related to this recombination process.[23]We calculate the recombination barrier and find a relatively high height(0.37 eV).Therefore,the displaced PKA, which becomes an interstitial, tends to migrate in the lattice with migration energy of 0.33 eV. The original Bonny2009 does not include short-range repulsive interactions, as demonstrated in Fig. 2. In a previous study, the repulsive ZBL potential has been connected to this potential in order to perform irradiation damage simulations.[37]Based on the modified potential, the reported Edvalues are 34 eV,32 eV,and 48 eV along the[100],[110],and[111]directions,respectively, with a much higher, averaged value of 72.3 eV from different directions. Similar to the Bonny2013 potential,this potential still overestimates Edvalues significantly. In addition,the defect energies resulting from this potential are not consistent with ab initio data in concentrated Ni–Fe alloys.[38]It was suggested that a better fit could not be achieved without changing the equilibrium part of the potential.
Based on the above considerations, we choose the modified Bonny2011 and Bonny2013 potentials in the following to study alloying effects on Edvalues in different CSAs. Previous studies have compared different defect properties predicted by these two potentials.[8,38]Briefly, the most striking difference is that the Bonny2011 potential predicts separated distributions for defect formation and migration energies of Ni and Fe in the Ni–Fe alloys, whereas the energy distributions are mixed in Bonny2013 potential. This observation suggests that chemically-biased diffusion is more pronounced for Bonny2011 potential, which is consistent with ab initio data.[39]This chemically-biased diffusion is the main reason responsible for the enhanced defect recombination in these alloys.[13]To further compare the differences between Bonny2011-rev and Bonny2013 potentials,we show in Table 2 the basic properties for considered CSAs calculated for these two potentials. Generally, these two potentials yield similar bulk modulus (B) and melting temperatures (Tm) for alloys.Therefore, the differences in defect properties are the main distinction between these two potentials besides the Edvalues.
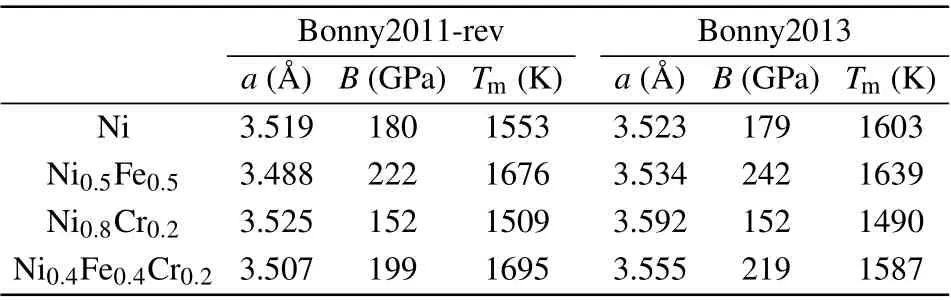
Table 2. Calculated lattice constant(a),bulk modulus(B),and melting temperature(Tm)for the Bonny2011-rev and Bonny2013 potentials.
3.2. The Ed values in CSAs
For CSAs, different elemental species are randomly distributed in the lattice. It is challenging to obtain averaged Edvalues, especially at finite temperatures, since the chemical disorder and thermal fluctuation both can induce changes to the Edvalues for a given PKA atom at a given direction.Therefore,we calculate the defect production probability as a function of PKA energy in this case. The PKA type and direction are chosen randomly, and a total of 400 calculations are performed for each PKA energy. The calculated results in different CSAs are shown in Fig. 4. Here the results from both the modified Bonny2011 and Bonny2013 potentials are presented.

Fig.4. Defect production probability in different CSAs as a function of the PKA energy at 300 K.
There are several different definitions of Edvalues in the literature.[24]Here we adopt the definition,which is the minimum energy transferred to a lattice atom resulting in the creation of a stable Frenkel defect. This definition is most related to radiation damage, since it leads to stable defect creation.Besides,this definition is in accordance with the experimental measurement of Edvalues where the lowest incident electron energy leading to a defect signal is detected. Based on the results from Fig. 4(a), it is suggested that the minimal energies required to create stable Frenkel defects in these alloys are around 20 eV based on the modified Bonny2011 potential. This result is consistent with the minimum Edvalues shown in Fig. 1 for this potential. No significant differences are observed for different CSAs,except for Ni0.8Cr0.2,where a slightly lower Edis found. For the Bonny2013 potential,the minimal energy required to create stable Frenkel defects is around 50 eV. For this potential, slightly higher Edvalues are observed in Ni0.5Fe0.5and Ni0.4Fe0.4Cr0.2, whereas a somewhat lower Edvalue is found in Ni0.8Cr0.2. Both potentials predict that Ni0.8Cr0.2exhibits a lower Edvalue and a higher defect production probability at 50 eV to 100 eV.At this energy range, the defect production probability is the lowest in Ni0.5Fe0.5for the modified Bonny2011 potential, whereas Ni0.4Fe0.4Cr0.2has the lowest probability for the Bonny2013 potential. At PKA energies higher than 100 eV,the defect production probability shows a dip for the Bonny2013 potential,leading to a generally low defect probability than that for the modified Bonny2011 potential. The difference indicates different defect recombination properties for these two potentials.To complement the discussion,we have provided the repulsive part of Ni–Fe and Ni–Cr interactions for the Bonny2011-rev and Bonny2013 potentials, as shown in Fig. 5. The results suggest that Bonny2011-rev consistently leads to softer interactions compared to Bonny2013. This trend is similar to Ni–Ni interactions. Therefore, in the alloys, lower Edvalues are observed for the Bonny2011-rev potential.

Fig.5. The pair potential part at small distances for Ni–Fe and Ni–Cr based on the Bonny2013 and Bonny2011-rev potentials.
This plateauing behavior in the defect production probability is also observed in Fe.[24]This is caused by the competing effects of defect recombination and defect production.On the one hand,PKA introduces excess heat into the system,facilitating defect diffusion and defect recombination. On the other hand, defect production increases with increasing PKA energies. Along with the increasing PKA energy, the defect production probability increases slowly.
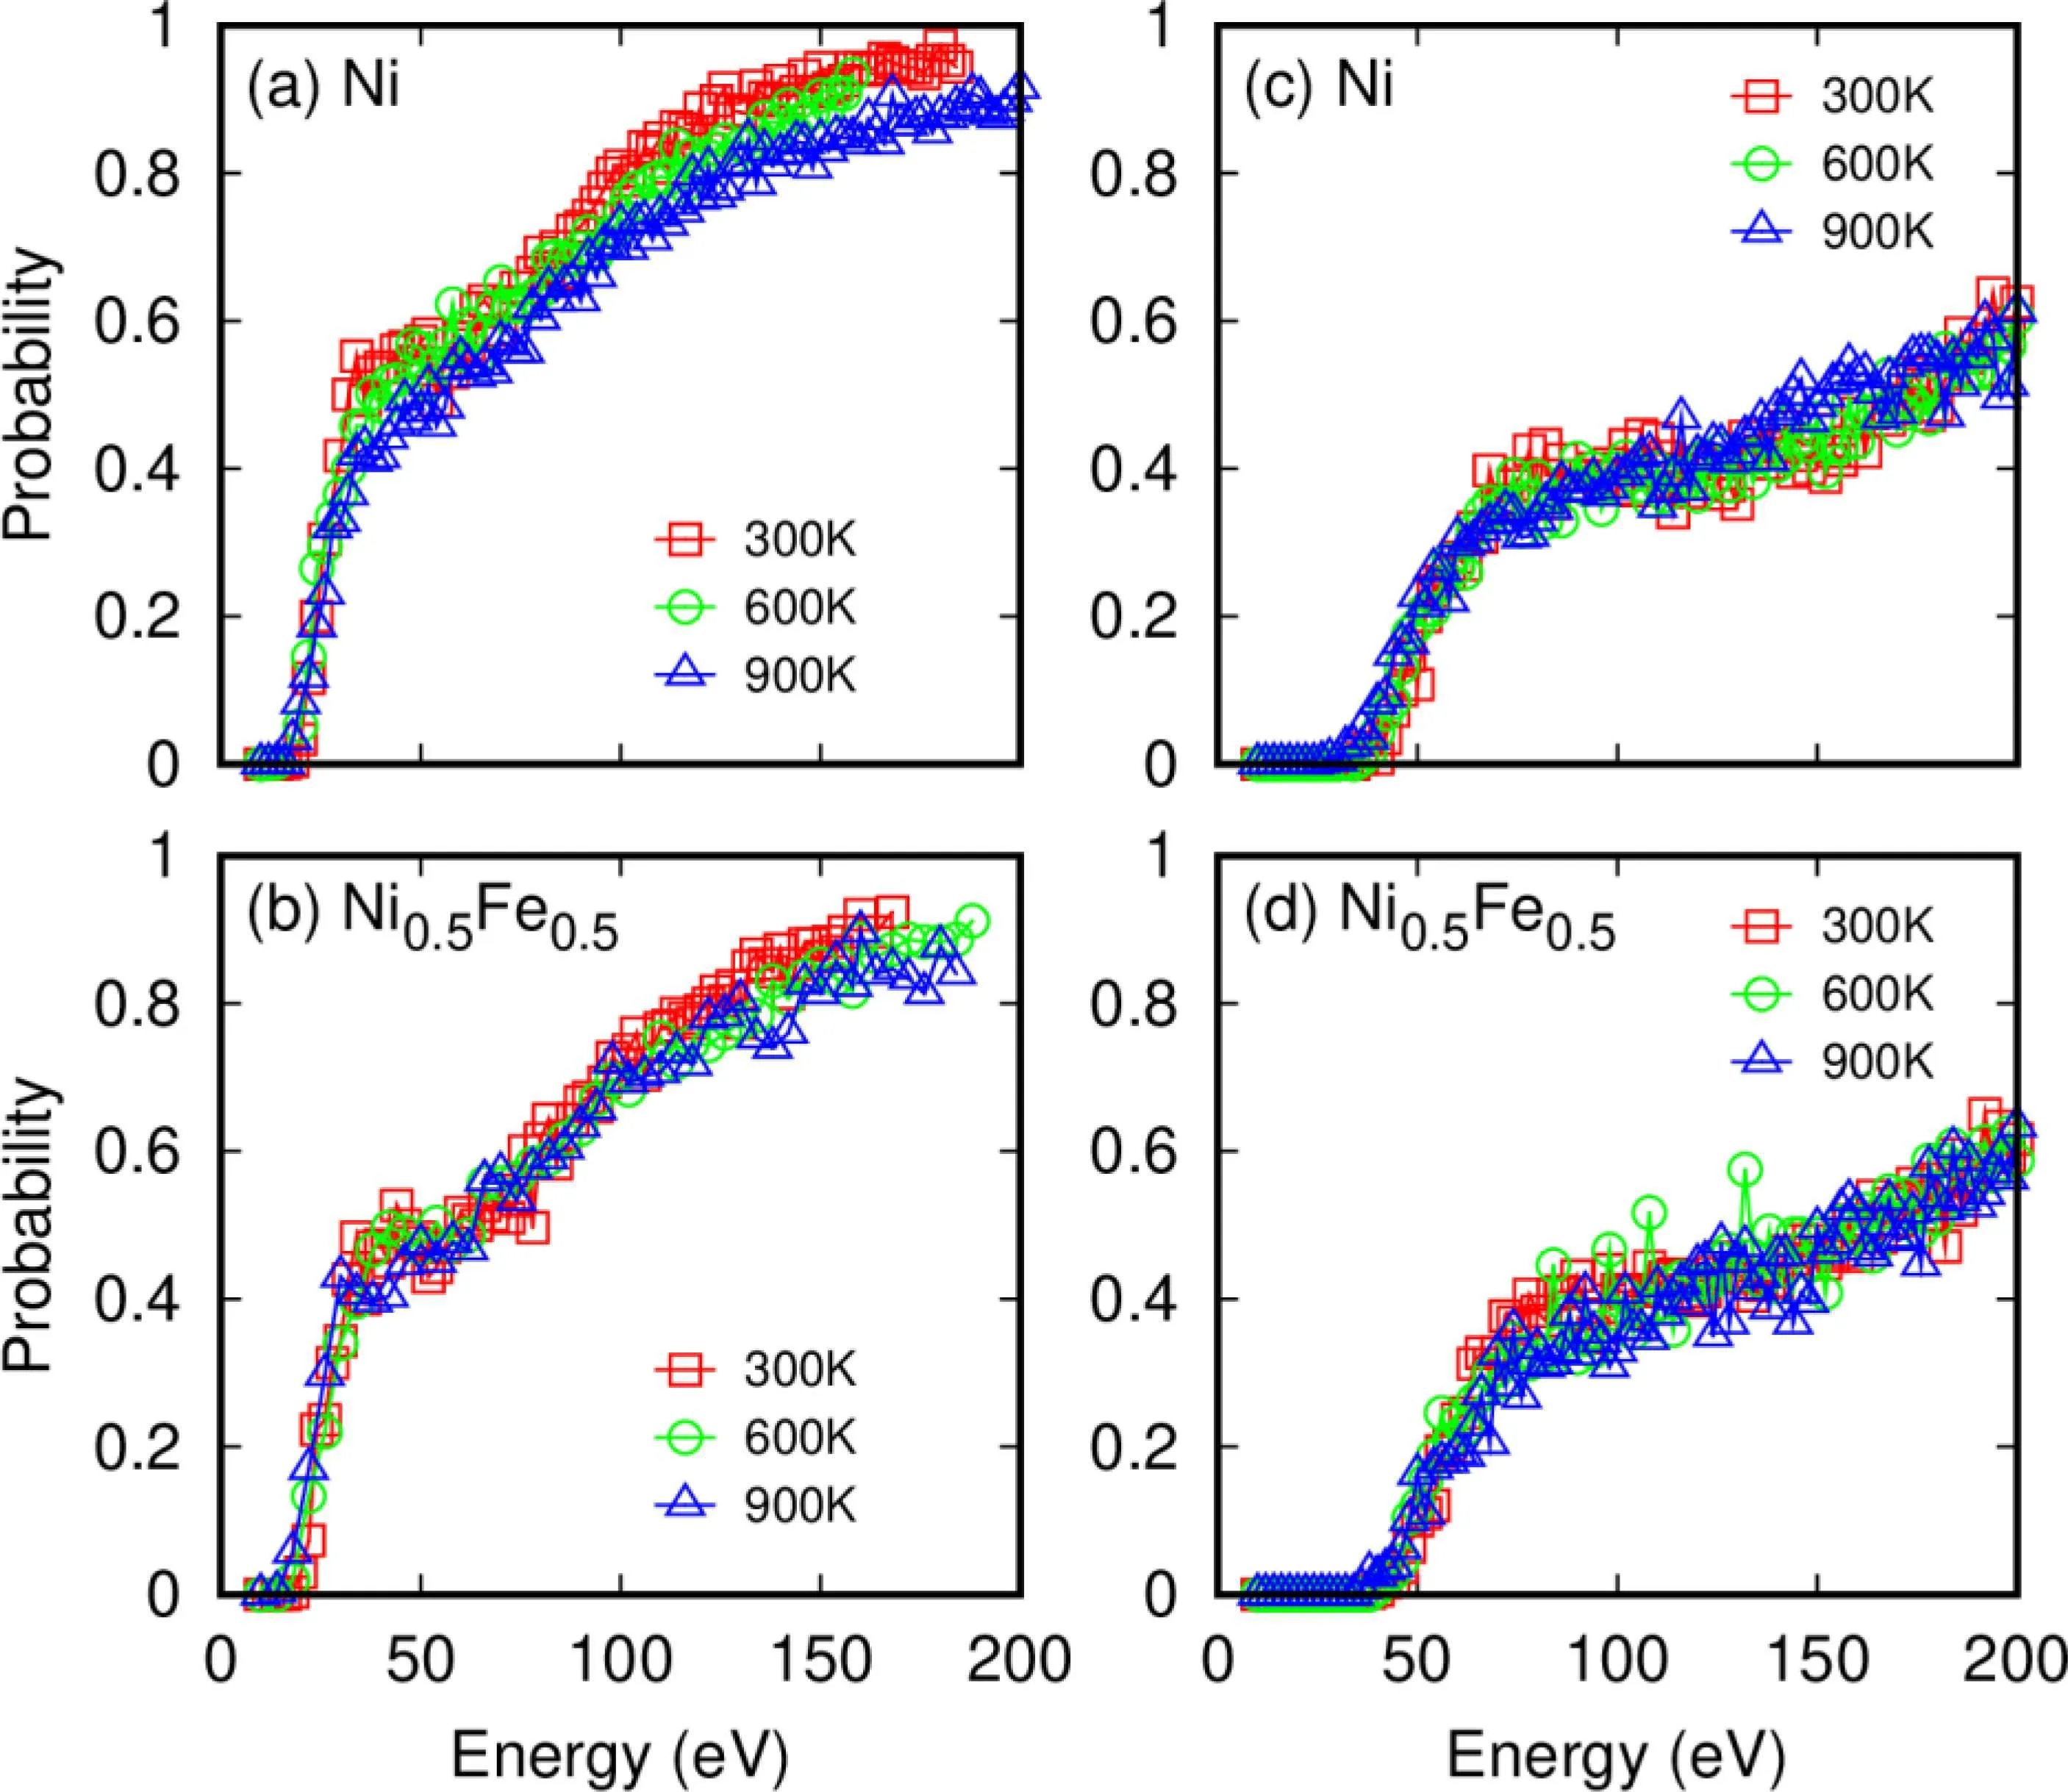
Fig.6. Defect production probability in Ni((a)and(c))and Ni0.5Fe0.5 ((b)and(d))as a function of PKA energy at different temperatures,as calculated by the modified Bonny2011(left column)and Bonny2013 potential(right column).
The effects of temperature on the defect production probability are evaluated in Ni and Ni0.5Fe0.5,as provided in Fig.6,for both potentials. In these simulations, the system is first equilibrated at the given temperature, and then the cascade simulation is initiated by assigning kinetic energies to the randomly chosen PKA. The boundary layer is thermostat at the desired temperatures. The results displayed in Fig. 6 suggest that temperature only has minor influences on the defect production in Ni and Ni0.5Fe0.5, for both potentials. Regarding the Edvalues, figure 6 indicates that increasing temperature could lead to lower Edvalues,presumably due to the thermal fluctuations. Nevertheless, the change is rather small, i.e., 2–3 eV when temperature increases from 300 K to 900 K.Note that the formation energy of interstitial dumbbells based on the Bonny2011 potential is generally 2 eV lower that from Bonny2013 potential. Besides, migration barriers of interstitials from Bonny2011 potential are almost 2 times higher.As a result, the Frenkel defects are relatively easy to form in Bonny2011 case, leading to the higher defect creation probability above Ed.
The temperature dependence of Edvalues has been studied in other materials, such as Fe[26]and TiO2.[25]In TiO2,the Edvalues of Ti keep constant,whereas those of O increase with increasing temperature. In Fe, a decrease of the lower Edbound was found. Therefore, our results in Ni and Ni–Fe alloys are consistent with previous results in Fe.
3.3. Primary damage in CSAs
To further elucidate the relationship between the Edvalues and the primary damage state in different CSAs,we have performed single cascade simulations in these alloys. The number of produced stable Frenkel defects is calculated. As a first step, we show in Fig. 7 the defect creation process for one 10 keV simulation as a function of simulation time. It can be seen that the defect number increases violently at the initial stage of the cascade, exhibiting a peak in the damage process. Based on the modified Bonny2011 potential,the defect number at the peak-time is the highest in Ni, followed by Ni0.4Fe0.4Cr0.2, Ni0.8Cr0.2, and Ni0.5Fe0.5. The relaxation time of the defect is around 5 ps,after which the defect number becomes constant. For the Bonny2013 potential, the defect number at peak-time is higher in CSAs than in pure Ni,and the relaxation time is shorter, i.e., 4 ps, than that observed in the modified Bonny2011 potential. It has previously claimed that the behavior of defect evolution relates to the stiffness of the empirical potentials.[34,40,41]The modified Bonny2011 potential is softer than Bonny2013 potential, as shown in Fig.2 in the intermediate region. Based on previous knowledge gained in pure Fe,the softer Bonny2011 potential would lead to greater peak damage and longer relaxation time for recombination, which is consistent with present results in Ni and its alloys.
The stable defect number averaged from 20 independent simulations by randomly choosing different PKAs are presented in Fig. 8, together with the statistic standard error of the mean. Generally,the defect number predicted by the modified Bonny2011 potential is higher than that of Bonny2013.Based on the standard NRT damage model,[15]the surviving defect number is inversely proportional to the Edvalues.Our results show that the Edvalues are lower in the modified Bonny2011 potential,which should create a higher defect number. In previous studies on the primary damage in different alloys, the effects of the stiffness of the potential on the produced defect number have been discussed.[21,32,42]However,previous works did not discuss the role of Edvalues.

Fig. 7. Defect production process as a function of time for a 5 keV cascade in different CSAs.

Fig.8. Calculated Frenkel defect number produced by a single cascade in different CSAs at 300 K.The PKA is randomly chosen in the system to initiate the cascade collisions.
Comparison among different CSAs,the defect number is almost the same at low PKA energies, an indication of their similar Edvalues. At high PKA energies,subcascade starts to play essential roles, and differences are observed in different CSAs. At PKA energies of 20 keV and 40 keV,Ni0.5Fe0.5and Ni0.4Fe0.4Cr0.2exhibit the lowest defect number for both potentials. The discrepancy is found in Ni0.8Cr0.2between these two potentials. While the modified Bonny2011 predicts only a slight variation of stable defect number,the Bonny2013 potential yields a strong alloying effect in decreasing defect number in Ni0.8Cr0.2compared to Ni at high energies. This feature is also observed in a previous study.[32]Since the Edvalues are similar in these CSAs,our results indicate that the stable defect production at low PKA energies can be understood by the Edvalues,while damage induced by higher energies(>10 keV)is not directly related to the Edvalues. At these high energies, there are several other factors also contributing to the final defect number,including subcascade distribution,defect migration,defect recombination,etc. For high-energy irradiation experiments where the incident energy is around MeV,the difference will contribute to different defect evolution at the initial stage. However, in the subcascades regime, the difference regarding defect production among different CSAs would be negligible due to the similar Edvalues and similar spatial distribution of subcascades.[43]
4. Conclusion
In this work,we have employed MD simulations to study the Edvalues and their relation to the primary damage in FCC Ni and several Ni-containing CSAs.The effects of alloying elements and temperature are analyzed. Our results indicate that the predicted Edvalues relate closely to the stiffness of the empirical potential in the intermediate region within 1–2 ˚A.However,even for the revised Bonny2011 potential where the interatomic energies are fitted to ab initio data, the resulting Edvalues still show some discrepancy with experimental data.Based on the two different potentials, we show that different alloying elements and temperatures only have minor effects on Edvalues in CSAs, which is consistent with the similar defect number produced in a single cascade at low PKA energies. Nevertheless, when the PKA energy increases, the primary damage in different CSAs changes significantly,suggesting different defect migration and recombination properties in CSAs as predicted by the empirical potential.
Specifically, this work provides a thorough study on the Edvalues in concentrated alloys,including how different empirical potential fitting may affect their values,angular dependence,temperature dependence,and effects on primary defect production.
杂志排行
Chinese Physics B的其它文章
- Corrosion behavior of high-level waste container materials Ti and Ti–Pd alloy under long-term gamma irradiation in Beishan groundwater*
- Degradation of β-Ga2O3 Schottky barrier diode under swift heavy ion irradiation*
- Cathodic shift of onset potential on TiO2 nanorod arrays with significantly enhanced visible light photoactivity via nitrogen/cobalt co-implantation*
- Review on ionization and quenching mechanisms of Trichel pulse*
- Thermally induced band hybridization in bilayer-bilayer MoS2/WS2 heterostructure∗
- Universal memory based on phase-change materials: From phase-change random access memory to optoelectronic hybrid storage*