Turbulent boundary layer control with a spanwise array of DBD plasma actuators
2021-02-27YueqiangLI李跃强ChaoGAO高超BinWU武斌
Yueqiang LI (李跃强), Chao GAO (高超), Bin WU (武斌),
Yushuai WANG (王玉帅), Haibo ZHENG (郑海波), Ming XUE (薛明) and Yuling WANG (王玉玲)
School of Aeronautics,Northwestern Polytechnical University,Xi’an 710072,People’s Republic of China
Abstract The turbulent boundary layer control on NACA 0012 airfoil with Mach number ranging from 0.3 to 0.5 by a spanwise array of dielectric barrier discharge (DBD) plasma actuators by hot-film sensor technology is investigated.Due to temperature change mainly caused through heat produced along with plasma will lead to measurement error of shear stress measured by hot-film sensor,the correction method that takes account of the change measured by another sensor is used and works well.In order to achieve the value of shear stress change, we combine computational fluid dynamics computation with experiment to calibrate the hot-film sensor.To test the stability of the hot-film sensor, seven repeated measurements of shear stress at Ma = 0.3 are conducted and show that confidence interval of hot-film sensor measurement is from −0.18 to 0.18 Pa and the root mean square is 0.11 Pa giving a relative error 0.5%over all Mach numbers in this experiment.The research on the turbulent boundary layer control with DBD plasma actuators demonstrates that the control makes shear stress increase by about 6%over the three Mach numbers,which is thought to be reliable through comparing it with the relative error 0.5%, and the value is hardly affected by burst frequency and excitation voltage.
Keywords: turbulent boundary layer control, DBD plasma actuators, hot-film sensor
1.Introduction
Dielectric barrier discharge(DBD)plasma[1–3]flow control method, as one of the plasma-assisted flow control technology, is widely used in aviation industry such as flow separation control [4], anti-icing [5] and other fields.One of the most promising application is turbulent boundary layer control which has been researched for almost 20 years[6–10].Considering that the actual turbulent boundary layer is a three-dimensional flow, it contains a mass of coherent structures such as streaks and vortices that lead to nonuniform of flow properties in spanwise direction [11, 12], so it is taken for granted to use a spanwise array of DBD plasma actuators to control the boundary layer [6–9].The electrodes of these actuators are arranged to align with flow which produce spanwise stress and streamwise vortices when plasma on [3].So far the prominent results of turbulent boundary layer control using this type of actuator are listed below.In 1998,Rothet al[6] first proposed DBD plasma actuators and applied it to control the boundary layer.They found that the drag and momentum deficit of turbulent boundary layer increased when actuators are excited by an AC high voltage with high carrier frequency.Inspired by the result that spanwise oscillation can greatly reduce skin-fraction drag [13],Jukeset al[8] alternately activated the electrodes of a spanwise array of DBD plasma actuators, the results showed that the drag was reduced by up to 45%in the downstream of the actuators by measuring the near wall velocity gradient.In 2018, combined the best features of AC, which is more efficient in ionizing the air, and that of DC, which is more efficient in generating a body force, Corke and Thomas [9]applied the pulsed-DC actuator to control turbulent boundary layer.The result showed that the optimum electrode spacing was 1000 ν/uτ(ν is the kinematic viscosity,uτis fraction velocity),which was approximately 10 low speed streaks,and the net drag was as much as 65%.Due to the limitations of measurement technologies and other considerations, these results were all obtained from experiments confined to the low speed and low Reynolds number range which the maximum speed was only 42 m s−1[9].
As we know,the control strategies of turbulent boundary layer should be closely related to its coherent structures.With the deepening of research on the effect of Reynolds number on turbulent boundary layer, it is found that the wall turbulence of high Reynolds number behaved differently from that of low Reynolds number in several aspects,the scaling of the turbulence statistics, and the organized motions, and the interaction between inner layer and outer layer, and the evolution of the spectra, and many more [14].It is important to note,whereas the main contribution to the bulk turbulence production comes from the near-wall region at low Reynolds numbers,the logarithmic region dominates at sufficiently high Reynolds numbers [15].The inner-region quasi-cyclic events which maintain the turbulence appears to be largely selfsustaining at low Reynolds numbers [16], whereas it was found that the outer structure had a strong modulating influence on the near-wall events, and that this influence was Reynolds-number dependent [17].At the same time, the meaningful quantities of turbulent boundary layer are scaled with the flow velocity, such as friction velocity and fluctuation velocity.Therefore, the previous results of turbulent boundary layer control confined to the low speed and low Reynolds number range may not be able to guide the practical application which the flow condition is high speed and high Reynolds number, even if possible, at least some control parameters need to be improved, such as electrode spacing and excitation voltage.So it is necessary and significant to study the turbulent boundary layer control on high speed and high Reynolds number.
The shear stress change caused by turbulent boundary control is our main concern, so it is critical to measure accurately the shear stress or viscous drag for studying the control strategies.With the advancement of micro electromechanical system (MEMS) technology, it is possible to measure wall shear stress well.In this work, hot-film sensor technique, as a MEMS based sensor techniques, is employed to measure shear stress.Compared to other measurement techniques,such as thin-oil-film techniques and liquid crystal coating techniques [18], hot-film sensor technique has some unparalleled advantages.For example,it is convenient to stick the sensor to the measuring place,and suitable for measuring in multiple environments because of its flexibility and small physical size,such as the curved surface of an airfoil.It is the first time that using hot-film sensor technique to measure the shear stress in the field of turbulent boundary layer control with plasma.During the experiment,there are some problems either caused by plasma or related to the measurement of hotfilm sensor itself.These problems that have to be solved and corresponding solutions are listed here.Firstly, the heat produced along with plasma inevitably causes the measurement error of hot-film sensor used to measure shear stress,we adopt another sensor used to measure temperature to correct the output voltage of the previous sensor.Secondly, since the output of the sensor is voltage, a calibration method combining computational fluid dynamics (CFD) computation with experiment is tried to convert the voltage into shear stress.Lastly,to verify that the sensor is capable of measuring accurately shear stress change, seven repeated measurements are conducted and give the relative error.These solutions may be preliminary but we think it has great value for guiding the shear stress measurement of hot-film sensor in the field of turbulent boundary layer control with plasma.
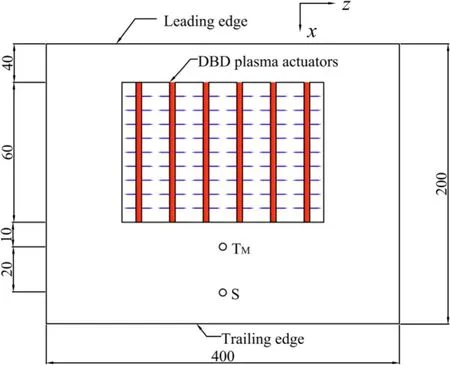
Figure 1.Schematic plan of the NACA0012 airfoil.Dimensions are in millimeters.The size is not scaled with the physical airfoil.
In this work, we investigate turbulent boundary layer control on NACA0012 airfoil with Mach number ranging from 0.3 to 0.5 using a spanwise array of DBD plasma actuators through hot-film sensor technique.The second section describes experimental set-up in detail, the following sections focus on the problems, solutions and results mentioned in the previous paragraph, and the last two sections demonstrate turbulent boundary layer control results, conclusion and discussion.
2.Experimental set-up
2.1.Wind tunnel and NACA 0012 airfoil
Experiments covering a Mach number range from 0.3 to 0.5 are conducted in a NF-6 high speed wind tunnel in National Key Laboratory of Science and Technology on Aerodynamic Design and Research,at Northwestern Polytechnical University.This is a pressurized continuous transonic wind tunnel with freestream air temperature control and velocity varying range of Mach number from 0.15 to 1.1.The test section is 0.4 m in width by 0.8 m in height cross section by 3 m in length, and the upper and lower walls are inclined perforated walls with an aperture ratio of 6%, and both side walls are solid walls.

Figure 2.The insulated NACA0012 airfoil.

Figure 3.The NACA0012 airfoil places in the test section.View from upstream.
The NACA0012 airfoil made of steel,0.2 m long and 0.4 m wide, spanning the entire test section, is shown schematically in figure 1.In order to insulate the airfoil from the DBD plasma actuators, a layer of 0.2 mm thick kapton is covered over the airfoil (see figure 2).The airfoil is placed at half of the height of the test section above the floor (see figure 3,there are more sensors on the actuators side and downstream to show the boundary layer is a turbulent boundary layer,but we finally think that this method is unreliable and is not involved in this paper).We regard the center of the leading edge as origin of co-ordinate.The flow direction and spanwise direction are indicated byxandzrespectively,as shown in figure 1.The airfoil is tripped just downstream the leading edge to make sure that the boundary layer on the upper surface is a turbulent boundary layer.
2.2.DBD plasma actuators
The spanwise array of DBD plasma actuators, as shown in figure 4(a),has an effective length of 60 mm,starting fromx/c= 20%to 50%.The array consists of six 2 mm wide copper sheets as upper electrodes and a 60 mm wide copper sheet as lower electrode, in addition, there is a layer of 0.2 mm thick kapton as dielectric material between the upper and lower electrodes (see figure 5).The upper electrodes are arranged along the streamwise direction and the electrode spacing is 10 mm from left side of one upper electrode to that of adjacent upper electrode.The lower electrode connects to ground and the upper electrode connects to AC power supply which provides pulsed high voltage with settling the duty cycle as 50%.Figure 4(b) shows that plasma is produced on both sides of the upper electrodes when plasma on at peak-topeak excitation voltageVp–p= 5 kV at the still air, while there is a small amount of plasma inevitably generated at the junction between lead of the upper electrodes and the lower electrode.
2.3.Hot-film sensor
The hot-film sensor shown in figure 6 is provided by the MOE key laboratory of Micro and Nano Systems for Aerospace, at Northwestern Polytechnical University.The typical device structure consists of a thin-film sensing element which is a thermistor (the relationship between resistance and temperature can refer to equation (3) in the next section).During operation,the sensing element is driven by a constant current and is therefore resistively heated to a temperature greater than the ambient temperature.This localized heating of the sensing element generates a thermal boundary layer within the velocity boundary layer.As the temperature of the sensing element varies with convective heat transfer changes caused by variation of shear stress at this point in the flow environment, so do the resistance and the voltage across it.
The thickness of sensor is less than 60 μm, which is almost inside the sublayer of the turbulent boundary layer,hardly affects the flow properties, particularly shear stress.Because the sensing element of hot-film sensor is a thermistor, so it can be used to obtain temperature value by measuring its resistance.In this work, we use two hot-film sensors, one for measuring ambient temperature denoted byTMand one for measuring shear stress denoted by S.Sensor S is driven by a constant current and we measure the voltage across it, but sensorTMis only for measuring ambient temperature by monitoring its resistance without heating it.Sensor S operates in constant current mode and has a dynamic response frequency above 1 kHz,settling sampling frequency and time to 12 kHz and about 6.5 s, respectively.In this paper, the output voltage of sensor S is average voltage.The resistance of sensorTMis measured by Agilent 34410A.SensorTMplaces atand sensor S places atwhere the relative location distribution is shown in figure 1.
In this experiment, the wind tunnel runs three times.In the first one, seven repeated measurements atMa= 0.3 are performed in order to test stability of hot-film sensor.In the second one, the turbulent boundary layer control by DBD plasma actuators is conducted, the time order of the experimental condition and excitation voltage imposed on actuators are listed in table 1.Here,Re=wherecis chord length 200 mm,Uis the freestream velocity.The last one is used to obtain the complete upper surface pressure coefficient distribution atMa= 0.4 in order to verify that the calibration method is reasonable.
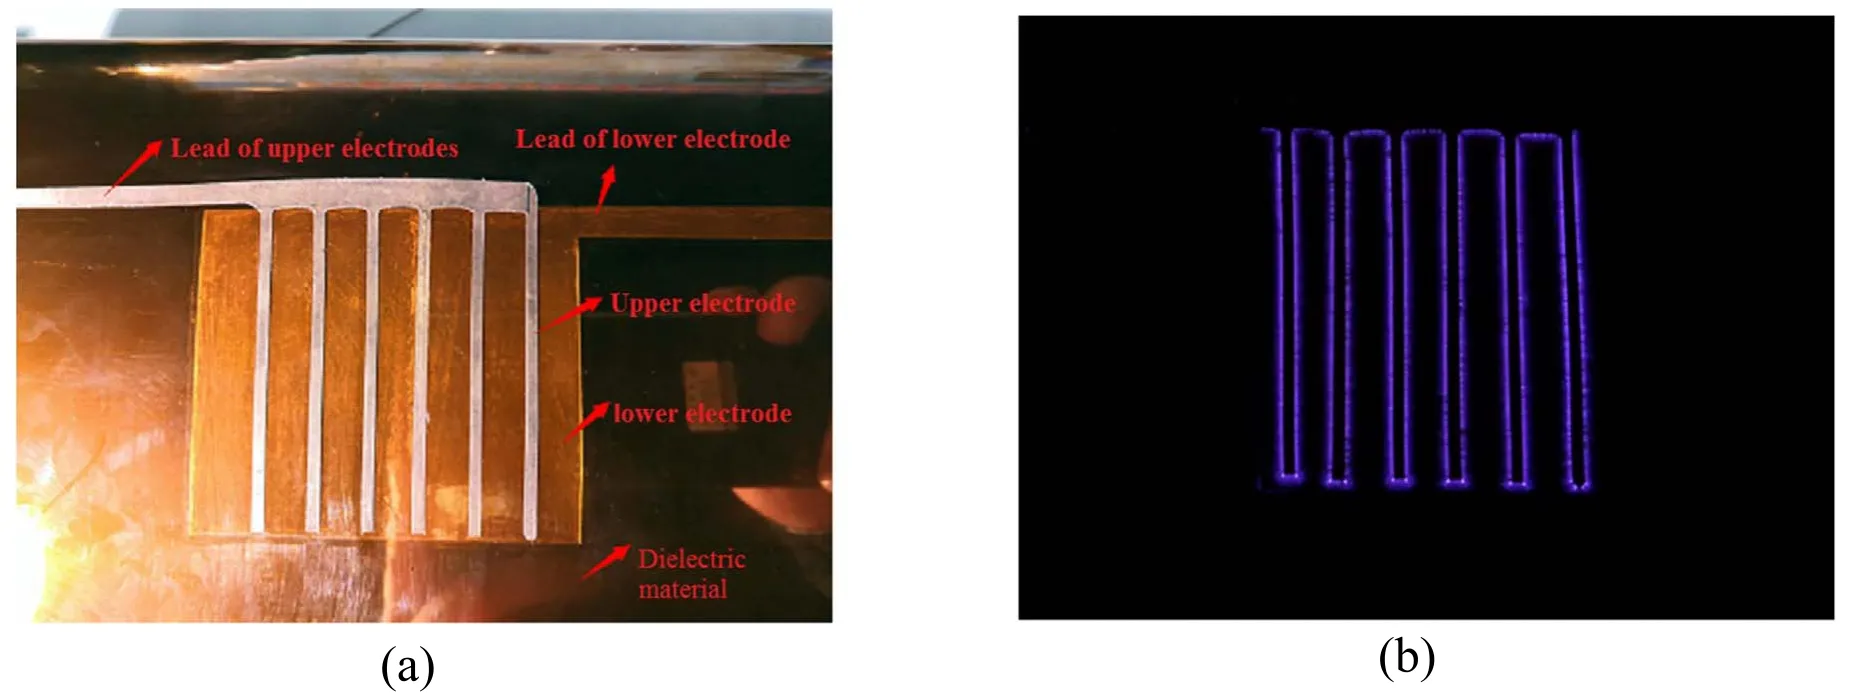
Figure 4.The photograph of DBD plasma actuators when: (a) plasma off, (b) plasma on at Vp–p = 5 kV in a darkened laboratory.
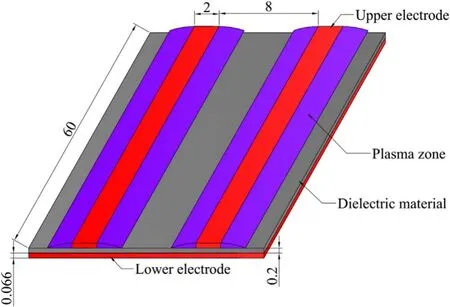
Figure 5.Schematic of one part of the array of DBD plasma actuators.Dimensions are in millimeters.The size is not scaled with the physical airfoil.
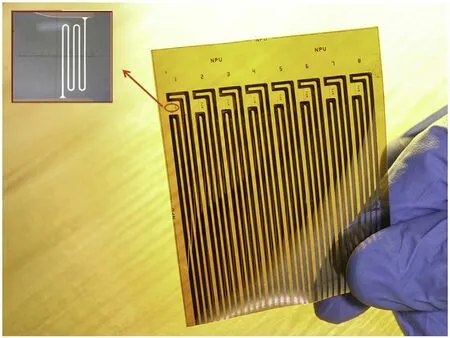
Figure 6.The photograph of hot-film sensors.
3.Temperature correction of hot-film sensor
According to the [19], when the hot-film sensor is operating in constant current mode, the output voltageUof hot-filmsensor satisfies the equation:

Table 1.The time order of the experimental condition and excitation voltage imposed on actuators in the second run.
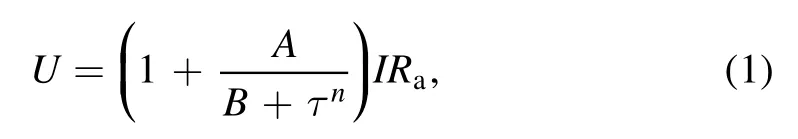
whereIis the constant current applied to the sensor,Rais the resistance of the sensing element at ambient temperatureTa,τ is shear stress input,A,Bandnare unknown parameters.
From the equation, the output voltageUof sensor S varies with ambient temperatureTaby correlating with the resistanceRa.During the experiment, small ambient temperature changes,which is mainly introduced by the temperature difference of the flow and the heat generated along with plasma, is inevitable and will introduce the error of shear stress measurement.Figure 7 shows the temperature changes ΔTmeasured by sensorTMat different burst frequencies atVp–p= 8 kV,which is the temperature with plasma minus the one without plasma.It can be seen that the heat generated along with plasma raises the temperature by 0.72 K which is enough to produce a large error in the shear stress measurement.In addition, it is apparently that ΔTincreases with the burst frequencyffrom the figure, but in fact, it is not.The reason caused the false conclusion is that during the experimental process, the actuators are discharging in the whole time when the burst frequency is applied in a time order from small to large, therefore near the sensor the heat accumulates continuously leading to a monotonous increase of ΔTwith burst frequency.
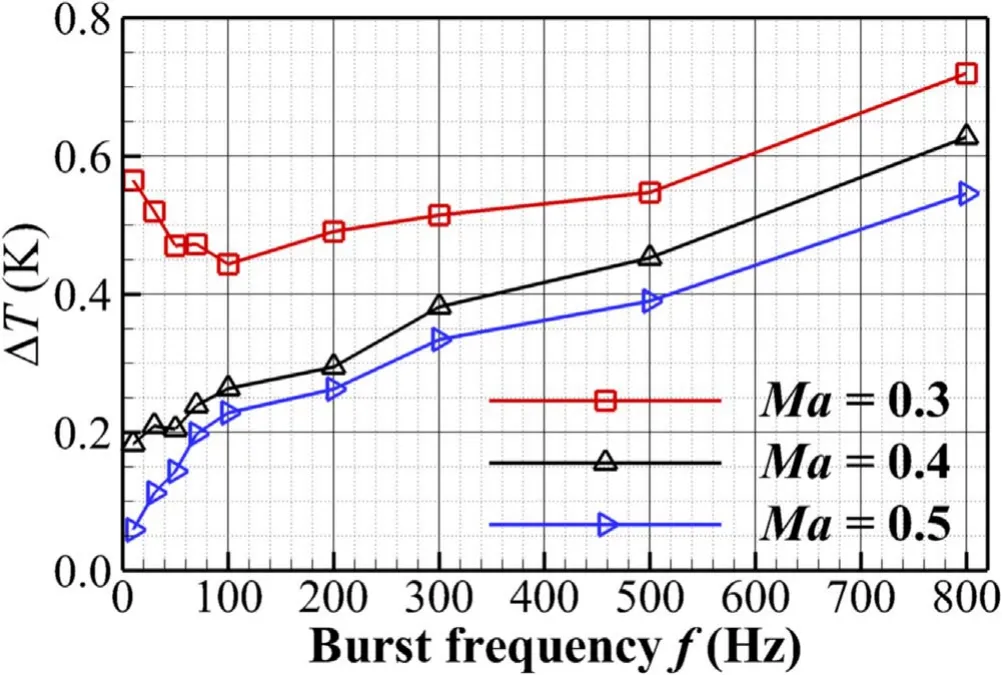
Figure 7.The temperature changes ΔT at different burst frequencies f.

Figure 8.The voltage deviation of seven repeated measurements at Ma = 0.3.
In order to eliminate the error of sensor S introduced by ambient temperature change, a correction method is applied[20].If ambient temperature change ΔTis less than 5 K,A,Bandnare thought to be constant.So the output voltageUis only proportional toRa.In this experiment, the ambient temperature is within 290 ± 2 K, so we chose 290 K as the reference temperature and transformed all the output voltageUof sensor S into the voltageEat this temperature.The transformation equation is:

whereR290is the resistance of the sensing element at ambient temperatureTa= 290 K.The resistanceRasatisfies the equation:

where α andRarare thermal coefficient of resistance and the resistance respectively at ambient temperatureTar.In order to obtainRa, the α andRaratTar= 293.15 K measured before the experiment.
Figure 8 shows the voltage deviation obtains from seven repeated measurements atMa= 0.3.UiandEiare theith measurement value, ¯Uand ¯Eare the average of the seven measurements.The maximum deviation 0.54 mV of voltageUis an order of magnitude bigger than the one 0.025 mV of voltageE.So the correction method is greatly necessary and effective.Hereafter all the voltage indicates voltageEwhich has been corrected by the above temperature correction method.

Figure 9.The Cp versus from CFD computation compared with the one from the experiment at Ma = 0.4.
4.Calibration on hot-film sensor
In order to obtain quantitative shear stress change caused by control with DBD plasma actuators,it is necessary to calibrate the hot-film sensor S which is to find the correlation relating the measured output voltage to the wall shear-stress.According to the working principle of sensor at constant current mode [20], the correlation can also be written as:
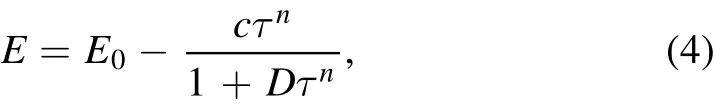
whereE0is the output voltage of the sensor at zero shear stress input,C,Dandnare constant parameters.To determine the correlation, at least four sets of shear stress input and output voltage should be known.
We chose the output voltageEatMa= 0.3,0.4,0.5 and 0 without plasma in the second run of wind tunnel to calibrate the sensor S, the reason for not choosing extra run is that the zero point of the sensor may migrate during the off and on of the wind tunnel.The corresponding shear stresses τ are determined by CFD computation.Using an extent of 30c,grid size for the NACA 0012 is 1076×257.The grid has minimum spacing at the wall ofy= 0.002 mm, giving an approximate averagey+between 0.2 and 0.6 over the airfoil and all Reynolds numbers.The topology is a so called‘C-grid’with the grid wrapping around the airfoil from the downstream farfield, around the lower surface to the upper, then back to the downstream farfield again.Turbulent boundary layer is simulated using SA (Spalart-Allmaras 1-eqn) model.
In order to validate the capability of computing the shear stress, the CFD computation is compared against the experiment for surface pressure coefficientCpas a function ofx/catMa= 0.4 in figure 9.Since a part of pressure holes on the upper surface are covered by DBD plasma actuators and hotfilm sensors,the additional experiment is conducted of which the NACA 0012 airfoil is the same as the previous experiment except removing the electrodes and sensors.From the figure 9 the experimental data fits well with the profile of pressure coefficient from the CFD computation which indirectly proves that the boundary layer on the upper surface is a turbulent one.
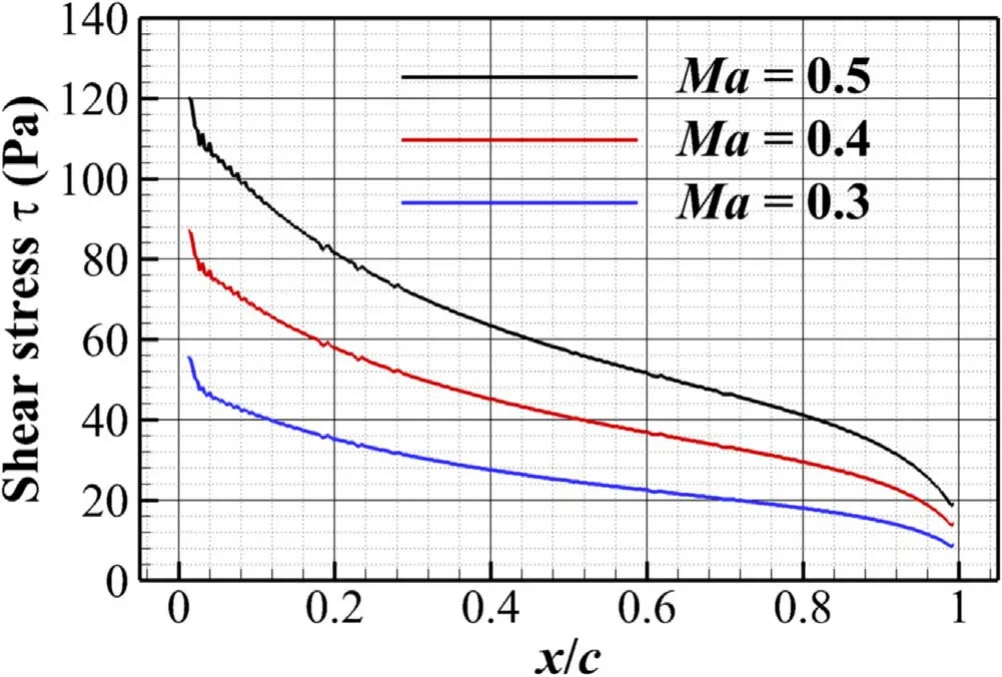
Figure 10.The shear stress τ versus x/c from CFD computation at three Mach numbers.
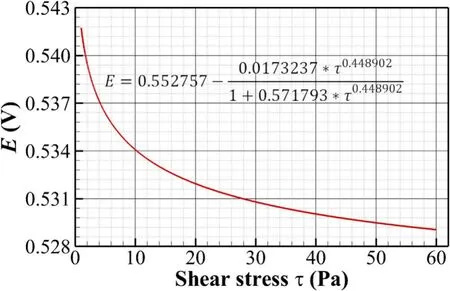
Figure 11.The correlation relating shear stress τ to voltage E.
Figure 10 depicts the shear stress τ over the upper surface at three Mach numbers.The shear stress values atx/c= 65%are obtained,where sensor S places at.Then plugs these shear stress values and corresponding output voltages into the equation (4).At last, the constant parameters of the equation will be solved.The correlation relating shear stress input τ to output voltageEis described in figure 11.
5.Measurement error of hot-film sensor
To test the stability of the hot-film sensor, we make seven repeated measurements atMa= 0.3.The shear stress deviation τi–of seven times measurements is shown in figure 12,of which τiis theith measurement value,is the average of the seven measurement.The confidence interval is from−0.18 to 0.18 Pa and the root mean square(RMS)is 0.11 Pa giving a relative error 0.5% over all Mach numbers.The uncertainty is 0.32 Pa based on the random error 0.11 Pa and system error 0.3 Pa.

Figure 12.The shear stress deviation from the average of seven times measurements.
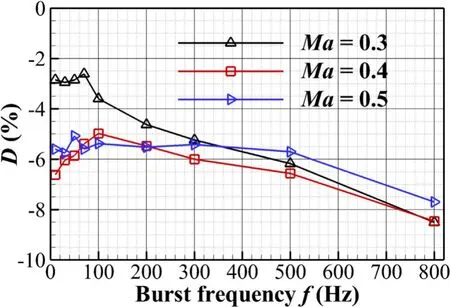
Figure 13.The relative change D varied with burst frequency f at different Mach numbers at Vp–p = 8 kV.
6.Turbulent boundary layer control by DBD plasma actuators
Figures 13 and 14 illustrate that shear stress change, caused by the turbulent boundary layer control with DBD plasma actuators, varies with burst frequency at different Mach numbersMaand different excitation voltagesVp–prespectively.The percentage of relative change in shear stress is defined asD= (τno–τc)/τno×100%,where τnodenotes the shear stress without plasma and τcwith plasma.Almost all the relative change, ranging from −8% to −4% which is nearly an order of magnitude larger than the relative error 0.5%, is thought to be reliable.From these two figures, the main conclusion is drawn that the burst frequency almost has no effect onDexcept that it decreases by 2% atf= 800 Hz.Infigure 13, the profile of the three Mach numbers seems to collapse onto a single curve (except for points below 100 Hz atMa= 0.3) considering the relative error 0.5%, suggesting that the control may be independent of the Mach number.From the figure 14,it is surprising that the shear stress change does not vary withVp–p, which tells that DBD plasma actuators cannot reduce drag by increasing the excitation voltage and inputting more energy into it.Based on the above conclusion, it can be inferred that no matter what burst frequency and excitation voltage are imposed on actuators, the shear stress increases by about 6% over the three Mach numbers.

Figure 14.The relative change D varied with burst frequency f at different excitation voltages Vp–p at Ma = 0.4.
7.Conclusion and discussion
This work investigates the control on the drag of turbulent boundary layer on NACA 0012 airfoil with a spanwise array of DBD plasma actuators by hot-film sensor technology.For correcting the measurement error of shear stress introduced by temperature change which is mainly caused by heat generated along with plasma, the correction method that takes account of the change measured by another sensor is used and works well.To obtain the value of shear stress change,we combine CFD computation with experiment to calibrate the output voltage of sensor.Seven repeated measurements of shear stress tell that confidence interval of hot-film sensor measurement is from −0.18 to 0.18 Pa and the RMS is 0.11 Pa giving a relative error 0.5% over all Mach numbers in this experiment.The research on the turbulent boundary layer control on the shear stress with DBD plasma actuators demonstrates that the control makes shear stress increase by about 6% over the three Mach numbers, which is thought to be reliable through comparing it with the relative error 0.5%,and the value is hardly affected by burst frequency and excitation voltage.
For the above conclusion which appears to be contradictory to previous studies [6–9], we think there are two possible reasons.One is that the electrode spacing above 3300 ν/uτis too large to effectively control the turbulent boundary layer,this conjecture can be derived from the research on the influence of electrode spacing on drag reduction [8, 9].The other is that compared with the low-speed experiments, the relative intensity of interference imposed on turbulent boundary layer by the actuators is too small.For example,the maximum wall jet velocityUminduced by actuation is about 3 m s−1[3], but the friction velocityuτis over 5 m s−1,therefore the ratioUm/uτis much less than 1 which is the opposite of low speed experiments.Based on the two possible reasons, we speculate that the plasma actuation may only produce more small-scale disturbances on the turbulent boundary layer, resulting in an increase in shear stress.Moreover, the variations of flow speed and excitation parameters (burst frequency and excitation voltage) no longer have a significant influence on the control result.
Considering interaction between the DBD plasma actuators and turbulent boundary layer is three-dimensional,in the future we will simultaneously measure as much as possible the shear stress change of multiple spanwise points such as just downstream of the upper electrode, which may bring new problem for the arrangement of hot film sensors.
Acknowledgments
The authors would like to acknowledge the financial support from the European Commission through the Research and Innovation action DRAGY (Drag Reduction via Turbulent Boundary Layer Flow Control), under Grant No.690623, and the Ministry of Industry and Information Technology(MIIT)of the Chinese government, and support received from National Natural Science Foundation of China (No.11572256).
The author of this article was grateful to the MOE key laboratory of Micro and Nano Systems for Aerospace for providing hot-film sensors and measurement technology.Thanks to Prof.Binghe Ma, Yuchao Yan, Runbo Chen and Pengbin Wang of the MOE key laboratory of Micro and Nano Systems for Aerospace, for providing support, measuring guidance of hot-film sensor and following data processing.
杂志排行

Plasma Science and Technology的其它文章
- Effect of edge turbulent transport on scrapeoff layer width on HL-2A tokamak
- An investigation on improving the homogeneity of plasma generated by linear microwave plasma source with a length of 1550 mm
- Spatio-temporal evolution characteristics and pattern formation of a gas–liquid interfacial AC current argon discharge plasma with a deionized water electrode
- Plasma activation towards oxidized nanocarbons for efficient electrochemical synthesis of hydrogen peroxide
- Spatio-temporal evaluation of Zr plasma parameters in a single-beam-splitting double-pulse laser-induced plasma
- Enhanced electrocatalytic activity of carbon cloth by synergetic effect of plasma and acid treatment