A Survey on Intelligent Screening for Diabetic Retinopathy
2019-07-12YulanDaiChengzhangZhuXiShanZhenzhenChengBeijiZou
Yulan Dai , Chengzhang Zhu *, Xi Shan ,Zhenzhen Cheng , Beiji Zou
1School of Computing Science and Engineering,
2School of Literature and Journalism, Central South University, Changsha 410083, China
3Hunan Province Engineering Technology Research Center of Computer Vision and Intelligent Medical Treatment, Changsha 410083, China
Key words: diabetes; retinopathy; fundus images; intelligent screening
Abstract Diabetic retinopathy (DR) is one of the leading causes of vision loss and can be effectively avoided by screening, early diagnosis and treatment. In order to increase the universality and efficiency of DR screening,many efforts have been invested in developing intelligent screening, and there have been great advances. In this paper, we survey DR screening from four perspectives: 1) public color fundus image datasets of DR; 2) DR classification and related lesion-extraction approaches; 3) existing computer-aided systems for DR screening; and 4) existing issues, challenges, and research trends. Our goal is to provide insights for future research directions on DR intelligent screening.
T HE occurrence of diabetes is expected to rise from 2.8% to 4.4% of the global population in 2030.1Diabetic retinopathy (DR) is one of the most serious complications of diabetic microangiopathy. The incidence is as high as 65.2%in diabetic patients.2DR is an irreversible and highrisk blindness disease with staged development, and greatly impacts visual acuity of diabetic patients. DR can be classified into non-proliferative diabetic retinopathy (NPDR) and proliferative diabetic retinopathy(PDR) according to the Ophthalmology Group of China in 1984.3Among various symptoms, microaneurysms(MAs) usually appear in early stage of DR, thus are considered as an important indicator of DR. Additionally, the appearance of neovascularization (NV) marks the transition from NPDR to PDR.
In 2002, the International Clinical Classification Standard further divided NPDR into three stages: mild NPDR, moderate NPDR and severe NPDR. Mild NPDR is the earliest stage of DR, and only MAs within tiny areas are formed in this stage as the result of leakage of blood vessels.4Moderate NPDR is often accompanied with increased MAs, while severe NPDR has more pathological alterations on the retina, such as hemorrhages (HEs) and exudations (EXs). EXs appear yellow or white on color fundus images and can be divided into two types according to their appearance and occurrence. Hard EXs have clear boundaries, but soft EXs do not.
PDR is the most serious stage, which initializes a vicious cycle. During PDR, retina is ischemic and anoxic, so NV grows to ensure the normal nutrition supply;NV is fragile, easy to rupture, and will grow after rupture.5Therefore, patients at this stage have a high risk of blindness. The illustration of fundus lesions in different grades are shown in Table 1, in which the most commonly used grading standard is included. Figure 1 gives morphologic examples of the fundus lesions that represent typical pathologies of DR on color fundus images.
The risk of blindness can be greatly reduced if the fundus is examined at the early stage of DR. However,the initial lesion in the fundus is usually asymptomatic,and patients are unaware of its onset. Additionally, due to limited equipment and the lack of ophthalmologists in some regional health care facilities, the screening rate of DR is extremely low in China. In 2016, the“China DR Screening Project” was launched in Beijing to increase the screening rate. However, efficient solutions to further improve the DR screening rate are demanded.
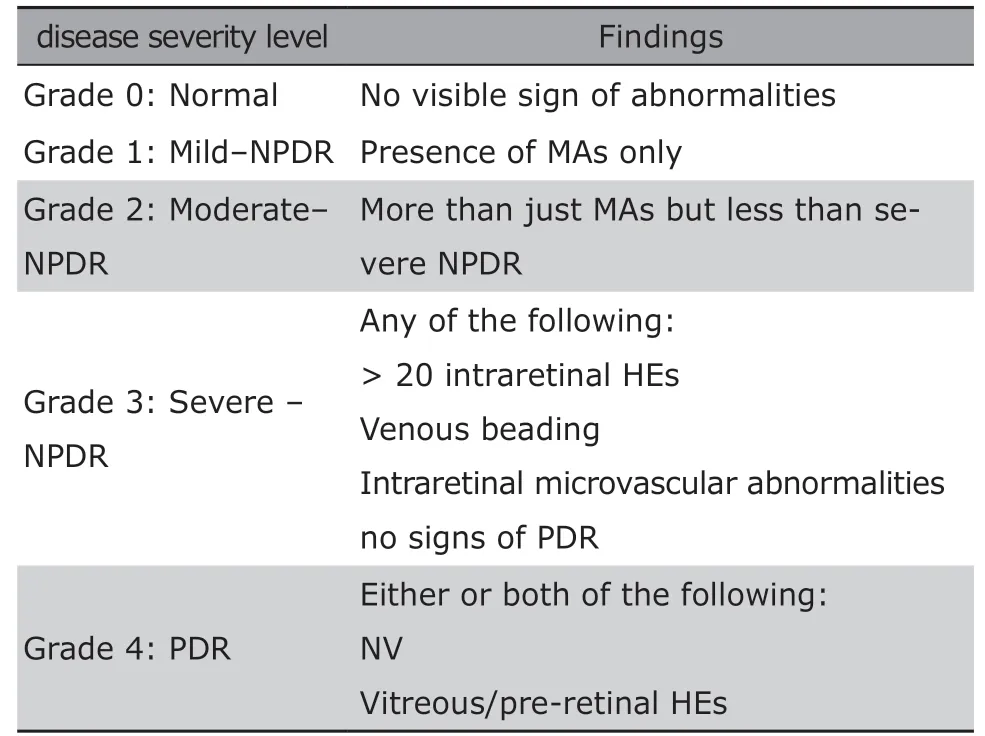
Table 1. Diabetic retinopathy severity and the grading standards
Automated detection and analysis of DR, as a promising approach, can effectively reduce the workload burden of the specialists in an efficient and economical manner. DR intelligent screening methods based on color fundus images can be divided into two categories. The first category achieves DR screening by detecting and segmenting lesions of MAs, HEs, EXs and NV. The key to early diagnosis of DR is to detect MAs reliably on retinal images. Different lesions detected can serve as indicators to identify and grade the severity of DR. Based on detected lesions, retinal images can be classified into normal and abnormal conditions.The second category conducts an end-to-end screening or grading of DR by a classifier which is trained using a large number of labeled data. In its initial stage, various morphological methods and traditional machine learning methods6-9have been used in DR screening.Recently, the deep learning methods, particularly convolutional neural networks (CNNs), have contributed substantially to DR screening.10-12With the increasing maturity of DR detection algorithms, an increasing number of DR intelligent screening systems have been developed and many of them have been put into trial operations.
In this paper, we review existing methods for automatic identification of retina features that are related to DR from color fundus images. First, public color fundus image datasets for DR are introduced. Second,DR classification and relevant lesions, which should be considered as screening points of DR are presented,including MAs, HEs, EXs and NV. Third, existing computer-aided systems for DR screening are analyzed.Lastly, some existing issues, challenges, and research trends are discussed.
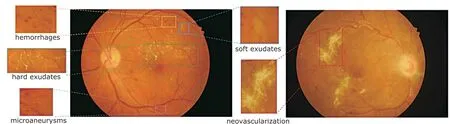
Figure 1. Manifestations on color fundus images reflecting different pathologies associated with diabetic retinopathy.
PUBLIC COLOR FUNDUS IMAGE DATASETS OF DIABETIC RETINOPATHY
Most public datasets were constructed particularly for automatic feature extraction of DR. Specifically, we introduce several datasets that contain labels of lesion areas and grades in this section.
ImageRet
The ImageRet dataset consists of DIARETDB013and DIARETDB1.14The images were annotated for the presences of MAs, HEs, hard and soft EXs by four experts.Annotated images were combined to produce a single ground truth image. DIARETDB0 contains 130 color fundus images, of which 20 are from normal conditions while 110 contain lesion signs of DR. DIARETDB1 contains 89 color fundus images, of which 84 are at least mild non-proliferative DR, while 5 are considered as normal conditions.
MESSIDOR
MESSIDOR dataset15consists of 1200 color fundus images acquired using a color video 3CCD camera on a Topcon TRC NW6 non-mydriatic retinographies at 45 degrees field of view (FOV) from three ophthalmologic departments. The images are available at different resolutions: 1440*960 pixels, 2240*1488 pixels, and 2304*1536 pixels. Each 400 images obtained from a department are divided into subsets according to the severity grade of the disease by ophthalmologist. Each subset contains 100 images and the grade of each image is listed. There is no annotations for any fundus lesion in MESSIDOR.
Stare
Stare dataset16consists of 397 color fundus images acquired using a TOPCON TRV-50 fundus camera at 35 degrees FOV with image resolution of 700*605 pixels.This dataset is primarily used for vessel segmentation tasks. Additionally, there are 91 images with diagnosis of DR, of which 22 images are indicated to be PDR.
High resolution fundus dataset
High resolution fundus (HRF) dataset17contains 15 images from healthy people and 15 images from diabetic patients. The images were acquired using CANON CF-60UVi camera at a high resolution of 3504*2336 pixels. There is no marking of lesion grades or lesion areas.
Indian diabetic retinopathy image dataset
indian Diabetic Retinopathy Image Dataset (IDRID)18consists of 413 color fundus images acquired using a Kowa VX-10 alpha digital fundus camera at 50 degrees FOV. The images have a resolution of 4288×2848 pixels. Of this dataset, 134 are healthy, 279 are DR, in which 49 are PDR. Moreover, the segmented marks of MAs, EXs and HEs are also provided in 54 NPDR images.
Kaggle
Kaggle19is an open competition dataset provided by EyePACS which is acquired using multiple fundus cameras at different FOVs. The Kaggle dataset consists of 35,126 training images with five DR grade labels and 53,576 test images without grade labels. The image quality in this dataset is not uniform, which can be used to improve the generalization of a classifying algorithm.
In addition to the above-mentioned datasets,there are other datasets, such as E-Ophtha,20ROC,21ARIA Online,22and DRiDB,23where interested readers can explore the details on their own.
LESION DETECTION
Many approaches have been proposed in order to achieve efficient intelligent screening and classification of DR. Winder et al.24summarized methods for DR detection from 1998 to 2008. In recent years,more researchers have shifted to deep learning-based methods. It has been shown that deep learning-based methods outperform traditional methods in terms of classification accuracy. The ideas of existing methods can be mainly divided into three categories. (1) Traditional machine learning: features, based on prior knowledge, are extracted to train a classifier, then the classifier extracts candidate sets and further decides whether the candidate areas are lesions or not. (2)Combination of traditional machine learning and deep learning. This approach uses deep learning to extract features and then use traditional machine learning for classification. (3) End-to-end deep learning technique:by training with a large number of labeled data, the pre-trained network model can screen fundus images directly. The technical roadmap of these approaches is shown in Figure 2. According to different objectives of detection, DR detection techniques can be divided into five categories: MA detection, HE detection, EX detection, NV detection, and Classification.
Microaneurysm detection
Mathematical morphology being used to detect MAs at the early stage of DR can be dated back to 1984.To give an example, Lay et al.25applied the top-hat transformation with linear structural elements to the green channel images for separating the circular structure from the slender structure. Subsequently, various modifications26-30were made to improve the detection accuracy. Operations such as limited contrast adaptive histogram equalization, illumination correction, and local minimum transformation were performed by Puranik et al..29After blood vessels were removed, Kamble et al.30used local rank transform to separate MAs in fundus images. Based on the observation that the intensity distribution of MAs is similar to the Gaussian distribution, some researchers proposed the MA detection method using template matching.31,32Quellec et al.31used local template matching in wavelet domain to detect MAs. Zhang et al.32used a nonlinear filters with five Gaussian kernels at different standard deviations.
The above-mentioned methods tend to ignore hidden structures, but traditional machine learning methods can successfully find the hidden patterns of MAs. Antal33used a rule-based classifier to detect true MAs from MA candidates. Niemeijer et al.34detected MAs from red lesion candidates using a combination of top-hat based methods and supervised classification. Dashtbozorg et al.35extracted a set of features based on a locally convergent index filter, in addition to the strength and shape descriptors of each candidate which were extracted via a gradient weighting technique and an iterative threshold method. These features were used to train a hybrid sampling/boosting classifier for MA detection. Wang et al.36extracted the features of vessel cross-section profiles along with multiple directions, which were obtained by applying singular spectrum analysis on each candidate. Next, a K-nearest neighbor classifier was used to detect MAs.Xu et al.37extracted and classified 7 pathological features that are related to MAs by combining the digital image analysis, statistical analysis, and pattern recognition together.
With the rise of deep learning, researchers have managed to detect MAs with high accuracy. Chudzik et al.38combined CNN and the voting mechanism to detect MAs on E-Ophtha, ROC and DIARETDB1 datasets, respectively. Budak et al.39proposed a CNN model in combination of reinforcement learning and trained a model using the patches from MA areas and non-MA areas. Dai et al.40proposed a method to extract MAs by multi-sieving CNN combined with clinical diagnostic reports, which achieved up to 99.6% detection accuracy.
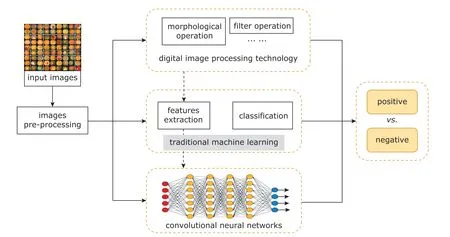
Figure 2. Technical roadmap of existing methods for diabetic retinopathy detection.
Hemorrhage detection
Compared to MA detection, HE detection receives less attention. Template matching and normalized cross-correlation were used to extract HE candidates by Bae et al..41Xiao et al.42used rule-based and traditional machine learning methods to detect HEs. In addition to detecting independent HE regions, they also improved the detection accuracy of HEs near retinal blood vessels. Tang et al.43proposed a novel splat feature classification method. The splat is a segment of the non-overlapping part which covers the whole retinal image. It contains pixels that share similar color and spatial location. Subsequently, a set of features was extracted from each splat according to texture information, the response of various filter banks, and the interaction of adjacent splat. Barath et al.44also extracted co-occurrence matrix features apart from splat features at the gray level, and used support vector machine (SVM) to detect HEs. Grinsven et al.45realized HE detection using a nine-layer CNN. During the training process, samples that were wrongly classified as negative are dynamically selected and assigned with different weights, then they are used in the next training iteration to improve training efficiency. At present,deep learning-based methods are rarely used in HE detection.
HEs appear in different shapes, including dots,blots, and flames. It is difficult to distinguish dot HEs from MAs, so HEs and MAs are usually detected together, known as red lesion detection. Morphological operations, wavelet operations, and artificial designed features are combined with statistical classifiers to detect red lesions.46-50Seoud et al.49designed a set of morphological features called dynamic morphological features in order to distinguish lesions and vessel segments. Adal et al.50automatically detected the longitudinal changes caused by small red lesions on normalized fundus images, and used SVM to identify red lesions according to their intensity and shape related features.
Exudate detection
The observation that EXs show a high gray level compared to the background has been used by researchers in automatic lesion detection of DR.51,52Moreover,it is crucial to locate the optic disc in detecting EXs.Usually, mathematical morphology53and filtering operations54are used to extract candidate areas of EXs.Sanchez et al.55performed Fisher’s linear discriminant analysis and classified retinal secretions according to gray characteristics to detect hard EXs. Based on locating optic disc and cup, Li et al.56used the combination of regional growth and edge detection methods in EX detection. Wisaeng et al.57used the mean shift algorithm to roughly segment EXs and obtained EX candidates which could be further classified using the mathematical morphology algorithm. Youssef et al.58found that the vessel segmentation can improve the detection accuracy of EXs after testing.
Classifiers based on traditional machine learning also play an important role.59-63Osareh et al.60used a multi-layer neural network to analyze the selected feature sets which were ranked by a genetic-based algorithm and consisted of color, texture, size and edge strength. The image regions were divided into EX regions and non-EX regions. Zhang et al.61used random forest for classification according to 28 features based on texture, intensity, and geometry. Sopharak et al.62used naive bayes classifier. MaríaGarcía et al.63experimented different classifiers such as multi-layer perceptron and SVM to achieve a high detection accuracy.
In the deep learning era, Yu et al.64trained a CNN using labeled EX patches to achieve pixel-level identification. The inputs to the pre-trained CNN are local regions around potential EX candidate points extracted using the morphological ultimate opening algorithm.In order to incorporate advanced anatomical location knowledge of potential EXs, Pavle et al.65combined the EX probability map obtained from CNN with vessel probability map and optic disk probability map.
Neovascularization detection
As a sign of the proliferative phase of DR, the detection of NV can clearly define the progression of DR.Due to the lack of calibration data, the application of deep learning methods is restricted. At present, traditional machine learning methods are still widely used.Existing methods can be divided into two categories according to whether blood vessels are extracted or not.
The first category depends on the extraction of blood vessels. Compared to traditional features such as area and circumference of NV, Jelinek et al.66veri fied the role of wavelet morphological features based on wavelet of skeletal vessels in detecting the proliferative phase of DR. Welikala et al.67detected NV by analyzing the local morphological changes of blood vessels around each pixel in fundus images. Lee et al.68obtained binary vessel segmentation image and enhanced green channel image through pre-processing, then the statistical texture analysis, high-order spectrum analysis, and fractal analysis for the two images were carried out to obtain 75 relevant features.After dimension reduction of the feature space, the bias-variance tradeoff mechanism was used to find the optimal classification model to detect NV. Because NV often occurs in the optic disc, some researchers focused on the 1-optic disc diameter region. Yu et al.69extracted features of the blood vessels in the optic disc region, including curvature, length and diameter, as well as texture features, for training a SVM classifier.Roychowdhury et al.70extracted 20 features related to texture, structure and intensity using five different filters: absolute high-pass filter, morphological vascular enhancement, gradient filter, watershed transform,and Frangi-filter. Then, Gauss mixture model classifier was trained using these features for NV detection.Goatman et al.71segmented the optic disc vessels and removed the branch points to obtain vessel segment set. Additionally, 15 features, such as length, direction and gray scale coefficient, were extracted to train SVM classifier for NV detection.
The second category does not require pre-extraction of retinal vascular structure, and usually uses texture information to identify NV.72Frame et al.73used the gray level co-occurrence matrix to identify the irregularity of the pixel intensity distribution related to the NV regions. However, such methods cannot localize the area of NV. In order to address this issue, researchers divided the whole image into several patches of the same size, and detected them at the patch level. Pujitha et al.74extracted the vessel and orientation energy features in each patch to co-train a classifier in a semi-supervised manner. The semi-supervised method overcomes the problem of insufficient training data. Gupta et al.75also extracted texture and vascular features on the basis of patches to train random forest classifiers.
Classification
In order to use traditional methods, it is necessary to extract features, and select candidates and classifiers.There are many studies for DR classification using different features and classifiers. For example, Agurto et al.7extracted texture features by applying multiscale amplitude-modulation-frequency-modulation. In the study of Morales et al.,76the local binary patterns were used as a texture descriptor to distinguish DR from normal. Mixed features including area of EXs and vessels, texture and entropy, were used for DR classification by Mookiah et al.,77and three classifiers were tested. Rubini et al.78selected candidates based on hessian and used SVM classifier for classification. Bhatkar and Kharat79also extracted different features, such as a 64-point discrete cosine transform and other statistical features, which were processed by multi-layer perceptual neural networks. Given the current performance of traditional methods, it is challenging to craft new effective features manually to further improve the detection accuracy.
Although the neural network was initially used to classify DR with low accuracy,80,81current studies are showing competitive performance. CNNs are prevalent in DR classification. For example, the Inception-V3 network82was utilized as the architecture for DR classification by Gulshan et al..83Quellec et al.84trained a CNN model to create heatmaps for classification. Yang et al.85graded the severity of DR by a two-stage DCNNbased algorithm. Ardiyanto et al.86proposed Deep-DRNet based on cascaded encoder-classifier network. By embedding the preprocessing layer preceding the first convolution layer, such as contrast enhancement and contrast limitation adaptive histogram equalization,Khojasteh et al.87achieved a high accuracy.
However, the CNN-based method is not ideal in clinical application, although it has contributed substantially to DR classification. The key to a successful screening with deep learning is the large amount of labeled data. After working closely with doctors in India and the United States, Google created a dataset of 128,000 images.88For DR lesions and grade, each image was evaluated by 3 to 7 physicians among 54 licensed ophthalmologists in the United States. This dataset was used to train a deep CNN for detecting conditions that can induce DR. The algorithm was tested on two independent clinical verification sets containing approximately 12,000 images, and the results showed equivalent performance as of the diagnosis of ophthalmologists. In addition to the existing datasets, such as Kaggle, Gao et al.89created a DR dataset containing 4,476 fundus images, each of which was labeled by three senior ophthalmologists for DR severity levels: normal, moderate, heavy, and severe. The deep CNN model based on Inception-V3 network was trained using the dataset to grade the severity of DR on fundus images achieving an accuracy of 88.72%.The coincidence rate between the results of the algorithm and those of ophthalmologists was 91.8%.
Since many existing methods are tested on different datasets and the evaluation criteria are different, it is difficult to compare their results directly. Undoubtedly,CNNs, when combined with traditional machine learning methods, are responsible for state-of-the-art results.
COMPUTER-AIDED SCREENING SYSTEM
Computational modeling for fundus image analysis is of great significance as developing reliable intelligent screening system of DR will not only save manpower and material resources, but also improve the health condition of populace. Since 2016, with the outbreak of applying artificial intelligence in the medical field, there have been many intelligent screening systems developed, which are the subjects of this section.
IDx-DR90from IDx is an intelligent product for DR diagnosis. The system is mainly used to detect the degree of retinopathy in diabetic patients aged 22 and over. IDx-DR was developed by Michael Abramoffand approved by the Food and Drug Administration(FDA) of the United States in February 2018. IDx-DR is equipped with Topcon NW400 fundus camera. As long as the fundus picture is clear enough, it will automatically produce a screening report in one minute.The product is characterized by the ability to provide screening results without the need of clinical interpretation. According to the data from its official website,IDx-DR achieves 87% in sensitivity and 90% in specificity. In contrast, DeepMind91has a sensitivity of 97%and a specificity of 92%. This performance discrepancy is due to that the algorithm is trained using 128,175 images from the American diabetes retina screening website and the Indian eye hospital—images from different sources and having various qualities ensure the stability of the algorithm. The first product of Eyenuk,called EyeArt, is a DR automated screening system using artificial intelligence and cloud computing.92EyeArt can be easily used by physicians and nurses without too much manual interpretation and analysis by ophthalmologist. Due to the high cost of common fundus imaging equipment, indian company Remidio has developed a high-quality portable fundus imaging device called Fundus on Phone (FOP).93The sensitivity of screening DR can reach 95.8% when FOP cooperates with intelligence algorithm of EyeArt. Although not as sensitive as the Deepmind, FOP is very convenient.
In China, Baidu Lingyi constructs a fundus screening system with high accuracy by integrating evidence-based medical interpretable algorithm architecture and deep learning. Coupling with fundus camera, Baidu Lingyi builds a fully automatic artificial intelligence fundus screening machine to screen major blinding diseases, such as DR, glaucoma, and macular disease. The system is supported by the top domestic hospitals in term of data, achieving screening accuracy of over 94%—equivalent performance as of experienced clinical ophthalmologists. Additionally, the speed of screening is fast. A screening report can be available in 10 seconds after taking a fundus image. Compared to Baidu, the Fundus Image Screening System of Redasen aims to detect more types of fundus diseases,but its accuracy is lower. Deep Fundus, the product of Healgoo, can screen 4 common fundus diseases, such as DR, glaucoma, cataract and diabetic macular edema, with an accuracy higher than 95%. By learning 100,000 fundus images of labeled lesions, the accuracy rate for DR screening of the Aier Ophthalmology remote intelligent reading platform can reach 93%. The medical image artificial intelligence application platform developed by the brick can mark lesions in 13-15 seconds with accuracy over 97% on specific data sets.Beijing New Haoran DR cloud screening platform can detect HEs and EXs. The AutoEye screening system of Shanggongyixin has been tested in about 300 hospitals, including nearly 100 tertiary hospitals covering more than 20 provinces in China. There are also many companies and research institutes developing computer-aided screening systems, such as Sun Yat-sen University, Henan Provincial Eye Hospital, Shanghai Tenth People’s Hospital, Tencent, Chunyu Doctor, etc.
The general workflow of the above-mentioned systems is shown in Figure 3, taking IDx-DR as an example. Although there are many screening systems for DR, only IDx-DR has been certified by the FDA of the United States, thus it is the only commercially available device. These screening systems mostly work well on specific dataset, but are commonly found fail in clinical practice. The balance between sensitivity and false positivity is crucial for computer-assisted DR screening. In order to improve the accuracy of an intelligent screening system, it is necessary to learn from large amount of clinical images continuously.
CONCLUSION AND DISCUSSION
In this paper, we review studies of DR screening, including detection of related retinal lesions and diseases classification. Additionally, we discuss the status of applying screening systems. Researchers have been improving the performance of DR screening and will continue to do so. At the moment, deep learning-based methods are responsible for the stateof-the-art performance. While significant results have been achieved, challenges remain.
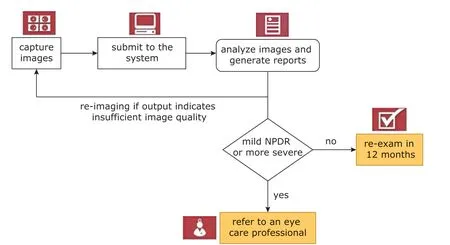
Figure 3. The general workflow of the intelligent screening system of IDx-DR.
First, there are lacking standard datasets for evaluating the performance of DR screening. Kaggle,the largest dataset, contains tens of thousands of images, while some other datasets contain about 100 images. In contrast, computer vision algorithms can be evaluated on more than 1 million annotated images.The lack of data could result in poor generalization of a trained neural network. Thus, one research direction could be building a large-scale dataset which contains a large number of clinical images for improving the accuracy and stability of machine learning algorithms.
Second, most existing methods are developed based on single-mode images. In addition to color fundus images, DR can be detected through different images, such as optical coherence tomography angiography images and fluorescein angiograms. By fusing multi-modal image information acquired through different scanning protocols, the lesion information can potentially be detected more accurately.
Third, deep learning models are difficult to interpret. The correlation and causality between input and output are difficult to understand. Therefore, the screening results obtained using deep learning models are difficult to be trusted by physicians and patients.Medical-specific knowledge can be helpful to alleviate this issue. Moreover, a machine learning technique which involves domain knowledge can potentially increase detection accuracy while require less time to train.
Lastly, due to the complexity of machine learning algorithms, the computing cost can be high, which is unfavorable as it prevents the popularization and utilization of screening systems. So, there is an urgent need to improve the efficiency of detection algorithms.
Conflict of interest statement
All authors declared no conflict of interests.
REFERENCE
1. Yau JWY, Rogers SL, Kawasaki R, et al. Global prevalence and major risk factors of diabetic retinopathy. Diabetes Care 2012; 35(3):556-64.doi: 10.2337/dc11-1909.
2. Xu Y, Wang L, He J, et al. Prevalence and control of diabetes in Chinese adults. JAMA 2013; 310(9):948-59. doi: 10.1001/jama.2013.168118.
3. Zhao KX, Yang PZ, Zhai J, et al. Retinopathy. In: Zhao KX, Yang PZ, editors. Ophthalmology, 8th ed. Beijing:People’s Medical Publishing House; 2013. p.217-9.
4. Kohner EM, Stratton IM, Aldington SJ, et al. Micro-aneurysms in the development of diabetic retinopathy (UKPDS 42). Diabetologia 1999; 42(9):1107-12.doi: 10.1007/s001250051278.
5. Teng T, Lefley M, Claremont D. Progress towards automated diabetic ocular screening: A review of image analysis and intelligent systems for diabetic retinopathy. Med Biol Eng Comput 2002; 40(1):2-13. doi:10.1007/BF02347689.
6. Hatanaka Y, Nakagawa T, Hayashi Y, et al. CAD scheme to detect hemorrhages and exudates in ocular fundus images. Proceedings of the SPIE of Medical Imaging. 2007 Mar 30; San Diego, USA. 2007. doi:10.1117/12.708367.
7. Agurto C, Murray V, Barriga E, et al. Multiscale AMFM methods for diabetic retinopathy lesion detection.IEEE Trans Med Imaging 2010;29(2):502-12. doi:10.1109/TMI.2009.2037146.
8. Ravishankar S, Jain A, Mittal A. Automated feature extraction for early detection of diabetic retinopathy in fundus images. Proceedings of the 22nd IEEE Conference on Computer Vision and Pattern Recognition. 2009 Jun 20-25; Miami, USA. Los Alamitos:IEEE Computer Society Press; 2009. p.210-7. doi:10.1109/CVPR.2009.5206763.
9. Tǎlu S, Cǎlugǎru DM, Lupascu CA. Characterisation of human non-proliferative diabetic retinopathy using the fractal analysis. Int J ophthalmol 2015; 8(4):770-6. doi: 10.3980/j.issn.2222-3959.2015.04.23.
10. Haloi M. Improved microaneurysm detection using deep neural networks. Comput Sci 2015; arXiv:1505.04424.
11. Prentašić P, Lončarić S. Detection of exudates in fundus photographs using convolutional neural networks.Proceedings of the 9th IEEE International Symposium on Image and Signal Processing and Analysis. 2015 Sep 7-9; Zagreb, Croatia. Los Alamitos: IEEE Computer Society Press; 2015. p. 188-92. doi: 10.1109/ISPA.2015.7306056.
12. Tan J H, Fujita H, Sivaprasad S, et al. Automated segmentation of exudates, haemorrhages, microaneurysms using single convolutional neural network. Inf Sci 2017; (420):66-76. doi: 10.1016/j.ins.2017.08.050.
13. Kauppi T, Kalesnykiene V, Kamarainen J, et al. DIARETDB0: evaluation database and methodology for diabetic retinopathy algorithms. 2006.
14. Kauppi T, Kalesnykiene V, Kamarainen JK, et al. DIARETDB1 diabetic retinopathy database and evaluation protocol. Proceedings of the 11st British Machine Vision Conference. 2007 Sep 10-13; Warwick, UK.2007. p.61-5. doi: 10.5244/C.21.15.
15. Decencière E, Zhang XW, Cazuguel G, et al. Feedback on a publicly distributed image database: The messidor database. Image Anal Stereol 2014; 33(3):231-4. doi: 10.5566/ias.1155.
16. Hoover A, Kouznetsova V, Goldbaum M, et al. Locating blood vessels in retinal images by piecewise threshold probing of a matched filter response.IEEE Trans Med Imaging 2000; 19(3):203-10. doi:10.1109/42.845178.
17. Odstrcilik J, Kolar R, Budai A, et al. Retinal vessel segmentation by improved matched filtering: evaluation on a new high-resolution fundus image database. IET Image Processing 2013; 7(4):373-83. doi: 10.1049/iet-ipr.2012.0455.
18. Prasanna P, Samiksha P, Ravi K, et al. Indian Diabetic Retinopathy Image Dataset (IDRiD): a database for diabetic retinopathy screening research. Data 2018;3(3):25-32. doi: 10.3390/data3030025.
19. Kaggle Inc. Diabetic Retinopathy Detection. https://www.kaggle.com/c/diabetic-retinopathy-detection/data. Published 2015; accessed February 28, 2019.
20. Decencière E, Cazuguel G, Zhang X, et al. TeleOphta:machine learning and image processing methods for teleophthalmology. IRBM 2013; 34(2):196-203. doi:10.1016/j.irbm.2013.01.010.
21. Niemeijer M, Ginneken BV, Cree MJ, et al. Retinopathy online challenge: automatic detection of microaneurysms in digital color fundus photographs. IEEE Trans Med Imaging 2009; 29(1):185-95. doi: 10.1109/TMI.2009.2033909.
22. Wong Y, Lam B, Lee J, et al. Development of an automatic retinal image analysis (ARIA) for screening cerebral small vessel disease in the community. J Neurol Sci 2017; 381:959. doi: 10.1016/j.jns.2017.08.2700.
23. Prentasic P, Loncaric S, Vatavuk Z, et al. Diabetic retinopathy image database (DRiDB): a new database for diabetic retinopathy screening programs research.Proceedings of the 8th International Symposium on Image and Signal Processing and Analysis. 2013 Sep 4-6; Trieste, Italy. Los Alamitos: IEEE Computer Society Press; 2013. p.712-6. doi: 10.1109/ISPA.2013.6703830.
24. Winder RJ, Morrow PJ, Mcritchie IN, et al. Algorithms for digital image processing in diabetic retinopathy.Comput Med Imaging Graphics 2009; 33(8):608-22.doi: 10.1016/j.compmedimag.2009.06.003.
25. Lay B, Baudoin C, Klein JC. Automatic detection of microaneurysms in retinopathy fluoro-angiogram. Proceedings of SPIE-the International Society for Optical Engineering. 1984; 432:165-73. doi:10.1117/12.936655.
26. Spencer T, Olson JA, Mchardy KC, et al. An image-processing strategy for the segmentation and quantification of microaneurysms in fluorescein angiograms of the ocular fundus. Comput Biomed Res Int J 1996;29(4):284-302. doi: 10.1006/cbmr.1996.0021.
27. Hipwell JH, Strachan F, Olson JA, et al. Automated detection of microaneurysms in digital red-free photographs: a diabetic retinopathy screening tool. Diabetic Med 2001; 17(8):588-94. doi: 10.1046/j.1464-5491.2000.00338.x.
28. Fleming AD, Philip S, Goatman KA, et al. Automated microaneurysm detection using local contrast normalization and local vessel detection. IEEE Trans Med Imaging 2006; 25(9):1223-32. doi: 10.1109/TMI.2006.879953.
29. Puranik SS, Malode VB. Morphology based approach for microaneurysm detection from retinal image. 2016 Processing of the International Conference on Automatic Control and Dynamic Optimization Techniques.2016 Sep 9-10; Pune, India. Los Alamitos: IEEE Computer Society Press; 2016. p.635-9. doi: 10.1109/ICACDOT.2016.7877663.
30. Kamble R, Kokare M. Detection of microaneurysm using local rank transform in color fundus images.ICIP 2017: Processing of the 24th IEEE International Conference on Image Processing. 2017 Sep 17-20; Beijing, China. Los Alamitos: IEEE Computer Society Press; 2017. p.4442-6. doi: 10.1109/ICIP.2017.8297122.
31. Gwénolé Q, Lamard M, Josselin PM, et al. Optimal wavelet transform for the detection of microaneurysms in retina photographs. IEEE Trans Med Imaging 2008; 27(9):1230-41. doi: 10.1109/TMI.2008.920619.
32. Zhang B, Wu X, You J, et al. Detection of microaneurysms using multi-scale correlation coefficients. Pattern Recognition 2010; 43(6):2237-48. doi: 10.1016/j.patcog.2009.12.017.
33. Antal B, Hajdu A. An ensemble-based system for microaneurysm detection and diabetic retinopathy grading. IEEE Trans Biomed Eng 2012; 59(6):1720-6. doi:10.1109/tbme.2012.2193126.
34. Michael A, Ginneken B V, Meindert N, et al. Automatic detection of red lesions in digital color fundus photographs. IEEE Trans Med Imaging 2009; 24(5):584-92.doi: 10.1109/TMI.2005.843738.
35. Dashtbozorg B, Zhang J, Huang F, et al. Retinal microaneurysms detection using local convergence index features. IEEE Trans Image Processing 2018; 27(7):3300-15. doi: 10.1109/TIP.2018.2815345.
36. Wang S, Tang HL, Turk LIA, et al. Localizing microaneurysms in fundus images through singular spectrum analysis. IEEE Trans Biomed Eng 2016; 64(5):990-1002. doi: 10.1109/TBME.2016.2585344.
37. Xu J, Zhang X, Chen H, et al. Automatic analysis of microaneurysms turn over to diagnose the progression of diabetic retinopathy. IEEE Access 2018; 6:9632-42. doi: 10.1109/ACCESS.2018.2808160.
38. Chudzik P, Majumdar S, Calivá F, et al. Microaneurysm detection using fully convolutional neural networks.Comput Methods Programs Biomed 2018; 158:185-92. doi: 10.1016/j.cmpb.2018.02.016.
39. Budak U, Şengür A, Guo Y, et al. A novel microaneurysms detection approach based on convolutional neural networks with reinforcement sample learning algorithm. Health Inf Sci Syst 2017; 5(1):14. doi:10.1007/s13755-017-0034-9.
40. Dai L, Fang R, Li H, et al. Clinical report guided retinal microaneurysm detection with multi-sieving deep learning. IEEE Trans Med Imaging 2018:1149-61. doi:10.1109/TMI.2018.2794988.
41. Bae JP, Kim KG, Kang HC, et al. A study on hemorrhage detection using hybrid method in fundus images. J Digital Imaging 2011; 24(3):394-404. doi:10.1007/s10278-010-9274-9.
42. Xiao D, Yu S, Vignarajan J, et al. Retinal hemorrhage detection by rule-based and machine learning approach. 2017 39th Annual International Conference of the IEEE Engineering in Medicine and Biology Society.2017 Jul 11-15; Seogwipo, South Korea. Los Alamitos: IEEE Computer Society Press; 2017. p.660-3.doi: 10.1109/EMBC.2017.8036911.
43. Tang L, Niemeijer M, Reinhardt JM, et al. Splat feature classification with application to retinal hemorrhage detection in fundus images. IEEE Trans Med Imaging 2013; 32(2):364-75. doi: 10.1109/TMI.2012.2227119.
44. Inbarathi R, Karthikeyan R. Detection of retinal hemorrhage in fundus images by classifying the splat features using SVM. Int J Innovat Res Sci Eng Technol 2014;3(3):1979-86.
45. Van Grinsven M, Van Ginneken B, Hoyng C, et al. Fast convolutional neural network training using selective data sampling: Application to hemorrhage detection in color fundus images. IEEE Trans Med Imaging 2016;35(5):1273-84. doi: 10.1109/TMI.2016.2526689.
46. Kande GB, Savithri TS, Subbaiah PV. Automatic detection of microaneurysms and hemorrhages in digital fundus images. J Digital Imaging 2010; 23(4): 430-7.doi: 10.1007/s10278-009-9246-0.
47. Akram UM, Khan SA. Automated detection of dark and bright lesions in retinal images for early detection of diabetic retinopathy. J Med Syst 2012; 36(5):3151-62. doi: 10.1007/s10916-011-9802-2.
48. Michael A, Ginneken BV, Meindert N, et al. Automatic detection of red lesions in digital color fundus photographs. IEEE Trans Med Imaging 2005; 24(5):584-92.doi: 10.1109/TMI.2005.843738.
49. Seoud L, Hurtut T, Chelbi J, et al. Red lesion detection using dynamic shape features for diabetic retinopathy screening. IEEE Trans Med Imaging 2016; 35(4):1116-26. doi: 10.1109/TMI.2015.2509785.
50. Adal KM, Van Etten PG, Martinez JP, et al. An automated system for the detection and classification of retinal changes due to red lesions in longitudinal fundus images. IEEE Trans Biomed Eng 2017; 65(6):1382-90. doi: 10.1109/TBME.2017.2752701.
51. Walter T, Klein JC, Massin P, et al. A contribution of image processing to the diagnosis of diabetic retinopathy-Detection of exudates in color fundus images of the human retina. Trans Med Imaging 2002; 21(10):1236. doi:10.1109/TMI.2002.806290.
52. Figueiredo IN, Kumar S, Oliveira CM, et al. Automated lesion detectors in retinal fundus images. Comput Biol Med 2015; 66(C):47-65. doi: 10.1016/j.compbiomed.2015.08.008.
53. Sopharak A, Uyyanonvara B, Barman S, et al. Automatic detection of diabetic retinopathy exudates from non-dilated retinal images using mathematical morphology methods. Comput Med Imaging Graph 2008; 32(8):720-7. doi: 10.1016/j.compmed imag.2008.08.009.
54. Kar SS, Maity S. Automatic detection of retinal lesions for screening of diabetic retinopathy. IEEE Trans Biomed Eng 2018; 65(3):608-18. doi: 10.1109/TBME.2017.2707578.
55. Sánchez CI, Hornero R, López MI, et al. A novel automatic image processing algorithm for detection of hard exudates based on retinal image analysis.Med Eng Physics 2008; 30(3):350-7. doi: 10.1016/j.medengphy.2007.04.010.
56. Li H, Chutatape O. Automated feature extraction in color retinal images by a model based approach. IEEE Trans Biomed Eng 2004; 51(2):246-54. doi: 10.1109/TBME.2003.820400.
57. Wisaeng K, Sa-Ngiamvibool W. Exudates detection using morphology mean shift algorithm in retinal images. IEEE Access 2019; 7:11946-58. doi: 10.1109/ACCESS.2018.2890426.
58. Youssef D, Solouma NH. Accurate detection of blood vessels improves the detection of exudates in color fundus images. Comput Methods Programs Biomed 2012; 108(3):1052-61. doi: 10.1016/j.cmpb.2012.06.006.
59. Osareh A, Mirmehdi M, Thomas B, et al. Comparative exudate classification using support vector machines and neural networks. in:Dohi T, Kikinis R, editors.Medical Image Computing and Computer Assisted Intervention-MICCAI 2002. Berlin: Springer; 2002.p.413-20. doi: 10.1007/3-540-45787-9_52.
60. Osareh A, Shadgar B, Markham R. A computational intelligence-based approach for detection of exudates in diabetic retinopathy images. IEEE Trans Inf Technol Biomed 2009; 13(4):535-45. doi: 10.1109/TITB.2008.2007493.
61. Zhang XW, Thibault G, Decencière E, et al. Exudate detection in color retinal images for mass screening of diabetic retinopathy. Med Image Anal 2014;18(7):1026-43. doi: 10.1016/j.media.2014.05.004.
62. Harangi B, Antal B, Hajdu A. Automatic exudate detection with improved Naïve-bayes classifier. 2012 25th IEEE International Symposium on Computer-Based Medical Systems(CBMS). 2012 Jun 20-22; Rome, Italy. Los Alamitos: IEEE Computer Society Press; 2012.p.139-142. doi: 10.1109/CBMS.2012.6266341.
63. García M, Sánchez CI, López MI, et al. Neural network based detection of hard exudates in retinal images.Comput Methods Programs Biomed 2009; 93(1):9-19.doi: 10.1016/j.cmpb.2008.07.006.
64. Yu S, Xiao D, Kanagasingam Y. Exudate detection for diabetic retinopathy with convolutional neural networks. 2017 39th Annual International Conference of the IEEE Engineering in Medicine and Biology Society(CMBC). 2017 Jul 11-15; Seogwipo, South Korea.Los Alamitos: IEEE Computer Society Press; 2017.p.1744-7. doi: 10.1109/EMBC.2017.8037180.
65. Prentašić P, Lončarić S. Detection of exudates in fundus photographs using deep neural networks and anatomical landmark detection fusion. Comput Methods Programs Biomed 2016; 137:281-92. doi: 10.1016/j.cmpb.2016.09.018.
66. Herbert FJ, Michael JC, Jorge JGL, et al. Automated segmentation of retinal blood vessels and identification of proliferative diabetic retinopathy. J Opt Soc Am A 2007; 24(5):1448-56. doi: 10.1364/JOSAA.24.001448.
67. Welikala RA, Dehmeshki J, Hoppe A, et al. Automated detection of proliferative diabetic retinopathy using a modified line operator and dual classification. Comput Methods Programs Biomed 2014; 114 (3):247-61.doi: 10.1016/j.cmpb.2014.02.010.
68. Lee J, Zee B C, Li Q. Detection of neovascularization based on fractal and texture analysis with interaction effects in diabetic retinopathy. Plos One 2013; 8(12):e75699. doi: 10.1371/journal.pone.0075699.
69. Yu S, Xiao D, Kanagasingam Y. Machine learning based automatic neovascularization detection on optic disc region. IEEE J Biomed Health Inform 2018;22(3):886-94. doi: 10.1109/JBHI.2017.2710201.
70. Roychowdhury S, Koozekanani DD, Parhi KK, et al.Automated detection of neovascularization for proliferative diabetic retinopathy screening. 2016 38th Annual International Conference of the IEEE Engineering in Medicine and Biology Society (EMBC). 2016 Aug 16-20; Orlando, USA. Los Alamitos: IEEE Computer Society Press; 2016. p.1300-3. doi: 10.1109/EMBC.2016.7590945.
71. Goatman KA, Fleming AD, Philip S, et al. Detection of new vessels on the optic disc using retinal photographs. IEEE Trans Med Imaging 2011; 30(4):972-9.doi: 10.1109/TMI.2010.2099236.
72. Nayak J, Bhat PS, Rajendra AU, et al. Automated identification of diabetic retinopathy stages using digital fundus images. J Med Syst 2008; 32(2):107-15.doi: 10.1007/s10916-007-9113-9.
73. Frame AJ, Undrill PE, Olson JA, et al. Texture analysis of retinal neovascularization. Proceedings of the 7th International Conference on Pattern Recognition. 1997 Feb 26-26; London, UK. Los Alamitos: IEEE Computer Society Press; 1997. p.511-6. doi: 10.1049/ic:19970128.
74. Pujitha AK, Jahnavi GS, Sivaswamy J. Detection of neovascularization in retinal images using semi-supervised learning. 2017 14th IEEE International Symposium on Biomedical Imaging (ISBI). 2017 Apr 18-21; Melbourne, Australia. Los Alamitos: IEEE Computer Society Press; 2017. p.688-91. doi: 10.1109/ISBI.2017.7950613.
75. Gupta G, Kulasekaran S, Ram K, et al. Local characterization of neovascularization and identification of proliferative diabetic retinopathy in retinal fundus images. Comput Med Imaging Graphics 2017; 124-32.doi: 10.1016/j.compmedimag.2016.08.005.
76. Morales S, Engan K, Naranjo V, et al. Retinal disease screening through local binary patterns. IEEE J Biomed Health Inform 2017; 21(1):184-92. doi:10.1109/JBHI.2015.2490798.
77. Mookiah MRK, Acharya UR, Martis RJ, et al. Evolutionary algorithm based classifier parameter tuning for automatic diabetic retinopathy grading: A hybrid feature extraction approach. Knowledge-Based Syst 2013; 39:9-22. doi: 10.1016/j.knosys.2012.09.008.
78. Rubini SS, Kunthavai A. Diabetic retinopathy detection based on eigenvalues of the hessian matrix.Procedia Comput Sci 2015; 47:311-8. doi: 10.1016/j.procs.2015.04.001.
79. Bhatkar AP, Kharat GU. Detection of diabetic retinopathy in retinal images using MLP classifier. 2015 15th IEEE International Symposium on Nanoelectronic and Information Systems. 2015 Dec 21-23; Indore, India.Los Alamitos: IEEE Computer Society Press; 2015. p.331-5. doi: 10.1109/iNIS.2015.30.
80. Gardner G, Keating D, Williamson T, et al. Automatic detection of diabetic retinopathy using an artificial neural network: a screening tool. Br J Ophthalmol 1996; 80(11):940-4. doi: 10.1136/bjo.80.11.940.
81. Usher D, Dumskyj M, Himaga M, et al. Automated detection of diabetic retinopathy in digital retinal images: a tool for diabetic retinopathy screening. Diabetic Med 2004; 21(1):84-90. doi: 10.1046/j.1464-5491.2003.01085.x.
82. Szegedy C, Liu W, Jia Y, et al. Going deeper with convolutions. 2015 CVPR: Proceedings of the 28th IEEE Conference Computer Vision and Pattern Recognition.2015 Jun 7-12; Boston, USA. Los Alamitos: IEEE Computer Society Press; 2015. p.1-9. doi: 10.1109/CVPR.2015.7298594.
83. Gulshan V, Peng L, Coram M, et al. Development and validation of a deep learning algorithm for detection of diabetic retinopathy in retinal fundus photographs. J Am Med Assoc 2016; 316(22):2402-10. doi: 10.1001/jama.2016.17216.
84. Quellec G, Charrière K, Boudi Y, et al. Deep image mining for diabetic retinopathy screening. Med Image Anal 2017; 39:178-93. doi: 10.1016/j.media.2017.04.012.
85. Yang Y , Li T , Li W , et al. Lesion detection and grading of diabetic retinopathy via two-stages deep convolutional neural networks. 2017 20th International Conference on Medical Image Computing and Computer-Assisted Intervention (MICCAI). 2017 Sep 10-14; Quebec, Canada. Berlin: Springer; 2017. p.533-40. doi: 10.1007/978-3-319-66179-7_61.
86. Ardiyanto I, Nugroho HA, Rlb B. Deep learning-based diabetic retinopathy assessment on embedded system. 2017 39th Annual International Conference of the IEEE Engineering in Medicine and Biology Society(CMBC). 2017, Jul 11-15; Seogwipo, South Korea.Los Alamitos: IEEE Computer Society Press; 2017.p.1760-3. doi: 10.1109/EMBC.2017.8037184.
87. Khojasteh P, Aliahmad B, Sridhar PA, et al. Introducing a novel layer in convolutional neural network for automatic identification of diabetic retinopathy. 2018 40th International Conference of the IEEE Engineering in Medicine and Biology Society (CMBC). 2018 Jul 18-21; Honolulu, USA. Los Alamitos: IEEE Computer Society Press; 2018. p.5938-41. doi: 10.1109/EMBC.2018.8513606.
88. Gulshan V, Peng L, Coram M, et al. Development and validation of a deep learning algorithm for detection of diabetic retinopathy in retinal fundus photographs. J Am Med Assoc 2016; 316(22):2402-10. doi: 10.1001/jama.2016.17216.
89. Gao ZT, Jie Li J, Guo JX, et al. Diagnosis of diabetic retinopathy using deep neural networks.IEEE Access 2019; 7:3360-70. doi: 10.1109/ACCESS.2018.2888639.
90. Anonymous. FDA permits marketing of first US test labeled for simultaneous detection of tuberculosis bacteria and resistance to the antibiotic rifampin. Clin Infect Dis 2013; 57(8):i-ii. doi: 10.1093/cid/cit548.
91. Fauw JD, Ledsam JR, Romera-Paredes B, et al. Clinically applicable deep learning for diagnosis and referral in retinal disease. Nature med 2018; 24(9):1342-50. doi: 10.1038/s41591-018-0107-6.
92. Eyenuk Inc. Receives health Canada approval for EyeArt™, an AI-enabled cloud-based automated diabetic retinopathy screening software. Business wire website. https://www.businesswire.com/news/home/20180308005485/en/Eyenuk-Receives-Health-Canada-Approval-EyeArt%E2%84%A2-AI-enabled. Published March 8, 2018; Accessed February 28, 2019.
93. Remidio Innovative Solutions. Smartphone-based retinal imaging together with artificial intelligence powers automated, sensitive and early detection of retinopathy. CISION PR Newswire Website. https://www.prnewswire.com/news-releases/smartphone-based-retinal-imaging-together-with-artificial-intelligence-powers-automated-sensitive-and-early-detection-of-retinopathy-676526933.html. Published March 12, 2018; accessed February 28, 2019.
杂志排行

Chinese Medical Sciences Journal的其它文章
- Releasing of The White Paper on Medical Imaging Artificial Intelligence in China
- Constructing Large Scale Cohort for Clinical Study on Heart Failure with Electronic Health Record in Regional Healthcare Platform: Challenges and Strategies in Data Reuse
- Application of Mixed Reality Technology in Visualization of Medical Operations
- Multi-Atlas Based Methods in Brain MR Image Segmentation
- Medical Knowledge Extraction and Analysis from Electronic Medical Records Using Deep Learning
- A Survey of Surgical Patient’s Perception about Anesthesiologist in a Large Scale Comprehensive Hospital in China