Constructing Large Scale Cohort for Clinical Study on Heart Failure with Electronic Health Record in Regional Healthcare Platform: Challenges and Strategies in Data Reuse
2019-07-12DaowenLiuLiqiLeiTongRuanPingHe
Daowen Liu, Liqi Lei, Tong Ruan*, Ping He
1School of Information Science and Engineering, East China University of Science and Technology, Shanghai 200237, China
2Shanghai Hospital Development Center, Shanghai 200041, China
Key words: electronic health records; clinical terminology knowledge graph;clinical special disease case repository; evaluation of data quality;large scale cohort study
Abstract Regional healthcare platforms collect clinical data from hospitals in specific areas for the purpose of healthcare management. It is a common requirement to reuse the data for clinical research. However, we have to face challenges like the inconsistence of terminology in electronic health records (EHR) and the complexities in data quality and data formats in regional healthcare platform. In this paper, we propose methodology and process on constructing large scale cohorts which forms the basis of causality and comparative effectiveness relationship in epidemiology. We firstly constructed a Chinese terminology knowledge graph to deal with the diversity of vocabularies on regional platform. Secondly, we built special disease case repositories (i.e., heart failure repository) that utilize the graph to search the related patients and to normalize the data. Based on the requirements of the clinical research which aimed to explore the effectiveness of taking statin on 180-days readmission in patients with heart failure, we built a large-scale retrospective cohort with 29647 cases of heart failure patients from the heart failure repository. After the propensity score matching, the study group (n=6346) and the control group (n=6346) with parallel clinical characteristics were acquired. Logistic regression analysis showed that taking statins had a negative correlation with 180-days readmission in heart failure patients. This paper presents the workflow and application example of big data mining based on regional EHR data.
R EGIONAL healthcare platforms collect clinical data from hospitals in specific areas for the purpose of healthcare management. It is a common requirement to reuse the data for clinical researches. Shah et al. set up a typical example of such reuse.1They found associations of type 2 diabetes with a wide range of incident cardiovascular diseases based on regional electronic health records.The dataset they used is from CArdiovascular disease research using LInked Bespoke studies and Electronic health Records (CALIBER) program. Denaxas et al.2gave a detailed description of CALIBER. They integrated data from difference sources, including the primary care data from the Clinical Practice Research Datalink(CPRD), disease registration data from the Myocardial Ischaemia National Audit Project (MINAP), the secondary care data from the Hospital Episodes Statistics(HES), and mortality and social deprivation data from the Office for National Statistics (ONS), upon which they constructed a regional dataset with populations in UK. Rea et al. explored an end to end data processing flow, normalizing disparate data to common objects with standard terminologies. They also implemented a prototype platform to perform transport, data normalization and common phenotyping services on disparate electronic health record (EHR) data. Abrahão et al.3proposed a method to allow a peproducible cohort extraction for use of secondary data in observational studies. Especially, they described the process of cleaning EHR data and constructing cohort, and finally get a cohort for cardiovascular disease with 27,698 patients. The main difference between our work and theirs is that we focus on the EHRs from regional healthcare platform but their data comes from one hospital merely.
In order to conduct observational studies with the EHR data more effectively, considerable efforts have been made to apply predictive modeling to mine EHR data. For example, Jin et al.4employed word vectors to model the diagnosis events and predict the risk of heart failure events using long short-term memory network model. Lei et al.5applied recurrent neural network based denoising autoencoder to learn patients’ representation with time series information in EHR data, and used the representation to predict health status, such as mortality prediction, disease risk prediction and similarity analysis. Google6proposed a representation of patients’ EHRs based on the Fast Healthcare Interoperability Resources (FHIR) format.Deep learning models using their representation are capable of accurately and effectively predicting multiple medical events from multiple centers. Shanghai Regional Healthcare Platform has stored EHRs from 38 top hospitals in Shanghai for more than ten years.We tried to find the methodology to reuse the data for clinical researches. We built an interdisciplinary team of clinicians, clinical information experts, computer engineers and data analysts. The following challenges were encountered.
(1) The overall process. The research process can be driven from three different aspects, i.e., research topic-driven, method-driven and data-driven.For research topic-driven, clinicians raise the research topic firstly. As to data-driven, the computer engineers collect and clean all the required data, and then data analysts analyse the data with help from clinicians for medical discoveries. If the computer programs are intelligent enough, we may use method-driven approach to re-organize the noise data to find possible medical discoveries.
(2) The terminologies issue. The regional EHR data consists of data from various hospitals. Hospitals have different data dictionaries and each clinician use his own terminologies. For example, although disease coding specifications such as ICD10 are enforced by the government, most clinicians do not use the disease codes correctly. As to the disease names, they may use different expressions to describe the disease. The similar problems happen to procedures, and ICD-9-CM codes are used. The other clinical terminologies such as laboratory tests and symptoms are worse, and they even do not have standards. In such cases, it is diffi-cult to find all patients who have abnormal laboratory test results or special diseases. Therefore, it is an inevitable task to unify the terminologies of hospitals and clinicians to construct a clean disease case repository.
(3) Data quality and data format issue. EHR data is generated from the patient’s actual diagnoses and treatments, and its purpose does not directly target at scientific researches. In other words, a patient record in good quality for clinical practice may not necessarily meet the needs of scientific researches. The EHR data does not contain enough data columns, for example,death records are not complete, since not all patients died in hospitals. Besides, some data are redundant for research purpose, for example, the disease diagnoses appear in multiple places, such as the discharge abstract, the admission records, and the first page of medical records.
(4) Data mining and analysis methods. Randomized clinical trials are used in traditional medical researches for comparative effectiveness research.However, there is no clinical control group in the big data scenario. How to construct the causal relationship between medical events becomes important. At the same time, although deep learning methods outperform traditional machine learning methods on disease prediction and treatment decision, their interpretability is relatively poor and difficult to be understood by human.
In this paper, we address the above problems. We aslo demonstrate the end-to-end process from constructing heart failure repository for building and utilizing a large scale cohort to conduct research of comparative effectiveness on the treatment of heart failure.
THE OVERALL PROCESS OF CLINICAL BIG DATA MINING BASED ON REGIONAL MEDICAL EHRS
The EHR data for the regional platform consists of patient data from multiple hospitals. Each hospital integrates data from Hospital Information System(HIS), Laboratory Information System (LIS), Radiology Information System (RIS), and Picture Archiving and Communication System (PACS). Each hospital integrates EHR data and uploads it to the regional platform. Specifically, the regional platform defines a series of data standard, and then hospitals uploads corresponding EHR data to the front-end machine of each hospital, the regional platform collect, merge and store the data into a centralized database. Based on the patient’s identification information, namely Medical Insurance Card or ID card, the patient’s information from different hospitals has been integrated in regional platform. Subsequently, the regional platform operates data masking to protect the patients privacy for consequent research usage. Therefore data privacy is not discussed in this paper. The overall process of clinical big data mining based on the regional EHRs is illustrated in Figure 1.
Constructing special disease case repositories
Special disease case repositories are constructed from EHRs on regional platform. We build a repositoriy for heart failure. Firstly, we selected patients by disease names and its ICD codes, and all information related to the patients is extracted. After that, data quality assessment of the repository is executed to check whether the information contained is good enough for subsequent data mining. Evaluation metrics we used included data completeness, data consistency, medical code consistency, and data accuracy. If the special disease case repository meets the assessment requirements, especially about data completeness, we will start the second step, namely data cleaning step.

Figure 1. The overall process of clinical big data mining based on the regional EHRs. HIS, hospital information system;LIS, laboratory information system; PACS, picture archiving and communication system; RIS, radiology information system; GBDT, gradient boosting decision tree; ICD, International Classification of Diseases; SNOMED, Systematized Nomenclature of Medicine; LOINC, Logical Observation Identifier Names and Code; CRF, case report form.
Data cleaning
The second step is performed to clean the special disease case repository. Firstly, clinical experts define the Case Report Forms (CRFs) or disease model which hold all the required features of each patient in order to conduct researches on the disease. Then, feature preprocessing rules are defined according to the information in CRFs. Afterwards, Chinese terminology knowledge graphs are built to normalize different vocabularies of the same terminology by multiple hospitals. The Chinese terminology knowledge graphs learn from various existing ontologies, including Systematized Nomenclature of Medicine-clinical Terminology(SNOMED-CT),7International Classification of Diseases (ICD), and Logical Observation Identifiers Names and Codes (LOINC).8In addition, in order to comply with usage habits of clinicians, we integrate disease,diagnosis and other data from regional health platforms into Chinese terminology knowledge graphs to better normalize terminologies. With the CRFs and the terminology graphs, a cleansed special disease case repository containing all cases and related features is constructed.
Cohorts construction for particular research topics
In the third step, cohorts9are built for special research topics. First of all, the goal of the research should be determined by clinical experts, and then inclusion and exclusion criteria10are defined to select patients with the study. Study variables and outcome events are also described. After construction of the cohort, analysis on the baseline characteristics may be performed to get the statistical description about the cohort.
Model selection and experiments implementation
The last step is to select the appropriate big data mining model11as well as to design and implement the experiments. Typically, there are two kinds of models,one is based on traditional regression models to discover associations in cohorts, for example, COX model;the other is machine-learning algorithms such as risk prediction. For the former one, we use the Propensity Score Matching (PSM)12to control and eliminate the selection bias caused by confounding variables. For the machine-learning algorithms, there are lots of issues such as feature selection and feature engineering. In our previous publication on about risk prediction on EHR data,13the major challenges encountered were discussed.
Currently, regional platform in Shanghai contains only structure data, the healthcare management bureaus in shanghai plan to collect clinical text data and follow-up data in the near future. In such cases, natural language processing techniques will be required to structure texts, such as named entity recognition,14entity linking,15and relationship extraction16techniques.
CONSTRUCTING A CLINICAL SPECIAL DISEASE REPOSITORY BASED ON CHINESE TERMINOLOGY KNOWLEDGE GRAPH
Complexity of medical terminology in EHRs data
The same medical terminologies are expressed differently by different clinicians in EHR data. For example,a symptom may have multiple expressions, such as“pre-contraction(期间收缩)”, “premature beat (过早搏动)”, and “premature beat (早搏)”. We call them synonyms. Furthermore, a symptom is often modified by different words to express a slightly different semantic meaning, such as “acute back pain (急性背痛)”, and“chronic back pain (慢性背痛)”. They are hyponyms of“back pain(背痛)”.
While there are many terminology systems such as ICD codes and LOINC, the medical terminology graph lacks commonly used vocabularies for symptoms, laboratory tests, and diseases. Take laboratory indicators as an example, “serum sodium (血清钠)” has more than 10 different expressions in real EHR data,such as “sodium ion concentration (钠离子浓度)” , “NA+”,and “arterial blood sodium (动脉血钠)”. Because of the lack of a complete commonly used dictionary for laboratory indicators, different descriptions of the same laboratory indicators by different hospitals have also brought difficulties to regional clinical research.
Therefore, it is necessary to establish a complete and comprehensive knowledge graph of Chinese medical terminologies, especially to include vocabularies that have been used in daily clinical practice. The vocabularies can be expressed as synonyms, hypernym and hyponym relationships to normalize terminology in the Chinese terminology graph. Then the terminology in EHRs can be linked and normalized to standard expression more easily, which promotes the construction of specific disease repositories.
Construction of Chinese medical terminology knowledge graph
A variety of medical classification systems and ontologies have been established abroad. Common medical classification systems and ontologies include Unified Medical Language System (UMLS),17Medical Subject Headings (MeSH),18and SNOMED-CT. There are also several fine-grained ontologies and systems, such as RxNorm19which distinguishes different type of medicine concepts, LOINC for laboratory tests, gene ontology and ICD systems. Moreover, based on these systems, oversea researchers have built multiple medical dataset platforms and published a large number of open-link datasets. The well-known open-link datasets include Linked Open Drug Data (LODD),20Linked Life Data21and Bio2RDF.22The publishment of these openlink datasets has greatly facilitated the researches in the field of medicine.
Currently, the Chinese version of SNOMED-CT has been released. However, the SNOMED-CT system is quite different from the Chinese clinical system and does not meet the usage habits of Chinese clinicians.To process EHR data of regional platform, the first task is to establish Chinese terminology knowledge graph that is consistent with the practical habit of Chinese healthcare workers.
Combined with the actual situation of Chinese hospitals, we built a Chinese terminology knowledge graph based on some international medical knowledge graphs.We extended ICD system with commonly used vocabularies for diseases. We choose frequently used terminologies from LOINC and maped them with vocabularies in EHR. We also used some terminologies from medical web sites, as described in our previous paper.13Based on automatic extraction method, we first obtained the different descriptors for diseases, symptoms and laboratory tests from the regional EHR data. Then we utilized synonym detection algorithms23and hypernym detection algorithms24,25to link those different medical terminologies to the terminology knowledge graph. We will introduce the schema diagram of the Chinese terminology knowledge graph and the synonym detection algorithm for laboratory tests in this section.
Schema diagram
With the help of clinical experts, we manually created a schema of medical terminology knowledge graph based on medical knowledge, including concepts,conceptual attributes, and hierarchical relationships between concepts. Figure 2 shows the schema of the Chinese medical terminology knowledge graph. We defined eight top-level concepts including symptoms,diseases, medicines, departments, examinations, body structures, laboratory tests, and procedures. “Medicine” is subdivided into two sub-concepts of “Chinese medicine” and “Western medicine”. The concepts are connected through relationships such as “disease-related medicines”, “disease-related departments”, “disease-related tests”, and “finding sites”. Each concept is given several instances which may be defined by“synonym” relationship because they are the same meaning form different sources, or a “hypernym and hyponym” relationship. For example, “meningeal carcinomatosis(脑膜癌)” recorded in a hospital and “meningiomas(脑膜瘤)” in ICD10 are synonymous; those two words are the hyponym of “tumor”.
The synonym detection algorithm for laboratory tests
In terms of laboratory tests, aiming at laboratory indicator normalization in regional medical health platform,we proposed a normalization algorithm framework for laboratory indicators. The overall flow of the laboratory indicator normalization algorithm is shown in Figure 3. First, the preprocessing steps for laboratory indicators include unit normalization and extracting indicators reference. Then, using the character features of the laboratory indicators, the density-based clustering algorithm is used to cluster different laboratory indicators into groups to narrow the scope of the laboratory indicators for normalization. A standard name is determined for each group of laboratory indicators, and binary classification algorithms are used to find synonyms of the standard name within the group. For the remaining non-synonym indicators, a new standard name is selected, and the binary classification algorithm is used to search for the synonymous indicators.This process iterates till all groups are synonymous or only one laboratory indicator remains in the group.Finally, the clinical experts check and correct the laboratory indicators normalization results.
It should be noted that clustering algorithm has two problems because it is an unsupervised learning process. 1) The laboratory indicators are clustered into one group owing to similar names or similar abbreviations, but they actually have different medical meanings; 2) some outliers are not core objects, so that they are not clustered. Therefore, the clustering results need post-processing. Post-processing steps are as follows:

Figure 2. Schema diagram of Chinese medical terminology knowledge graph.
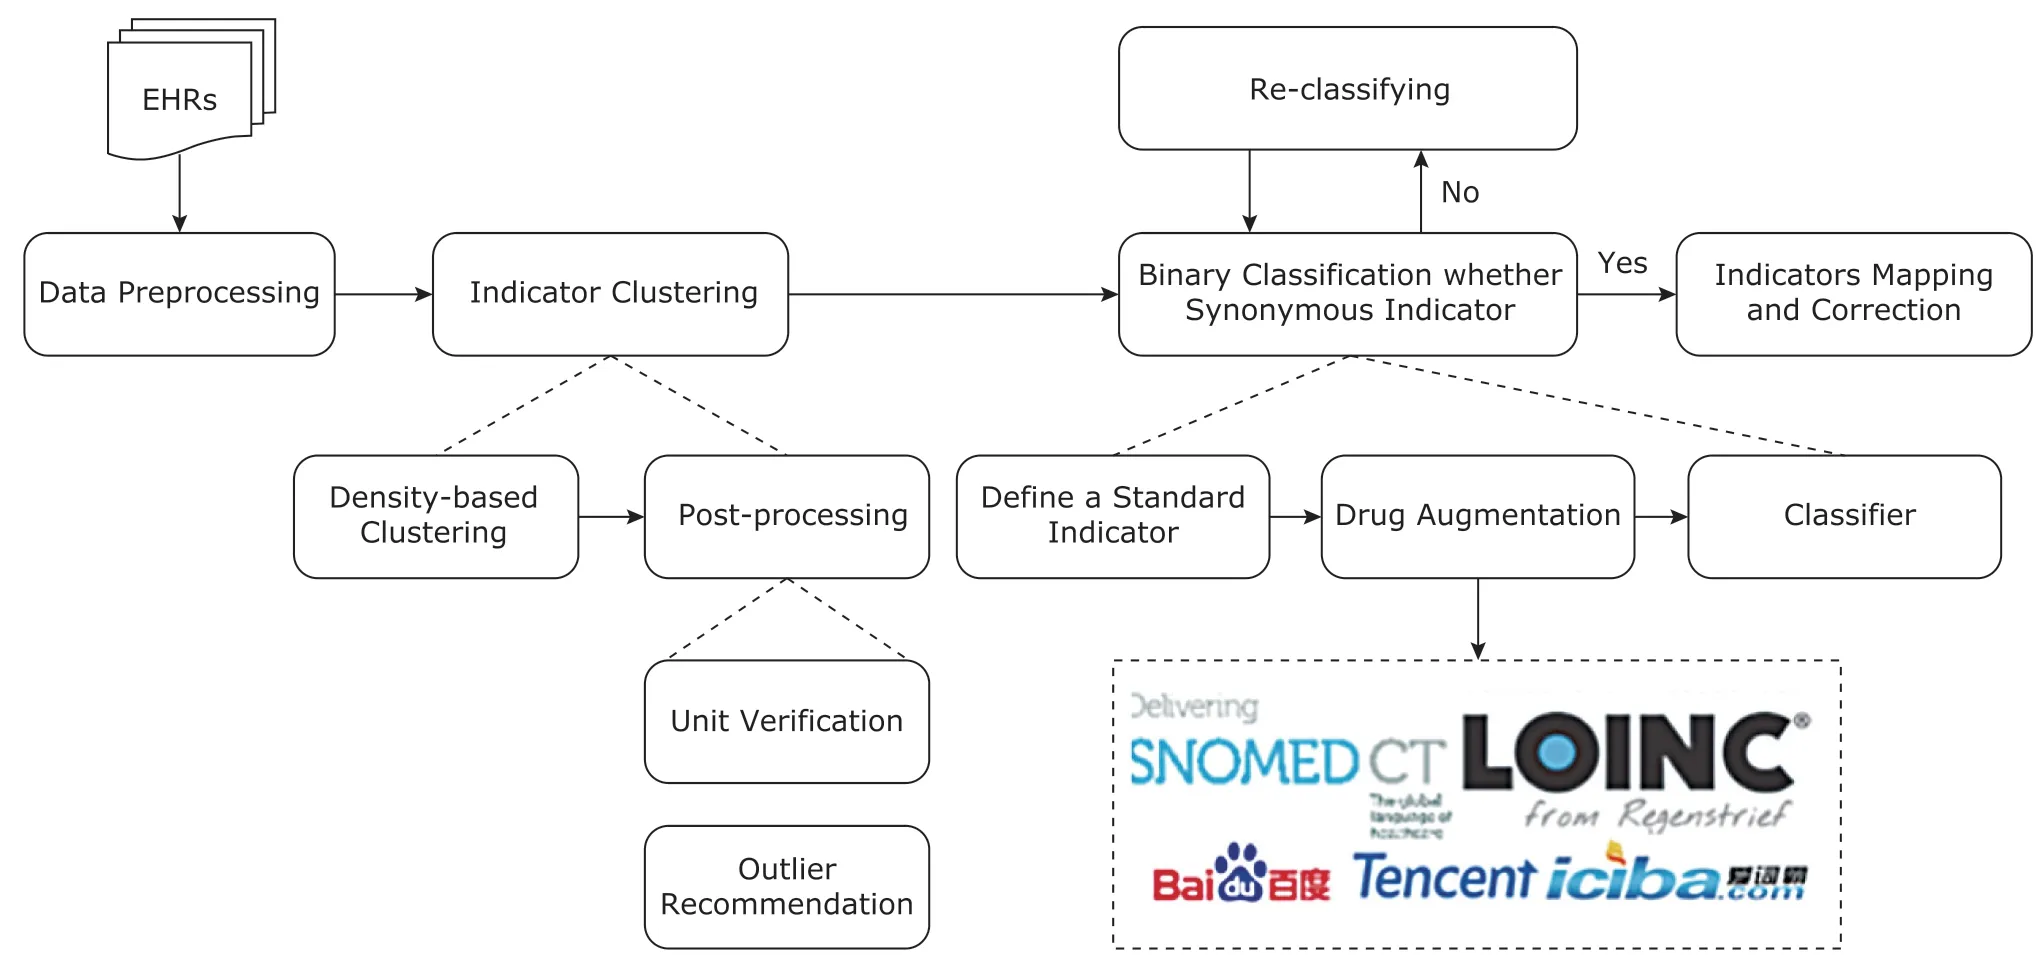
Figure 3. The framework for normalization of laboratory indicators.
1. Unit verification. Assuming that the units of the synonym indicators are the same, unit verification can be performed for each group, and the indicators of different units will be separated into different groups.
2. Outlier recommended. For each outlier that are not clustered, it is likely to be a completely new laboratory indicator because the outlier is far away from other groups.
The results of laboratory indicators clustering are shown in Table 1. It can be seen that the Density-Based Clustering Algorithm (DBSCAN) has significantly higher F1-score than the other four clustering algorithms, and the improvement range is above 10%.However, the recall of our method can reach 91.36%,and the precision is not good enough. In order to improve precision, it is necessary to conduct the binary classification mapping.
To investigate the influence of different features and the performance of different classification models,we select the various combinations of three features including name, abbreviation (Abbr.) and reference value (Ref.). They are compared with different classification models such as Logistic Regression (LR), naive Bayes (NB), k-Nearest Neighbor (kNN), Support Vector Machine (SVM), Random Forest (RF), and Gradient Boosting Decision Tree (GBDT). By comparing the experimental results with F1-score, the GBDT algorithm is superior to other classification algorithms, so the GBDT model is used for binary classification.
We compared our method with the knowledge graph fusion method (KG Fusion), diagnostic alignment method (Diag. Alignment) and knowledge base alignment method (KB Alignment). The results are shown in Table 2. Although our method is slightly lower in precision than KB Alignment method, it has the best recall and F1-score.
With the help of synonym detection algorithms and hypernym detection algorithms, we have constructed the Chinese terminology knowledge graph.The data we fetched from regional health platform contains 57,729 disease phrases. Though ICD system contains 31,898 unique diseases, we only match 9,995 diseases by synonym detection algorithm. Besides, we supplement 28,692 hyponyms by hypernym detection algorithm. In regional health platform, there exists 12,624 original laboratory test concepts. Filtered and merged by synonym detection algorithm, there exists 2,395 unique concepts. In addition, the Chinese terminology knowledge graph also contains 35,279 symptom concepts and 13,370 operation concepts which are manually checked by clinicians.

Table 1. Performance comparison of different clusteringalgorithms
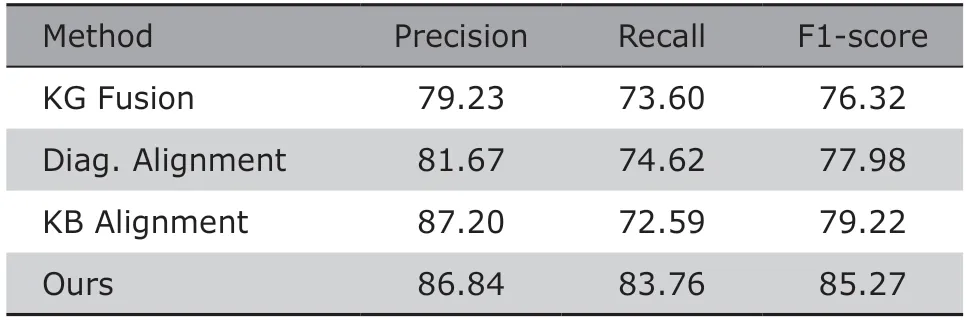
Table 2. Performance comparison with existing entity alignment methods
The construction and data cleaning of clinical heart failure repository
In order to analyze special disease, it is preferred to get all data stored in one repository. Here, we take heart failure for an example. There are three steps in the construction and data cleaning of the heart failure repository:
Step1: Determining patients of heart failure
The patients are selected based on the ICD codes and the disease names “heart failure”. Considering the different versions of the hospital information systems, all the codes related to heart failure in ICD9 and ICD10 are used to extract the patients. However, disease names of heart failure recorded in EHRs may not have a corresponding ICD code. It is difficult to extract all the medical records of the disease by using its ICD code alone, so the disease name of heart failure and its synonyms are considered as well. This process can be assisted by Chinese terminology knowledge graph that we built before.
Step 2: Identifying rules of feature preprocessing
The definition of the feature preprocessing rules is derived from the information in case report forms(CRFs).26CRF is a specialized document in clinical research, but the terminologies in CRF are not totally the same as those in the literatures. So the terms in clinical record texts need to be normalized. Meanwhile,the CRF can also be regarded as a disease model to describe all the possible related features. However, we use the term CRF instead of disease model because it is easier to understand by clinicians.
Part of Heart Failure CRF is shown in Table 3.The first column describes the category of features in CRF, such as population information, prescription, and laboratory test. The second column records the features defined by clinical experts in the CRF of heart failure. The third column introduces the format of possible feature values. For example, the information of heart function level is necessary for heart failure patients. It can be extracted from the first page of medical record.
According to the CRF, the preprocessing rules of regional data are defined in Table 4. The first column is the source table name in regional EHR database,and the second column is the feature name of the source table from which the target features is extracted. The preprocessing rules are described in the third column. For instance, we obtain the hospitalization date and birth date in patient information table, and the patient’s age equals to hospitalization date minus birth date. Similarly, the heart function level should be derived from the diagnostic instructions in diagnostic details table, and heart function level I, II, III, and IV are mapped as “1”, “2”, “3”, and “4” respectively.
Step 3: data cleaning based on terminology normalization
Based on the preprocessing rules, we obtain the information of medications, diagnoses, procedures and laboratory tests that the doctor wishes to get from the EHR data. There are two types of data cleaning methods. One is to obtain information directly from the special case repository, such as the results of laboratory tests, diagnoses and medications. In particular, we need to normalize the name of medical terminologies before extracting information directly. The synonym and hypernym and hyponym relationships of Chinese terminology knowledge graph are used in this step.The second data cleaning method is to perform calculations on some features to obtain derived information.For example, the information of readmission time does not exist in the special case repository, and it can be derived by certain calculations (i.e., the next admission date minus the discharge date).
EHR data quality assessment
Several factors may lead to quality problem of the special disease case repository, which prevents the disease case repository being reused. For example, inconsistency and incompleteness of EHR data. Therefore,data quality assessment27of EHRs is a crucial step forclinical analysis.The quality assessment processes we use in this paper has been proposed in a special paper.28In detail, the process consists of six steps: (1) using the Delphi process29,30to collect assessment requirements; (2) identifying and collecting EHR data based on the assessment requirements, and the dataset (i.e.,the special disease case repository) is constructed to be evaluated; (3) mapping assessment requirements to the dataset; (4) proposing quality assessment met
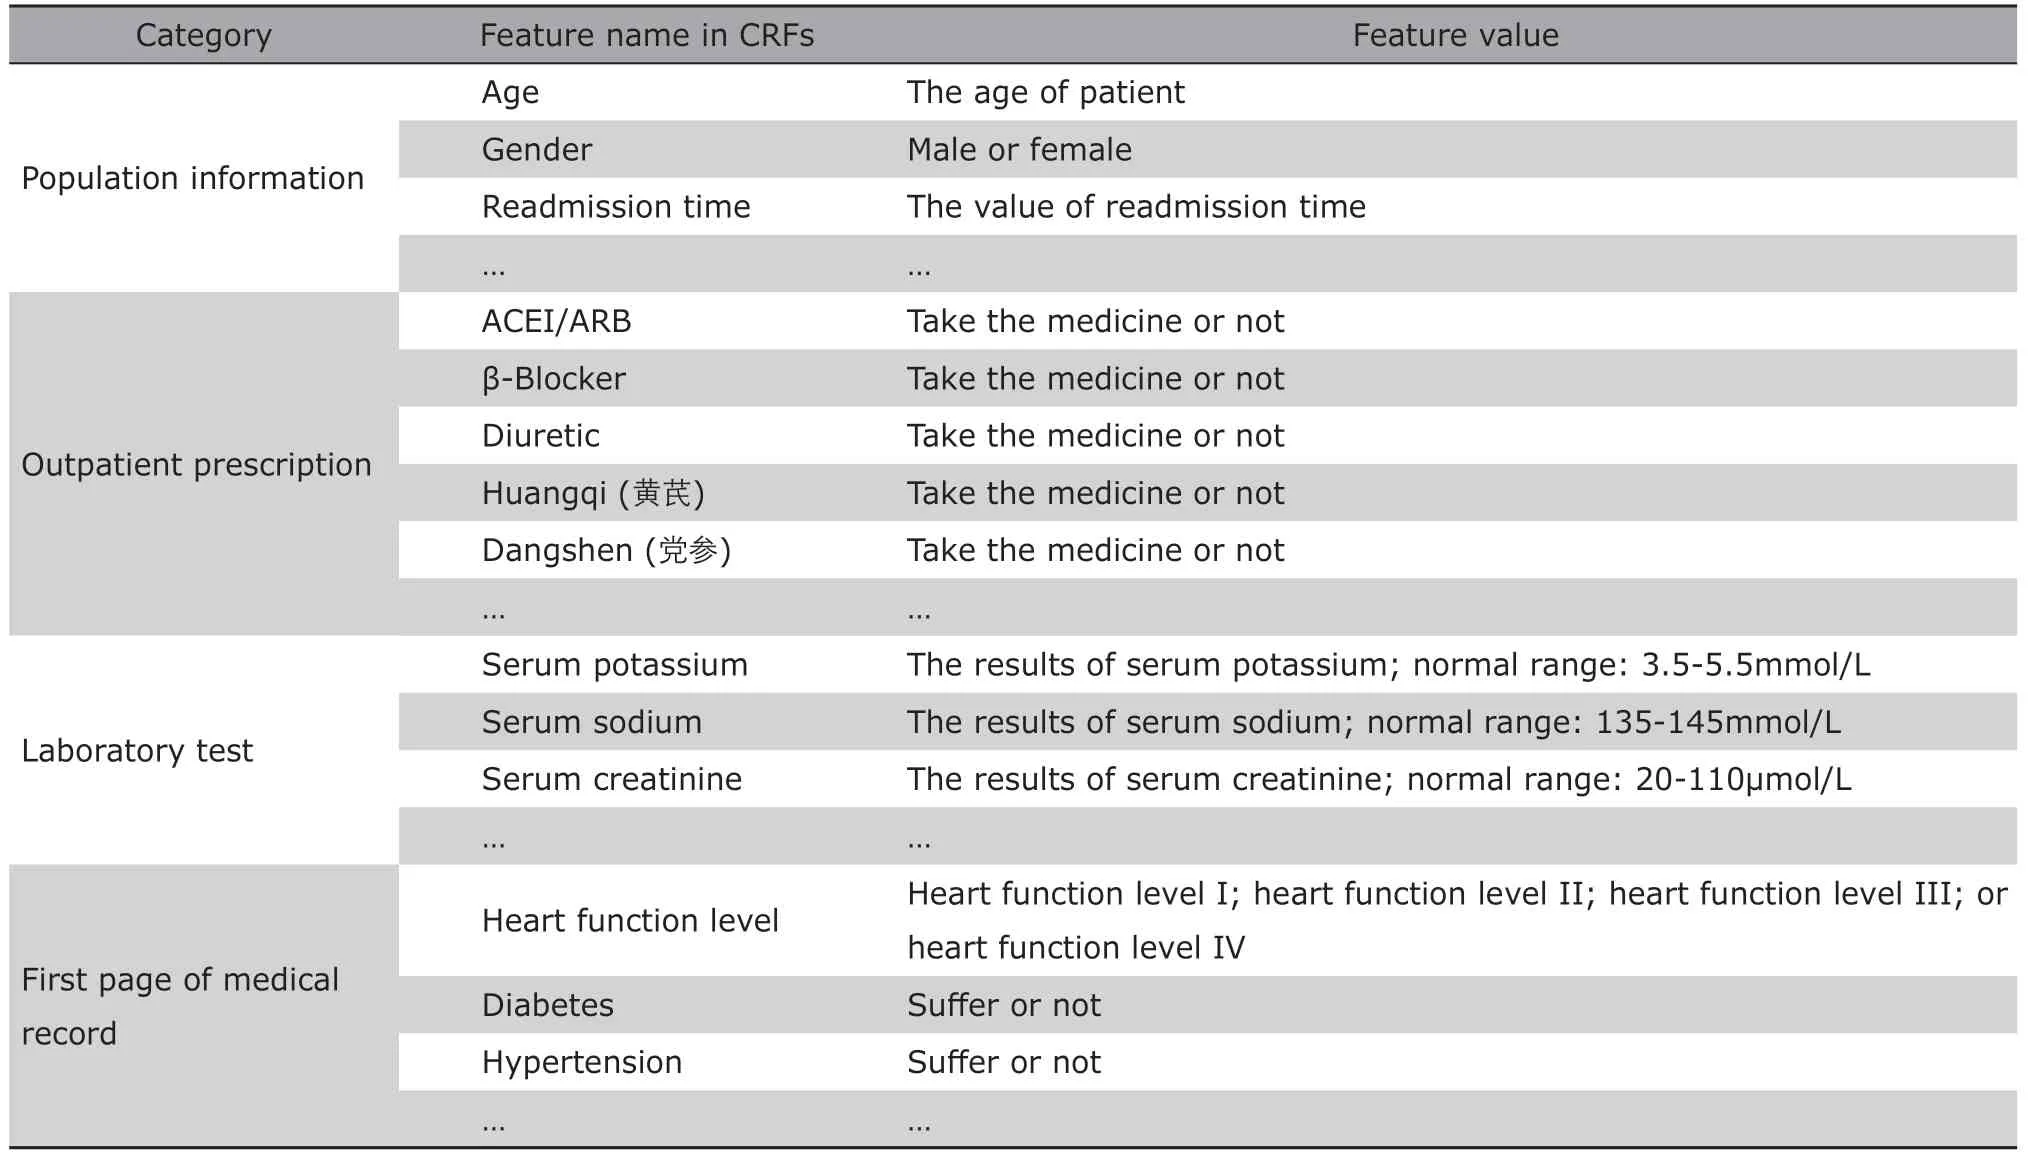
Table 3. Sample of case report form for heart failure
rics. Metrics are selected or defined based on the purpose of using the dataset; (5) performing data quality assessment. Each quality assessment metric is given a score based on the scoring criteria; (6) analyzing the assessment results. The quality of the dataset is analyzed to determine if the dataset is suitable for research.
A part of evaluation contents is described in Table 5. Take the disease code for an example, we evaluate the completeness and consistency of it. In details,patients in heart failure repository must have the information of disease code to identify the realated disease.Moreover, the expressions of the disease code need to satisfy the Chinese standrad.

Table 4. The preprocessing rules to convert features from source table to target CRF
DATA ANALYSIS BASED ON COHORTS
Cohort construction based on heart failure repository
Research topic is defined according to the requirements of clinicians who design the study. For instance,they want to find out the effect of taking statins or traditional Chinese medicine in patients with heart failure. Although benefits of statin treatment have been demonstrated in many patient groups, its effects in heart failure patients with reduced ejection fraction are still controversial.31Therefore, we conduct an experiment to verify whether statins are associated with improved outcomes utilizing the regional EHR data.
Based on this goal, we define the inclusion and exclusion criteria to construct a cohort based on the EHR data in the heart failure repository that we built before. The heart failure repository has totally 178,628 patients from 38 top hospitals in Shanghai, among which, 75,598 patiens from January 2012 to June 2016 was used for the research. The inclusion criteria for the cohort are : 1) patients are 40 years old or older; 2)patients have at least two inpatient records. Patients who have only one inpatient record are excluded because it is impossible to determine the time of readmission for those patients. Figure 4 shows the flow of patients selection for heart failure cohort based on the heart failure repository. The cohort of heart failure resulted in a dataset of 29,647 patients, which is 16.6%of all patients in the heart failure repository.

Table 5. Evaluation contents of heart failure repository

Figure 4. The flowchat of patients selection for the cohort of heart failure.
Comparison of therapeutic effects based on propensity score analysis
As the research aims to investigate the effect of taking statins in heart failure patients, based on this objective, whether patients take statins is the study variable, and patient’s age, gender, medication, and other information are confounding variables. The outcome event is 180-day readmission. The time period between the date of discharge and the date of next admission is the readmission time. If the readmission time exceeds 180 days, the label of 180-day readmission is set to 0, otherwise it is set to 1.
According to the study variable, the cohort patients population is divided into the study group(i.e.,patient who take statins) and control group (i.e.,patients who do not take statins). The ideal situation is that the confounding variables between the study group and the control group are parallel. Unfortunately,statisital analysis found that the value of confounding variables in the two groups were typically unparalles,>which may affect the outcome event as well.
To eliminat the affect of the confusing variables,we conducted the propensity score matching (PSM)proposed in the work of Caliendo et al.32The five steps are performed as follows: (1) Run logistic regression analysis and get the propensity score; (2)check that propensity score is balanced across study group (use Statin) and the control groups;(3) match each patient in the study group to one or more patients in the control group on propensity score; (4)verify that confounding variables are balanced across study and control groups in the matched sample;(5)multivariate analysis based on new sample. We used all the records of patients who met the inclusion and exclusion criteria in executing PSM. We used Caliper matching33in this paper to reduce bias. In particular,we randomly extracted a patient namely Pafrom the study group, and then selected one or more patients Pbin the control group by the following condition: the difference between the propensity score of Paand Pbmust within the given caliper (i.e., a threshold such as 0.05). We repeated the operation until all the patients in the study group got the matched ones in the control group.
As shown in Figure 5, there is a significant difference in the propensity scores between treatment group and control group for the original cohort population,which indicates the unbance of the confounding variables between the two groups. The propensity scores of the two group in the mached cohort were parallel,although the total number of patients decreased from 29,647 to 12,698.
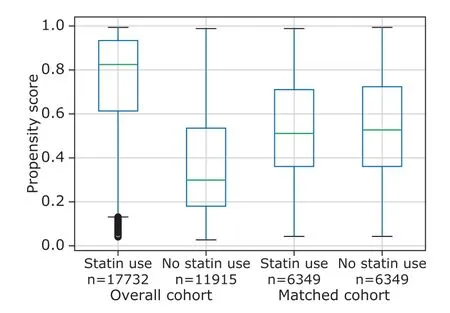
Figure 5. Box plot presentation of propensity scores for statin use in the unmatched and matched cohorts. Boxes represent median and interquartile range; whiskers represent minimum and maximum (if not outliers). Outliers are displayed with circles and are defined as observations>1.5 times the interquartile range from the first or third quartile, respectively.
Logistic regression analysis was then performed based on the matched cohort. The P value of taking statins on patient’s 180-day readmission is 0.0123. We used the same method to match and analyze patients who take Chinese medicine, and P value of taking Chinese medicine on the patient’s 180-day readmission is 0.1798 instead. Taking significance level as 0.05, the result showed that taking statins had a significant effect on 180-day readmission for patients with heart failure. The logistic regression coefficient was -0.2239, which represents a negative correlation between taking statin and 180-day readmission. That is to say, taking statins can reduce the risk of 180-day readmission.
SUMMARY
Although there are huge amount of EHR data on regional health platform, the medical terminologies of each hospital are extremely inconsistent. To address these shortcomings, this paper presents the workflow and application example of big data mining based on regional EHR data.The major contributions of our work are as follows:
We present a methodology and an overall process for second-use of the electronic healthcare data on a regional platform. The methodology combines topic-driven approach and data-drive approach. Clinicians give CRFs to describe all related medical events about a special disease, and computer programs extract data from regional platform according to the CRFs to form special disease case repositories. Then, a data quality profile is returned to the clinicians to give them a detailed understanding of the data. The clinicians can conduct different clinical studies based on these data,such as cross-sectional studies, longitudinal studies,and artificial intelligence applications studies such as disease risk predictions. In this paper, we focus on building prospective cohort since it forms the basis of discovering associations between events.
The unified terminology system is an important basis for dealing with the diversity of vocabulary issues. We construct a Chinese clinical terminology knowledge graph containing symptoms and hyponymies between clinical terminologies. We build the special disease case repositories with the knowledge graph selecting special diseases and normalizing the data.
For future work, to keep the special disease case repository containing more complete information, we may use natural language processing techniques to process medical texts in regional data. Follow-up data may be collected as well when there is data missing in the special disease case repository. In addition, more big data mining algorithms will be applied to clinical researches.
Conflict of intrests statement
All authors declared no conflicts of interest.
猜你喜欢
杂志排行

Chinese Medical Sciences Journal的其它文章
- Releasing of The White Paper on Medical Imaging Artificial Intelligence in China
- Application of Mixed Reality Technology in Visualization of Medical Operations
- Multi-Atlas Based Methods in Brain MR Image Segmentation
- A Survey on Intelligent Screening for Diabetic Retinopathy
- Medical Knowledge Extraction and Analysis from Electronic Medical Records Using Deep Learning
- A Survey of Surgical Patient’s Perception about Anesthesiologist in a Large Scale Comprehensive Hospital in China