基于近红外光谱的灌浆期玉米籽粒水分小样本定量分析
2018-08-10马铁民谢秋菊陈争光
王 雪,马铁民,杨 涛,宋 平,谢秋菊,陈争光
基于近红外光谱的灌浆期玉米籽粒水分小样本定量分析
王 雪1,2,马铁民2,3,杨 涛1※,宋 平1,谢秋菊2,陈争光2
(1.沈阳农业大学信息与电气工程学院,沈阳 110866; 2. 黑龙江八一农垦大学电气与信息学院,大庆 163319;3. 东北大学计算机科学与工程学院,沈阳 110819)
玉米灌浆期含水率测定是考种育种的重要指标。为了节约样本且快速准确测定灌浆期玉米水分,该文应用近红外光谱技术,提出了基于小样本条件下的自举算法(Bootstrap)与基于-距离结合的样本划分方法(SPXY, sample set partitioning based on joint-distances)相结合的样本优化方法的偏最小二乘(PLS,partial least square)水分定量分析模型Bootstrap-SPXY-PLS模型。试验结果表明,当Bootstrap重抽样本次数等于500,样本数量大于等于10时,模型的性能稳定,并且随着样本数量增加,重抽样本次数相对减少;样本数量为10和50时,全谱Bootstrap-SPXY-PLS模型的预测均方根误差(RMSEP, root-mean-square error of prediction)均值分别为0.38%和0.40%,预测相关系数(correlation coefficients of prediction)分别为0.975 1和0.968 5,决定系数2分别为0.999 9和0.993 6;基于竞争性自适应重加权采样算法(CARS,competitive adaptive reweighed sampling)波长变量筛选后的CARS-Bootstrap-SPXY-PLS模型的预测均方根误差RMSEP均值分别为0.36%和0.35%,预测相关系数分别为0.973 6和0.975 0,模型决定系数2分别为0.924 5和0.918 0。因此,全谱Bootstrap-SPXY-PLS模型和CARS-Bootstrap-SPXY-PLS模型均具有稳定的预测能力,为玉米育种时灌浆期种子水分测定提供了一种稳定、高效的方法。
近红外光谱;水分;模型;定量分析;小样本集;灌浆期玉米籽粒;Bootstrap重抽样本;样本优化选择
0 引 言
近红外光谱及其分析技术越来越多地被应用于农业、食品、工业等领域的质量定性分析[1-3]和成分快速测定[4-7]中,研究中样本规模一般在100~200之间[8-11]。在玉米育种时,由于受繁育新品种的种植面积,每平方米可以种植的玉米植株数目,有效试验穗数量等客观条件所限,灌浆期玉米水分测量时样本的取样数量、取样成本等受到一定限制。然而,灌浆期是玉米品种变化和育种考种的关键期,传统烘干水分测定方法取样时只选取中间的150~250粒进行百粒质量水分测量[12],因而需要大量样本。因此,研究小样本、高效率水分测量方法是玉米育种过程中急需解决的问题之一。
在近红外光谱分析领域中,样本量是影响算法性能及预测能力的关键。一般情况下样本数量越少,样本检验模型的有效率就会越低,所以在应用中找到小样本数量的临界值非常重要。Bootstrap算法,由Efron教授在1979年提出[13],广泛应用于化学计量学样本检验方法的改进。近年来,许多研究者提出了应用Bootstrap重抽样本方法进行小样本条件下的数据分析。大部分研究者认为Bootstrap方法在对小样本数据进行检验时具备可靠性[14],与传统方法相比减少了传递量和不确定性[15],既可以用于样本的正态性检验[16],也可以不考虑数据是否为正态分布[17],不对数据进行预处理[18-19]。也有研究者认为对于偏离正态分布的原始数据应该采用非参数Bootstrap方法[20],对于正态分布或正态分布的原始数据,可以采用参数Bootstrap方法代替非参数方法。尤其是非参数Bootstrap 在少量样本情况下的检验相较于其他检验方法更为有效,并且认为样本数量一般至少应在10以上[21]。
陈昭等[22]提出了Bootstrap方法与偏最小二乘法结合的Bagging和Boosting方法,结果表明Bootstrap方法提高了近红外光谱定量模型的预测能力;Xiao等[23]在沥青渗透指标相关成分的少量样本的光谱定量分析模型研究中的结果表明Bootstrap方法与SVM相结合的模型效果良好。Lodder等[24]创建Bootstrap Patter Selection样本选择方法并用于蛋白质的测定,决定系数2可以稳定在0.988。因此,通过对现有Bootstrap方法的相关文献研究可知,Bootstrap方法在小样本条件下的分析检测具有优势,并且对原始数据分布没有严格的要求,可以更好地应用于分析模型中。
本文研究的目的是利用Bootstrap和基于-距离结合的样本划分方法(sample set partitioning based on joint-distance,SPXY)构建近红外光谱样本优化方法,建立适宜小样本的灌浆期玉米水分定量分析模型,分析重抽样本次数和样本临界大小对模型的影响,提高灌浆期玉米水分的测定效率,降低测定成本,为灌浆期玉米水分测量提供新方法,既有助于玉米育种考种研究,也为近红外光谱在小样本条件下的定量分析提供新思路。
1 材料与方法
1.1 试验材料
样本采集自黑龙江八一农垦大学玉米试验基地,品种为“先玉335”。灌浆期玉米样本采集期为2016年8月21日开始至10月2日结束,每7 d取1次样本。由于温度较高,为了控制样本采摘后的水分流失,取样后迅速将样本转移至试验室,低温保存。在最短时间内完成化学试验和光谱数据的采集,从而将预测模型的外界影响因素降到最低。本文中的样本数据为2016年9月11日取样,光谱采集时将玉米籽粒研磨成粉末。光谱采集样本数量为200个,剔除异常样本后剩余156个样本按照3﹕1的比例分配建模集和预测集分别为118个样本和38个样本。
1.2 试验设备与软件
光谱采集设备为北京瑞利WQF-600N FTNIR傅里叶变换光谱仪,光谱波长范围在4000~10000 cm-1,每个样品扫描32次,最终光谱为32次扫描光谱的平均光谱。
含水率测定采用美国双杰G&G电子天平有限公司JJ224BC天平测试质量,精度0.1 mg。烘干设备为天津市泰斯特仪器有限公司WH-71电热恒温干燥箱,烘干方法采用二次烘干法,105 ℃下断青,85 ℃恒温直至百粒质量没有变化。含水率为单位质量的玉米籽粒水分含量,即含水率=((百粒鲜质量(g)-百粒干质量(g))/(百粒鲜质量(g))×100%。
算法实现采用Matlab2015b 8.6.0和RStudio 3.4.1软件进行,RStudio实现Bootstrap算法,Matlab2015b实现样本的划分算法和波长变量的筛选算法;光谱数据的预处理和相关计算采用The Unscrambler X 10.3软件实现。
1.3 试验方法及原理
1.3.1 Bootstrap重抽样本算法
Bootstrap算法是为了增强模型的精度和稳健性,采用重新抽样的策略反复地进行模拟原小样本数据集,构建满足分析与建模需要的新数据集。如果简单的迭代模拟数据,新数据集样本间的差异性将很难保证。因此,每次在进行下一次重抽样本时都将上一次抽取的样本与原样本进行合并,并计算出新样本集的均值作为下一次重抽样本的权重以增强样本的差异性和模型的稳健程度。本研究中所采用的Bootstrap算法过程如下:
1)定义原始样本集为=(1,2, …,),X为参加Bootstrap重抽算法的第个光谱样本。设Bootstrap的最大重抽样本次数为;
3)依照公式(1)按照当前样本权重对待抽取的样本集进行重新抽取,抽取形成的数据集为*=(1,2, …,);
*+(1)
4)将新抽取形成的样本集*与进行合并,按照步骤2)重新计算样本抽取权重;
5)重复步骤3)、4)次,形成新的样本集,样本数=。
对于个样本,通过次迭代的重抽样本,获得了个重抽样本,通过采用样本划分和建模等方法对样本集进行处理得到适合的创建模型样本,进而得到有效的小样本的预测结果。
1.3.2 SPXY样本选择算法
基于-距离结合的样本划分方法(sample set partitioning based on joint-distances, SPXY)划分样本的优点是能够保证覆盖到所有的样本,改善模型的预测能力,增加模型的校正速度[25]。基于SPXY的样本划分方法的原理是在综合考虑光谱向量和浓度向量的情况下,计算样本之间的距离,所以SPXY适合在划分预测模型的样本集合时使用。

式中d(,)为各光谱样本之间的距离,d(,)为各浓度样本之间的距离,为样本数。划分时d和d分别除以各自最大值,从而得到每个样本之间的-距离作为样本选择时的权重[26]。
1.3.3 Bootstrap-SPXY样本优化选择方法
将Bootstrap算法计算之后的样本集合记作“重抽样本”集合。利用“重抽样本”集合直接建立预测模型会为模型的创建带来压力,而且“重抽样本”集合的分布稳定性也会对模型的预测能力带来影响。Bootstrap-SPXY样本优化方法对“重抽样本”集合进行优化选择和分布性检测,在样本优化选择的同时确保建模样本的光谱区间和分布的一致性。Bootstrap-SPXY样本优化流程如图1所示。
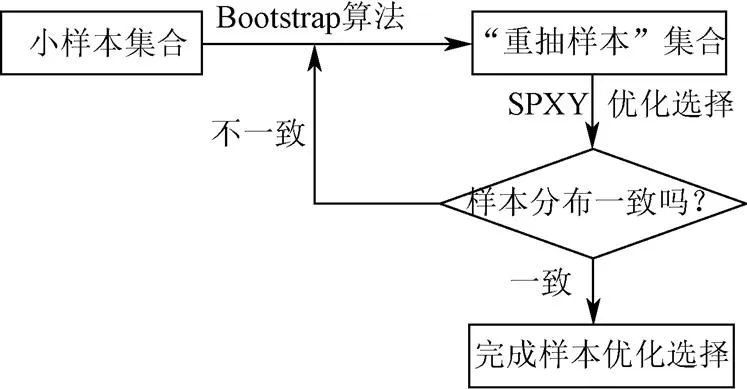
图1 Bootstrap-SPXY样本优化流程
首先将小样本集合经过数据处理进行Bootstrap算法计算,输出“重抽样本”集合,进行SPXY样本选择计算,绘制样本分布直方图与原样本分布进行比较,若分布一致性较差,则重新进行Bootstrap算法计算,若分布一致则完成样本的优化选择,形成建模样本集合。
1.4 模型预测评价指标
在研究中,使用决定系数2、建模均方根误差RMSEC、交互验证标准偏差RMSECV、预测均方根误差RMSEP和预测相关系数r对模型的预测能力进行说明。一个好的模型,RMSEC、RMSECV和RMSEP都会比较小,2和r值会比较大。其中,RMSECV和RMSEP的值要基本一致,如果RMSECV远大于RMSEP的值,则说明验证样品的代表性差;如果RMSECV远小于RMSEP的值,则说明建模样品的代表性差,信息拟合不够或者过拟合。
2 结果与分析
2.1 光谱数据预处理
光谱水分子活动明显的频谱区域在4 500~6 900 cm-1,原始光谱图在该波段内有明显噪音。在建立模型前,对光谱数据进行预处理。图2为156个样本经过窗宽为13的Savitzky-Golay 平滑预处理[27-28]后的光谱图像。
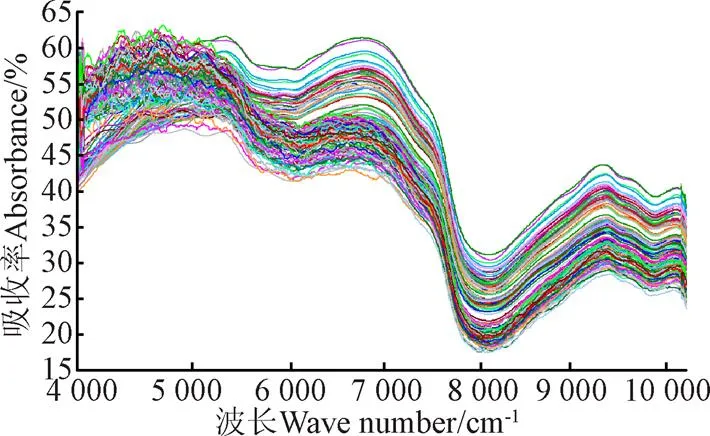
图2 156个样本预处理后的光谱图
2.2 全谱Bootstrap-SPXY-PLS灌浆期玉米水分定量模型分析
2.2.1 Bootstrap-SPXY样本优选分析
首先,通过SPXY方法从原数据样本中划分出多个样本集合,样本数量分别为50、20、10和5,分别记为X’_fifty、X’_twenty、X’_ten和X’_five。5个样本集合 X’_five添加5个样本集合ten+后形成10个样本集合X’_ten,样本集合X’_ten添加10个样本集合twenty+形成样本集合X’_twenty,样本集合X’_twenty添加30个样本集合fifty+形成样本集合X’_fifty。以此划分出Bootstrap试验所需的样本集合,图3显示的为6 900 cm-1波段的划分结果。

图3 6 900 cm-1波段SPXY样本划分结果
将集合X’_fifty、X’_twenty、X’_ten和X’_five分别进行转置,形成Bootstrap算法待处理样本集合X_fifty、X_twenty、X_ten和X_five,根据1.3.1节所描述的算法实现重抽样本。为了研究Bootstrap-SPXY-PLS模型的稳定性,将重抽样本次数分别设定为100次、200次….800次。X_five重抽500次后转置形成2 500个光谱样本,X_fifty重抽500次后转置形成25 000个光谱样本。由于样本量巨大,为了保证模型的稳定,将重抽后的光谱样本集基于SPXY算法优化选择,样本数减少为2 000。
通过绘制直方图验证样本划分和重抽样本的可靠性和分布情况。选择水分子敏感的6 900 cm-1波段为研究对象。图4为显示在6 900 cm-1波段不同阶段的样本分布频率,其中图4a显示的是原始光谱样本分布频率,图4b显示的是SPXY划分50个的样本集合X’_fifty分布频率,图4c显示的是50个样本进行Bootstrap重抽样本500次并重新划分后的样本分布频率。通过图4可以看出,a、b和c 3张图频率分布情况大致相同,a和b的频率分布情况更相似。3个阶段的最大频率的吸收率峰值均出现在45~50之间。图4c所显示的分布情况要略优于原始样本数据,表明通过Bootstrap重抽样本方法构建的建模样本不但没有造成样本分布特征的缺失,反而能够弥补原始样本在分布上的不足。因此,这2 000个样本可以作为创建预测模型的样本集合。
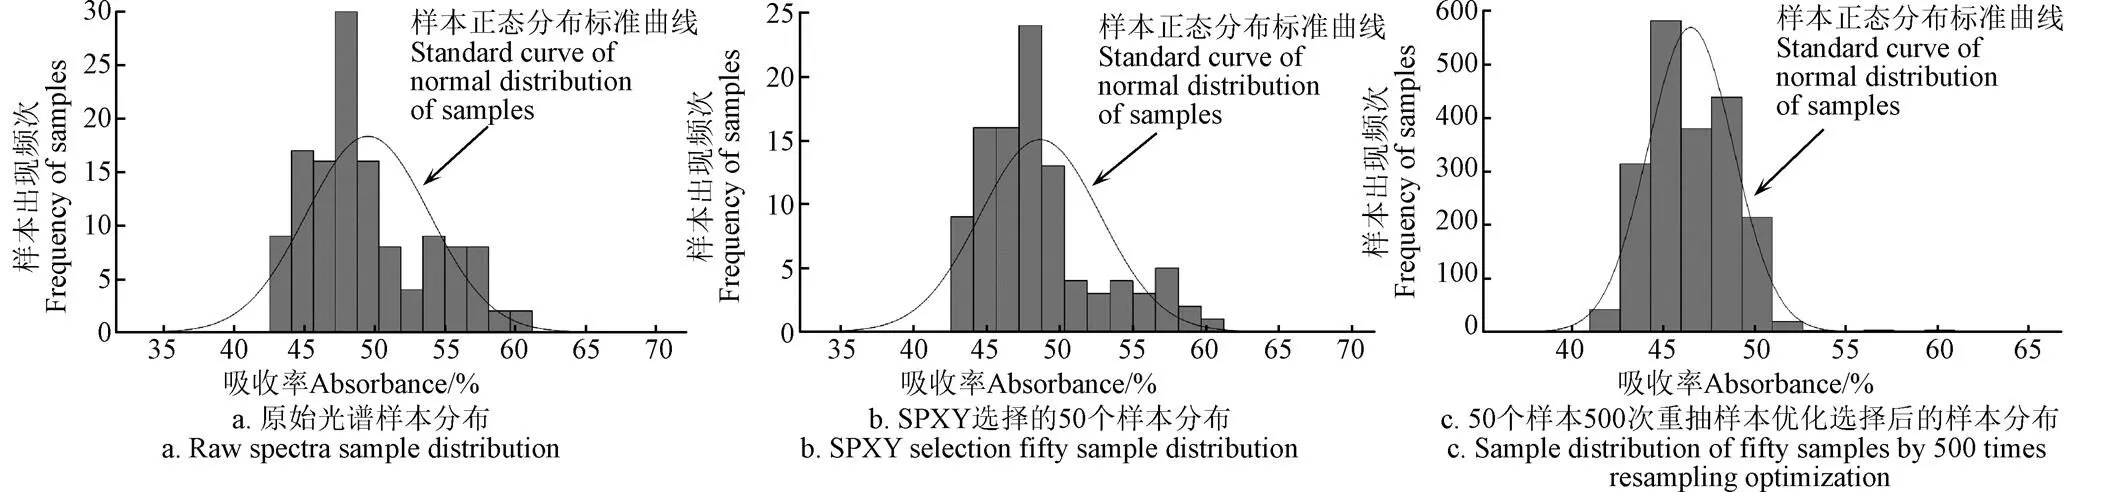
图4 6 900 cm-1波段样本分布频率直方图
2.2.2 基于Bootstrap-SPXY-PLS的全谱模型分析
将前面得到的建模样本集合基于PLS的交叉验证划分方法将2000光谱样本划分为10个子集。分别对这10个样本子集建立PLS模型,获得10个Bootstrap- SPXY-PLS子模型,分别利用子模型对预测集进行预测,得到10组预测结果。最后将10组预测结果的均值作为最终的预测结果。表1给出了使用Bootstrap-SPXY-PLS方法,不同样本大小,重抽样本500次以及使用不同预处理方法基于PLS方法建立的NIR预测模型的各项评价结果。从表1可以看出,所有模型的RMSEC、RMSECV和RMSEP均值都比较小,r均值都比较大,说明模型都具有一定的预测能力[29]。但是,PLS方法以及用不同预处理方法所建立的PLS模型的R均小于0.7,并且RMSEP-mean和RMSECV值具有一定的差距,表明直接使用PLS建模和采用简单预处理之后的模型预测性能相对较差。而Bootstrap-SPXY-PLS建模方法在不同样本规模下,RMSECV和RMSEP-mean值都基本一致,尤其当样本大于等于10后,这2个值基本相等,并且2均大于0.98,性能明显优于PLS以及采用不同预处理方法所建立的模型。因此,利用Bootstrap-SPXY-PLS方法可以建立大于10个样本小样本近红外光谱定量预测模型。

表1 灌浆期玉米籽粒水分近红外光谱预测模型结果Table 1 NIRS moisture content prediction model of maize grain in filling stage
注:PLS,偏最小二乘法;SG,Savitzky-Golay平滑滤波;MSC,多元散射校正;SNV,标准归一化。
Note:PLS, partial least square; SG, Savitzky-Golay; MSC, multiplicative scatter correction; SNV, standard normal variate.
2.2.3 全谱模型稳定性的评价
通过观察预测相关系数与预测均方根误差的变化趋势对样本个数和重抽次数对模型稳定性的影响进行评价。图5a为不同样本个数和重抽次数所对应的Bootstrap-SPXY-PLS模型的r值趋势图。从图5a中可以看出,r值始终处于较好值范围内,总体波动区间在0.971 5~0.976 0之间。最小值出现在样本个数为50,重抽样本次数为240时。当重抽样本次数达到500之后,r值的波动范围明显小于500之前,波动区间在0.973 0~0.975 5之间。虽然样本个数为5时r值变化最为趋缓,500次之后的标准差为0.000 144,样本个数为10和20时,500次之后的标准差均小于0.000 22,样本个数为50时变化最大,500次之后的标准差为0.000 644,但是样本个数为10、20和50时最大r值均大于样本个数为5时的最大r值。所以,通过分析r值的趋势图仅能够判断出重抽样本次数达到500之后模型具有预测能力,但是无法确定建立稳定模型样本个数的临界大小。
图5b显示的是不同样本个数和重抽次数所对应的Bootstrap-SPXY-PLS模型的RMSEP值趋势图,同样在重抽样本500次之后的波动变小,总体波动区间从(0.34%~0.51%)变化到区间(0.35%~0.41%);当样本个数为5时,重抽次数在100~400次左右时RMSEP值波动最大,最大RMSEP值为0.51%,标准差大于0.05%,重抽样本次数为500次之后相对稳定性较强,标准差小于0.01%。随着样本个数增加为10和20时,在重抽次数增加的过程中RMSEP值波动逐渐趋缓,样本数越大波动趋于平稳的重抽样本次数越少。样本个数为50时,重抽次数250次之后的RMSEP值标准差与500次之后的标准差均小于0.011%。
整体来说,当重抽样本的次数达到500之后,在任何样本数的条件下Bootstrap-SPXY-PLS模型的预测能力都能趋于稳定。由于重抽样本个数为5时前后RMSEP波动较大,所以建议建模最小临界样本个数为10。
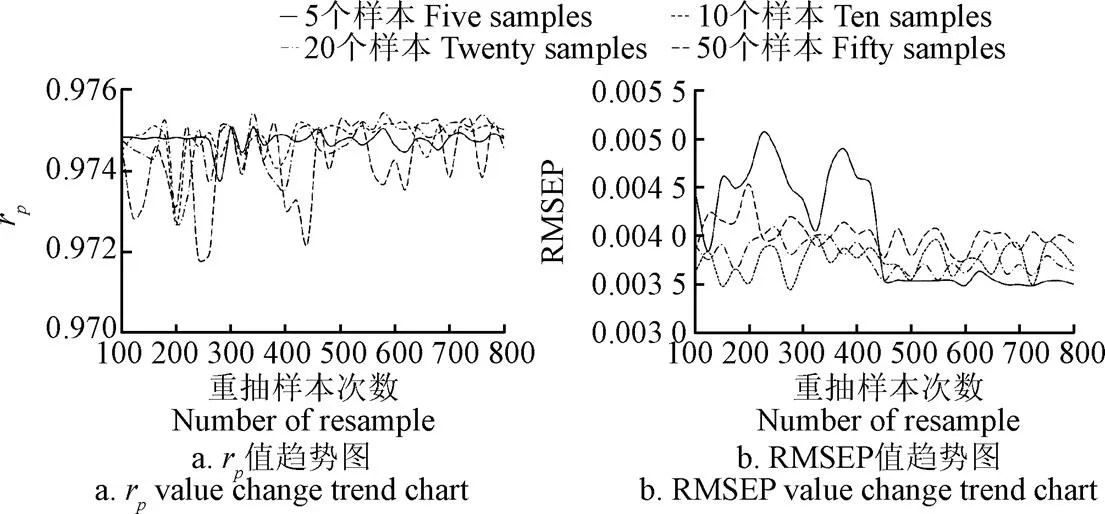
图5 Bootstrap-SPXY-PLS模型的rp值和RMSEP值趋势图
2.3 基于CARS波段变量筛选的Bootstrap-SPXY-PLS灌浆期玉米水分定量模型分析
为了进一步优化Bootstrap-SPXY-PLS模型,采用CARS竞争性自适应重加权采样算法对原始光谱进行波段的筛选[30-31]。本研究中基于CARS进行波段的选择时设置蒙特卡洛仿真次数为500次,按照10折和5折交叉验证分别进行筛选。10折交叉验证时的RMSECV最小值为0.65%,筛选变量数为115个;5折交叉验证时RMSECV最小值为0.51%,筛选变量数为149个。图6所示为5折交叉验证时的结果图。图6c中的曲线为1 201个光谱波段变量的系数路径。通过回归系数路径得到最佳变量子集的结果为蒙特卡洛采样次数为19时的变量子集,此时的RMSECV值也为最小值如图6b所示。所以选择如图6a显示的149个变量作为最终筛选的变量子集。
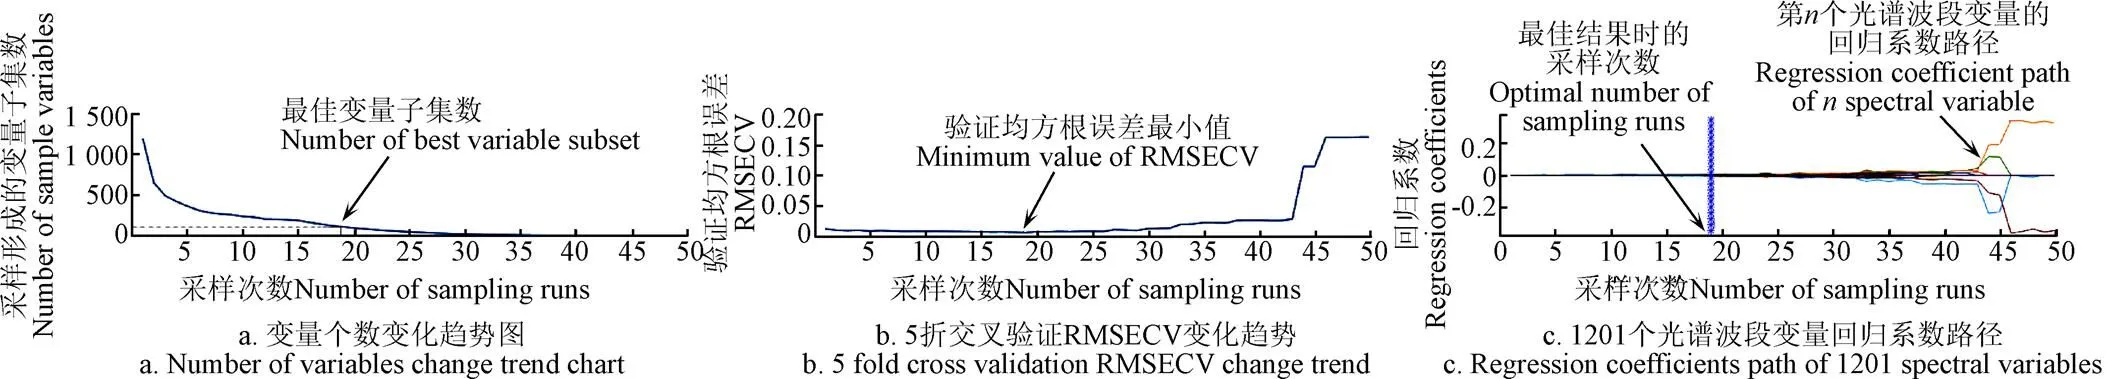
注:图c中每一条线记录了不同光谱波段变量在不同采样次数下的回归系数。
使用筛选后的变量在样本个数分别为10、20、50,重抽次数为500的条件下进行Bootstrap-SPXY-PLS建模,模型的决定系数2分别为0.924 5、0.901 0和0.918 0,略低于全谱模型的决定系数。为了进一步验证模型的稳定性,统计样本个数为10、20、50的RMSEP均值和r值,RMSEP均值与r值分别为0.36%和0.973 6、0.36%和0.953 4以及0.35%和0.975 0。与全谱模型比较,当重抽样本个数增加时RMSEP值略有减少,r值总体没有全谱Bootstrap-SPXY-PLS模型高,但是变化趋势相同,都是在20个重抽样本时略有下降。表2显示了2种模型在不同小样本条件下的预测值与化学参考值,以及预测集各样本的预测值与化学参考值的平均偏差和模型运行时间的统计结果。可以看出在全谱Bootstrap-SPXY-PLS模型时不同小样本条件下的预测值平均偏差要小于Cars-Bootstrap-SPXY-PLS模型并且比较稳定。Cars-Bootstrap-SPXY-PLS模型预测精度低于Bootstrap-SPXY-PLS模型的原因可能在于CARS算法本身具有不稳定性,试验中仅选择了RMSECV最小时的一个变量子集进行模型对比试验,变量筛选也可能造成光谱有效信息的丢失[32]。Cars-Bootstrap-SPXY-PLS模型的优势是筛选后变量为全谱变量集合的1/8,运行时间低于筛选前运行时间的30%,在一定程度上提高了Bootstrap-SPXY-PLS模型的执行力。
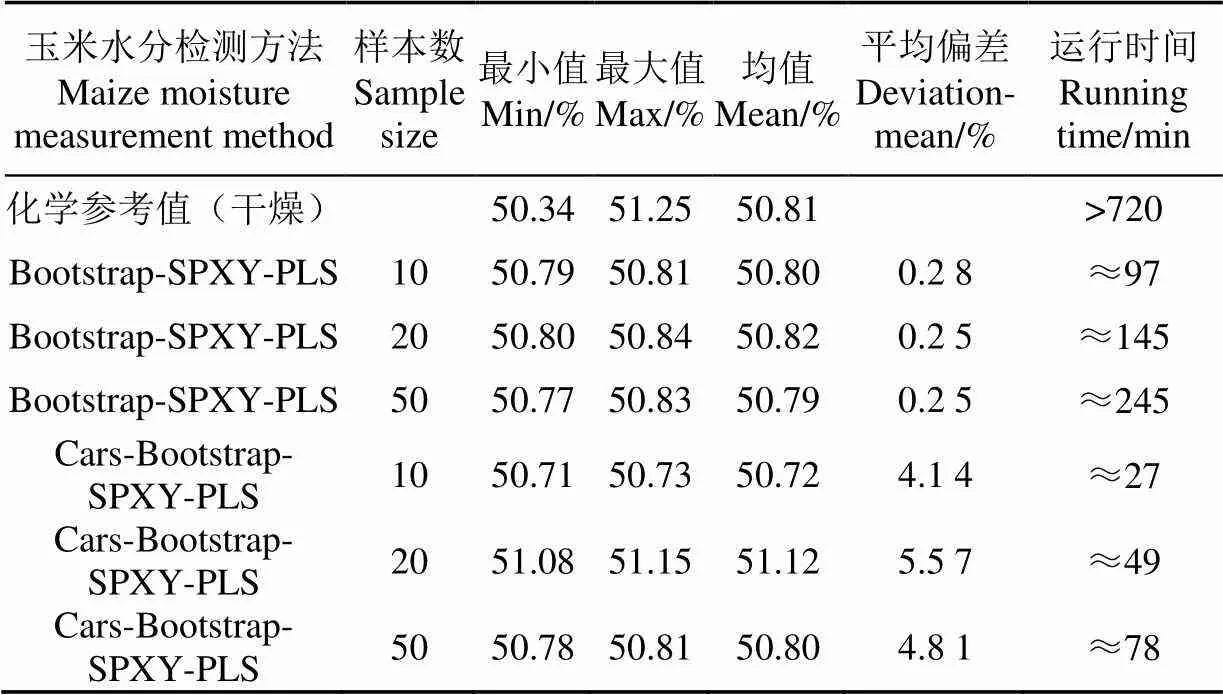
表2 化学参考值和预测值
3 结 论
1)提出了基于小样本条件下的自举算法(Bootstrap)与基于-距离结合的样本划分方法(SPXY, sample set partitioning based on joint x-y distances)相结合的样本优化方法,并与偏最小二乘法(PLS,partial-least-square)相结合建立了Bootstrap-SPXY-PLS水分定量分析模型。在重抽样本次数为500,样本数目大于等于10时均能够创建稳定的预测模型。样本个数分别为10、20、50的预测模型的决定系数2分别为0.999 9、0.989 8和0.993 6。
2)将本文提出的Bootstrap-SPXY-PLS全谱模型与基于PLS的多个模型进行性能比较,结果表明全谱Bootstrap-SPXY-PLS方法在Bootstrap重抽样本数量为10及以上时,重抽次数为500时创建的模型2值均优于PLS模型、PLS与Savitzky-Golay平滑滤波(SG)和多元散射校正(MSC,multiplicative scatter correction)相结合所建立的模型、PLS与Savitzky-Golay平滑滤波和标准归一化(SNV,standard normal variate)相结合所建立的模型以及PLS与Savitzky-Golay平滑滤波、多元散射校正和标准归一化相结合所建立的模型。
3)将全谱Bootstrap-SPXY-PLS与CARS-Bootstrap- SPXY-PLS模型进行比较,结果表明变量筛选后的模型依然能够保证较为稳定的RMSEP和r值,预测模型的决定系数2均大于0.90。
因此,本文提出的小样本条件下的灌浆期玉米的近红外光谱水分定量分析的Bootstrap-SPXY-PLS模型,可以为玉米育种灌浆期种子含水率的测定提供一种稳定、高效的方法。
[1] 文韬,郑立章,龚中良,等. 基于近红外光谱技术的茶油原产地快速鉴别[J]. 农业工程学报,2016,32(16):293-299. Wen Tao, Zheng Lizhang, Gong Zhongliang, et al. Rapid identification of geographical origin of camellia oil based on near infrared spectroscopy technology[J]. Transactions of the Chinese Society of Agricultural Engineering (Transactions of the CSAE), 2016, 32(16): 293-299. (in Chinese with English abstract)
[2] Liang Pei-shih, Haff Ronald P, Hua Sui Sheng T, et al. Nondestructive detection of zebra chip disease in potatoes using near-infrared spectroscopy[J]. Biosystems Engineering, 2018, 166(2): 161-169.
[3] Diago M P, Fernández-Novales J, Gutiérrez S, et al. Development and validation of a new methodology to assess the vineyard water status by on-the-go near infrared spectroscopy:[J]. Frontiers in Plant Science, 2018, 1(9): 1-13.
[4] 李倩倩,田旷达,李祖红,等. 无信息变量消除法变量筛选优化[J]. 分析化学,2013,41(6):917-921.
Li Qianqian, Tian Kuangda, Li Zhuhong, et al. Model of total nitrogen and total sugar in tobacco optimizing after uninformative variable elimination[J]. Chinese Journal of Analytical Chemistry, 2013, 41(6): 917-921. (in Chinese with English abstract)
[5] Jia Shengyao, Li Hongyang, Wang Yanjie, et al. Recursive variable selection to update near-infrared spectros copy model for the determination of soil nitrogen and organic carbon[J]. Geoderma, 2016, 268(4): 92-99.
[6] 陈奕云,齐天赐,黄颖菁,等. 土壤有机质含量可见-近红外光谱反演模型校正集优选方法[J]. 农业工程学报,2017,33(6):107-114.
Chen Yiyun, Qi Tianci, Huang Yingjing, et al. Optimization method of calibration dataset for VIS-NIR spectral inversion model of soil organic matter content[J]. Transactions of the Chinese Society of Agricultural Engineering (Transactions of the CSAE), 2017, 33(6): 107-114. (in Chinese with English abstract)
[7] Sun Xudong, Dong Xiaoling. Improved partial least squares regression for rapid determination of reducing sugar of potato flours by near infrared spectroscopy and variable selection method[J]. Journal of Food Measurement & Characterization, 2015, 9(1): 95-103.
[8] Liu Ke, Chen Xiaojing, Li Limin, et al. A consensus successive projections algorithm-multiple linear regression method for analyzing near infrared spectra[J]. Analytica Chimica Acta, 2015, 858(1): 16-23.
[9] 朱丽伟,马文广,胡晋,等. 近红外光谱技术检测种子质量的应用研究进展[J]. 光谱学与光谱分析,2015,35(2):346-349.
Zhu Liwei, Ma Wenguang, Hu Jin, et al. Advances of NIR spectroscopy technology applied in seed quality detection[J]. Spectroscopy and Spectral Analysis, 2015, 35(2): 346-349. (in Chinese with English abstract)
[10] 彭彦昆,赵芳,李龙,等. 利用近红外光谱与PCA-SVM 识别热损伤番茄种子[J]. 农业工程学报,2018,34(5):159-165.
Peng Yankun, Zhao Fang, Li Long, et al. Discrimination of heat-damaged tomato seeds based on nearinfrared spectroscopy and PCA-SVM method[J]. Transactions of the Chinese Society of Agricultural Engineering (Transactions ofthe CSAE), 2018, 34(5): 159-165. (in Chinese with English abstract)
[11] 郭婷婷,徐丽,刘金,等. 玉米亚正常籽粒生活力近红外光谱判别方法研究[J]. 光谱学与光谱分析,2013,33(6):1501-1505.
Guo Tingting, Xu Li, Liu Jin, et al. Study on discrimination method of maize seed viability based on near-infrared spectroscopy[J]. Spectroscopy & Spectral Analysis, 2013, 33(6): 1501-1505. (in Chinese with English abstract)
[12] 刘思奇,钟雪梅,李凤海,等. 东北地区4个代表性玉米品种的灌浆和脱水速率比较[J]. 种子,2015,34(12):69-72.
Liu Siqi, Zhong Xuemei, Li Fenghai, et al. Comparisons of grain filling and dehydration rates in 4representative maize varieties in northeast provinces[J]. Transactions of the Seed, 2015, 34(12): 69-72. (in Chinese with English abstract)
[13] Efron B. Bootstrap methods: another look at the jackknife[J]. Annals of Statistics, 1979, 7(1): 1-26.
[14] Krebsbach C M. Bootstrapping with Small Samples in Structural Equation Modeling: Goodness of Fit and Confidence Intervals[D]. Rhodes Island, USA, University of Rhode Island, 2014.
[15] Amalnerkar E, Lee T H, Lim W. Bootstrap guided information criterion for reliability analysis using small sample size information[C]// World Congress of Structural and Multidisciplinary Optimisation. Springer, Cham, 2017: 326-333.
[16] Wang Yanqing, Zhou Weihu, Dong Dengfeng, et al. Estimation of random vibration signals with small samples using bootstrap maximum entropy method[J]. Measurement, 2017, 105(7): 45-55.
[17] Coskun A, Ceyhan E, Inal T C, et al. The comparison of parametric and nonparametric bootstrap methods for reference interval computation in small sample size groups[J]. Accreditation & Quality Assurance, 2013, 18(1): 51-60.
[18] Heathcote A, Brown S, Wagenmakers E J, et al. Distribution-free tests of stochastic dominance for small samples[J]. Journal of Mathematical Psychology, 2010, 54(5): 454-463.
[19] Vojta A, Shekvugrovečki A, Radin L, et al. Hematological and biochemical reference intervals in Dalmatian pramenka sheep estimated from reduced sample size by bootstrap resampling.[J]. Veterinarski Arhiv, 2011, 81(1): 25-33.
[20] Neto E C. Speeding up non-parametric bootstrap computations for statistics based on sample moments in small/moderate sample size applications[J]. Plos One, 2015, 10(6): e0131333.
[21] Dwivedi A K, Mallawaarachchi I, Alvarado L A. Analysis of small sample size studies using nonparametric bootstrap test with pooled resampling method[J]. Statistics in Medicine, 2017, 36(14): 2187-2205.
[22] 陈昭,吴志生,史新元,等. Bagging偏最小二乘和Boosting偏最小二乘算法的金银花醇沉过程近红外光谱定量模型预测能力研究[J]. 分析化学,2014,42(11):1679-1686.
Chen Zhao, Wu Zhisheng, Shi Xinyuan, et al. A study on model performance for ethanol precipitation process of lonicera japonica by NIR based on bagging-PLS and Boosting-PLS algorithm[J]. Chinese Journal of Analytical Chemistry, 2014, 42(11): 1679-1686. (in Chinese with English abstract)
[23] Xiao Ma, Zhao Zhong, Xiong Shanhai. Spectrum quantitative analysis based on bootstrap-SVM model with small sample set[J]. Spectroscopy & Spectral Analysis, 2016, 36(5): 1571-1575.
[24] Lodder R, Moses J, Buice R G. Determination of protein crosslinking with bootstrap pattern selection and nearinfrared spectrophotometry[J]. CPS: analchem/0008002, 2000(8): 1-5.
[25] 文韬,洪添胜,李立君,等. 霉变稻谷脂肪酸含量的光谱检测模型构建与优化分析[J]. 农业工程学报,2016,32(1):193-199.
Wen Tao, Hong Tiansheng, Li Lijun, et al. Optimization analysis and establishment of spectra detection model of fatty acid contents for mould paddies[J]. Transactions of the Chinese Society of Agricultural Engineering (Transactions of the CSAE), 2016, 32(1): 193-199. (in Chinese with English abstract)
[26] 李江波,郭志明,黄文倩,等. 应用CARS和SPA算法对草莓SSC含量NIR光谱预测模型中变量及样本筛选[J]. 光
谱学与光谱分析,2015,35(2):372-378.
Li Jiangbo, Guo zhiming, Huang Wenqian, et al. Near-infrared spectra combining with CARS and SPA algorithms to screen the variables and samples for quantitatively determining the soluble solids content in strawberry[J]. Spectroscopy & Spectral Analysis, 2015, 35(2): 372-378. (in Chinese with English abstract)
[27] 赵安新,汤晓君,张钟华,等. 优化Savitzky-Golay滤波器的参数及其在傅里叶变换红外气体光谱数据平滑预处理中的应用[J]. 光谱学与光谱分析,2016,36(5):1340-1344.
Zhao Anxin, Tang Xiaojun, Zhang Zhonghua, et al. Optimizing savitzky-golay parameters and its smoothing pretreatment for FTIR gas spectra[J]. Spectroscopy & Spectral Analysis, 2016, 36(5): 1340-1344. (in Chinese with English abstract)
[28] 蔡剑华,胡惟文,王先春. 基于组合滤波的鱼油二十碳五烯酸含量近红外光谱检测[J]. 农业工程学报,2016,32(1):312-317.
Cai Jianhua, Hu Weiwen, Wang Xianchun. Near-infrared spectrum detection of fish oil eicosapentaenoic acid content based on combinational filtering[J]. Transactions of the Chinese Society of Agricultural Engineering (Transactions of the CSAE), 2016, 32(1): 312-317. (in Chinese with English abstract)
[29] 冯艳春,张琪,胡昌勤. 药品近红外光谱通用性定量模型评价参数的选择[J]. 光谱学与光谱分析,2016,36(8):2447-2454.
Feng Yanchun, Zhang Qi, Hu Changqin. Study on the selection of parameters for evaluating drug NIR universal quantitative models[J]. Spectroscopy & Spectral Analysis, 2016, 36(8): 2447-2454. (in Chinese with English abstract)
[30] 宋相中,唐果,张录达,等. 近红外光谱分析中的变量选择算法研究进展[J]. 光谱学与光谱分析,2017,37(4):1048-1052.
Song Xiangzhong, Tang Guo, Zhang Luda, et al. Research advance of variable selection algorithms in Near Infrared Spectroscopy analysis[J]. Spectroscopy & Spectral Analysis, 2017, 37(4): 1048-1052. (in Chinese with English abstract)
[31] 蔡亮红,丁建丽. 小波变换耦合CARS 算法提高土壤水分含量高光谱反演精度[J]. 农业工程学报,2017,33(16):144-151.
Cai Lianghong, Ding Jianli. Wavelet transformation coupled with CARS algorithm improving prediction accuracy of soilmoisture content based on hyperspectral reflectance[J]. Transactions of the Chinese Society of Agricultural Engineering (Transactions of the CSAE), 2017, 33(16): 144-151. (in Chinese with English abstract)
[32] 宾俊,范伟,周冀衡,等. 智能优化算法应用于近红外光谱波长选择的比较研究[J]. 光谱学与光谱分析,2017,37(1):95-102.
Bin Jun, Fan Wei, Zhou Jiheng, et al. Application of intelligent optimization algorithms to wavelength selection of near-infrared spectroscopy[J]. Spectroscopy & Spectral Analysis, 2017, 37(1): 95-102. (in Chinese with English abstract)
Moisture quantitative analysis with small sample set of maize grain in filling stage based on near infrared spectroscopy
Wang Xue1,2, Ma Tiemin2,3, Yang Tao1※, Song Ping1, Xie Qiuju2, Chen Zhengguang2
(1,,110866,;2.,,163319,;3.,,110819,)
Near infrared spectroscopy (NIRS) and its analytical techniques are increasingly used for the rapid quantitative and qualitative analysis in the field of agriculture, food, industry, and so on. Generally, the sample size in most research is between 100 and 200. In maize breeding, the sampling quantity and its cost for maize grain moisture measurement in filling stage are limited due to some objective limitations of the planting area of new varieties, the maize plants number per square meter, the effective experimental spikes number and other conditions. However, the filling period is a critical stage for maize grain variety changes and breeding test. In the traditional measurement method for moisture drying, 150-250 grains are taken for the moisture measurement, which are a large number of samples. Therefore, it is one of the urgent problems to provide a high efficient moisture measurement method using small sample size in maize breeding process. In NIRS research field, the size of sample set is a key factor for the performance and prediction ability of the algorithm. In general, the smaller the size of sample set, the lower the efficiency of model, so it is very important to find a critical value for the small sample set in practical applications. In recent years, data analysis methods for small sample set based on Bootstrap were proposed, and most of them were considered reliable for the small sample set data validation. In order to reduce sample size and measure the moisture content of maize grainin filling period quickly and accurately, a quantitative analysis model of moisture was presented based on sample set optimized selection and partial least squares (PLS) algorithm using NIRS. The method of sample set optimized selection was on the basis of Bootstrap resampling strategy and sample set partitioning based on jointdistances (SPXY). The models were evaluated by correlation coefficient of prediction and root-mean-square error of prediction (RMSEP) in different resampling times and the sizes of sample set. Firstly, the full spectrum and wavelength selection spectrum were resampled for 100-800 times at the sample size of 5, 10, 20 and 50, respectively, using Bootstrap algorithm. Secondly, the resampled set was selected for the calculation of SPXY samples to optimize selection to form modeling sample set. Thirdly, the modeling sample set was divided into multiple subsets and PLS sub-models were constructed using these subsets respectively, and multiple predictive values were obtained by using the PLS sub-models regression analysis. Finally, the predictive values of maize grain moisture in filling period were obtained by the weighted mean of multiple predictive values. It is shown that a model with stable performance is gotten when the number of Bootstrap resampling is 500 and resampling size is greater than 10, and the number of resampled samples decreases with the increasing of sample size. When the sample size is 10 and 50, the RMSEP mean values of full spectrum Bootstrap-SPXY-PLS model are 0.38% and 0.40% respectively, the correlation coefficients of predictionare 0.975 1 and 0.968 5 respectively, and the determination coefficients (2) of the calibration are 0.999 9 and 0.993 6 respectively; the RMSEP mean values of CARS-Bootstrap-PLS are 0.36% and 0.35% respectively, the correlation coefficients of predictionare 0.973 6 and 0.975 0 respectively, and the2values were 0.924 5 and 0.918 0 respectively. Therefore, the 2 models of full-spectrum Bootstrap-SPXY-PLS and the CARS-Bootstrap-PLS both have good prediction ability and can provide a new stable and efficient method for maize grain moisture determination in filling stage in breeding process. It is helpful for maize breeding research, and also provides a new idea for quantitative analysis of NIR spectra in small sample set.
near infrared spectroscopy; water; models; quantitative analysis; small sample set; maize grain in filling stage; bootstrap resample; sample optimized selection
王 雪,马铁民,杨 涛,宋 平,谢秋菊,陈争光. 基于近红外光谱的灌浆期玉米籽粒水分小样本定量分析[J]. 农业工程学报,2018,34(13):203-210.doi:10.11975/j.issn.1002-6819.2018.13.024 http://www.tcsae.org
Wang Xue, Ma Tiemin, Yang Tao, Song Ping, Xie Qiuju, Chen Zhengguang. Moisture quantitative analysis with small sample set of maize grain in filling stage based on near infrared spectroscopy[J]. Transactions of the Chinese Society of Agricultural Engineering (Transactions of the CSAE), 2018, 34(13): 203-210. (in Chinese with English abstract) doi:10.11975/j.issn.1002-6819.2018.13.024 http://www.tcsae.org
2018-02-25
2018-05-19
国家自然科学基金青年基金(31701318);黑龙江八一农垦大学校内课题培育资助项目(XZR2016-09)。
王 雪,辽宁沈阳人,讲师,博士生,从事近红外光谱分析及其在农业上的应用研究。Email:mtmwx@163.com
杨涛,博士,教授,博士生导师,主要从事计算机技术在农业领域应用的教学与研究工作。Email:328748306@qq.com
10.11975/j.issn.1002-6819.2018.13.024
S24
A
1002-6819(2018)-13-0203-08