Ice accumulation and thickness distribution before inverted siphon*
2017-03-09HuiFu付辉XinleiGuo郭新蕾KailinYang杨开林TaoWang王涛YongxinGuo郭永鑫
Hui Fu (付辉), Xin-lei Guo (郭新蕾), Kai-lin Yang (杨开林), Tao Wang (王涛), Yong-xin Guo (郭永鑫)
State Key Laboratory of Simulation and Regulation of Water Cycle in River Basin, China Institute of Water Resources and Hydropower Research, Beijing 100038, China, E-mail:fuhui_iwhr@126.com
(Received November 25, 2015, Revised February 3, 2016)
Ice accumulation and thickness distribution before inverted siphon*
Hui Fu (付辉), Xin-lei Guo (郭新蕾), Kai-lin Yang (杨开林), Tao Wang (王涛), Yong-xin Guo (郭永鑫)
State Key Laboratory of Simulation and Regulation of Water Cycle in River Basin, China Institute of Water Resources and Hydropower Research, Beijing 100038, China, E-mail:fuhui_iwhr@126.com
(Received November 25, 2015, Revised February 3, 2016)
In winter, the safe operation and the water transfer efficiency of an inverted siphon are big concerns for water diversion projects in a high latitude area. This paper takes the Tanghe inverted siphon of the Middle Route of the South-to-North Water Diversion Project in China as an example, and carries out experimental studies under the real ice condition with different water levels, flow discharges and submerged depths. The ice accumulation process and the ice jam thickness distribution before the inverted siphon are tested and measured. The characteristics of the ice jam distribution and the relationship betweenti/H(ratio of ice jam thicknesstito total water levelH) andFri(Froude number under ice jam) are analyzed. An equation for the ice jam thickness calculation before the inverted siphon is put forward. Analysis results might help the thickness prediction and the ice jam prevention of similar water diversion projects during ice period.
Inverted siphon, ice jam, water diversion, ice thickness, real ice experiment
Introduction
For open channel water diversion projects in northern China, the ice jam is an important issue in winter. Examples of such projects include the Water Diversion Project from Yellow River to Qingdao City and the Water Diversion Project from Yellow River to Tianjin City[1]. Inverted siphons are commonly used in water diversion projects. Once one of them is jammed along the channel, the safe operation of the whole project will be threatened. Inverted siphons usually were reported to be jammed by ice, such as the inverted siphons of the Shahe irrigation district in 2003 and the water diversion project from Yellow River to Baiyangdian in 2008. For preventing inverted siphonsfrom ice jam, the discharge of the Beijing-Shijiazhuang section in the Middle Route of the South-to-North Water Diversion Project was reduced to about 10 m3/s, only 1/6 of the design discharge. So the water diversion efficiency of the water diversion projects is significantly lowered during the ice period.
At present, the safe operation of inverted siphons during ice period is not well studied, apart from the studies of ice transportation through a submerged gate[2,3]. The ice jam formation and the thickness distribution are issues to be explored for inverted siphons. To prevent the ice jam, a conservative value of Froude number was usually used for the safe operation of inverted siphons[4-8], which would sharply decrease the water transfer capacity in winter. So a better understanding of the ice jam thickness along the channel is urgently desirable.
With Tanghe inverted siphon of the Middle Route of the South-to-North Water Diversion Project in China as an example, the ice accumulation processes before the inverted siphon were tested under the real ice condition by the experiment platform of China Institute of Water Resources and Hydropower Research[9]. The characteristics of the ice jam distribution and the relationship betweenti/HandFriare analyzed in this paper. And then an equation for the icejam thickness calculation before an inverted siphon is put forwarded.
1. Ice entrainment and transportation
According to hydrostatics, the forces on the ice floe are balanced by gravity and buoyancy. But according to hydrodynamics, the additional Bernoulli’s effect and the flow separation should be considered (as shown in Fig.1).
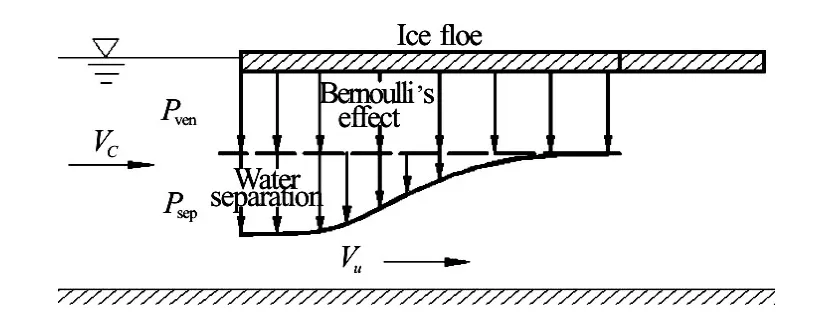
Fig.1 Negative pressure distribution caused by Bernoulli effect and flow separation
The critical conditions of the ice entrainment can be described by[10]

whereVcris the critical velocity upstream of the ice,gis the acceleration of gravity,ρiandρwrepresent the densities of ice and water respectively,tis the thickness of the ice floe, andKis the coefficient.
The critical condition of the under-turning submergence can be described as[10]
whereVcis the flow velocity in the upstream open channel,Vuis the flow velocity under the ice,Lis the length of the ice,αis the under-turning angle when the leading edge of ice just submerges,tiis the ice thickness below the water surface.
The under-turning angleαcan be calculated by
When the ice submerges at the leading edge of the ice jam, it may be transported downstream or accumulated at the bottom of the ice jam, which will thicken the ice jam. This critical hydraulic conditions can be described as[11]

wheresjis the porosity of the ice jam,si=ρi/ρw.
For the last 30 years, it has been believed that the most important variables were the Froude number based on velocity, the submerged depth or the ratio of the submerged depth to the full water depth. Pretty good discrimination between the ice entrainment and the non-entrainment has been achieved using these variables.
2. Experimental set up
A series of experiments are conducted in a flume of 50 m long, 0.8 m wide and 0.8 m high. A 6 m long inverted siphon is used to model the typical Tanghe inverted siphon, and the model scale is 1:23.4 (according to the width of the flume and the prototype dimension of Tanghe inverted siphon). Because of the limitation of the laboratory length, the horizontal length of the inverted siphon model is shortened. And the height of the inverted siphon inlet is 0.244 m. Ice pieces of average dimension of 0.276 m×0.0186 m× 0.0025 m are used to model the ice accumulation and the transportation at the inlet of the inverted siphon. The use of a real ice material can overcome many disadvantages of plastic and paraffin, such as the friction coefficient, the adhesiveness, and the soakage[12-14]. The detailed arrangement of the inverted siphon and the flume is shown in Fig.2. The simplified shape of the inverted siphon inlet is shown in Fig.3, whereH1is the submerged depth from the water surface to the top of the inlet. A thickness measuring section is set every 0.1 m, with nineteen sections (Section 1 to Section 19) before the inlet of the inverted siphon.
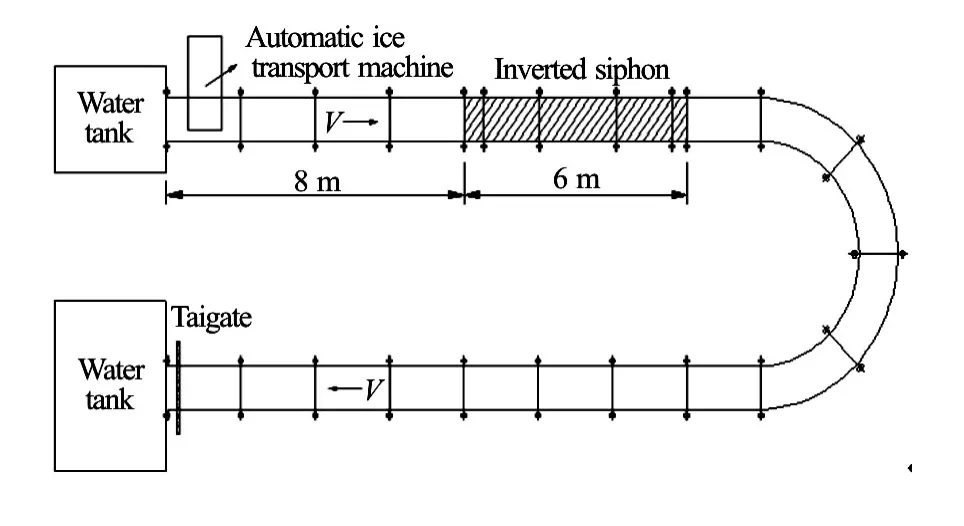
Fig.2 Layout of inverted siphon experiment
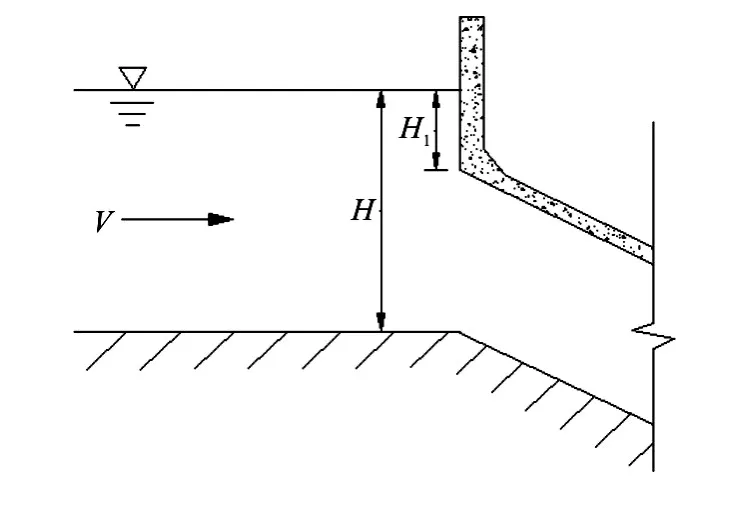
Fig.3 Simplified figure of inverted siphon inlet
The real ice experiment platform is automatically operated, and it consists of the control computer, the DDC device drive and the data collecting module, the axial flow fans, the centrifugal fans, the heating system, the temperature feed-back system, 9 refrigeration units and so on. 27 high-accuracy temperature sensors are distributed along the platform to provide real-time temperatures for the temperature control system . By an air temperature control system, the lowest laboratory temperature can be reduced to −15oC, with a control accuracy of ±0.5oC and the temperature fluctuation of less than 1oC.
3. Experiment cases
49 ice accumulation cases are tested. The value ofHis in the range between 0.254 m and 0.354 m, the flow dischargeQis in the range between 13.1 L/s and 54.4 L/s. And the incoming ice discharge is 0.12 L/s, which is enough for the ice jam accumulation. All experiment cases are shown in Fig.4. These cases cover the normal operation conditions of inverted siphons in the Middle Route of the South-to-North Water Diversion Project. The symbol × in Fig.4 represents the critical condition for the ice transportation into the inverted siphon. The cases which are lower than the symbol × involve no ice transportation, in other cases, ice will enter the inverted siphon.
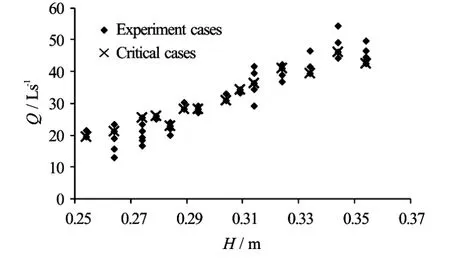
Fig.4 The water level (H)and flow discharge (Q)of experiment cases
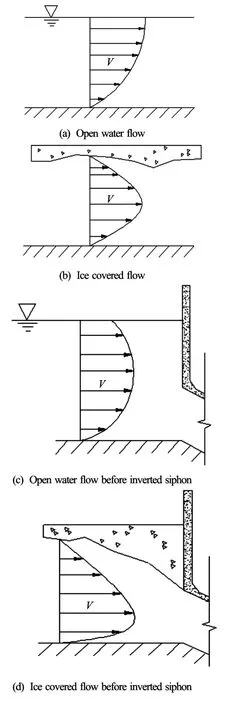
Fig.5 Vertical velocity distributions
4. Ice accumulation characteristics
In the actual project, the water surface is higher than the top of the inverted siphon inlet, so the submerged ice will not enter the inverted siphon immediately and continue to accumulate at the inlet unless the water transportation capacity is high enough. The shape of the inverted siphon inlet also influences the vertical velocity distribution. The upper flow velocity before the inverted siphon is smaller and the location of the maximum velocity is closer to the channel bed, which is much different from the common open water flow or the ice covered flow (Fig.5)[15-17]. Under theinfluences of above factors, the ice accumulation and its distribution before the inverted siphon have their own characteristics.
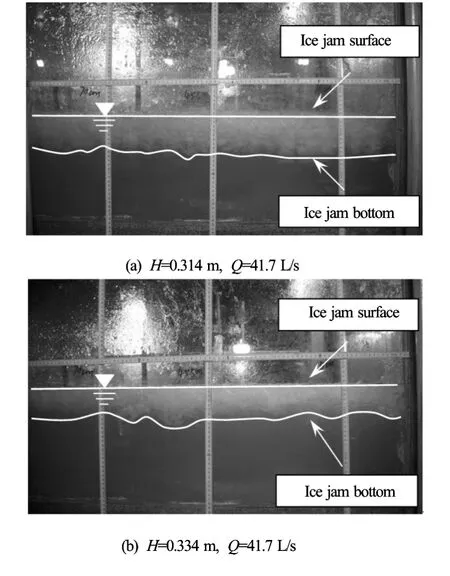
Fig.6 Ice jam distributions before inverted siphon (constant value ofQwith differentH)
Under the same flow discharge condition, the smaller the water depth, the larger the ice jam thickness becomes. This is because a smaller water depth means a higher Froude number when the flow discharge is fixed, and a larger ice jam thickness is needed to balance the water thrust (Fig.6). Similarly, under the same water level condition, a larger flow discharge leads to a larger ice jam thickness (Fig.7). But the largest ice jam thickness is not found at the critical case that the ice is just not transported into the inverted siphon. When the ice transportation discharge of the channel is less than the upstream incoming ice discharge, the ice jam will be thickened. After the flow discharge is increased to a certain level, along with the enhanced water thrust, more ice will be transported downstream, and the ice jam thickness tends to decrease, the leading edge of the ice jam will also not be developed upstream. Figure 8 shows the ice jam thickness distribution under different flow discharge conditions when the water depthH=0.345 m. It is obvious that the ice jam thickness whenQ=46.6 L/sis larger than that whenQ=42.6 L/s, but whenQincreases to 49.7 L/s, the ice jam thickness decreases (whereSis the distance from the inlet of the inverted siphon). Overall, the maximum ice jam thickness is close to the submerged depth(H1). This is because when the ice jam thickness is greater than the submerged depth (H1), the adhesiveness among the ice is hard to balance the drag force of the water.
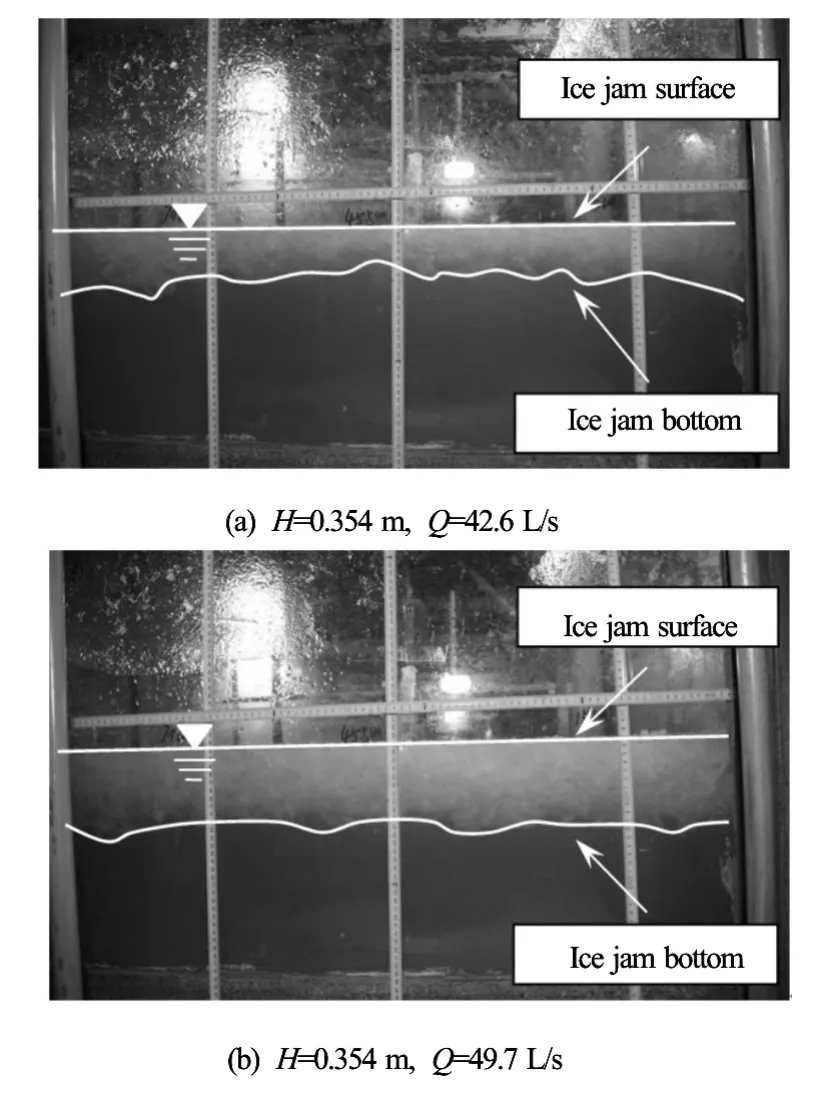
Fig.7 Ice jam distributions before inverted siphon (constant value ofHwith differentQ)
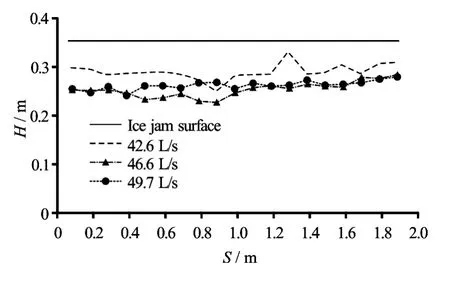
Fig.8 Ice jam thickness distribution under different flow discharge conditions(H=0.345 m)
For the distribution of the ice jam thickness along the channel, the upstream thickness is slightly less than that downstream. One reason may be that the ice jam turns the open water flow to an ice covered flow and the area of the flow section is also reduced, so the water depth along the channel increases and then the Froude number of the channel will decrease along with the development of the ice jam. In critical cases, when the water depthH=0.254 m-0.304 m, 0.309 m-0.334 m and 0.339 m-0.354 m, the average ice jam thickness along channel is about 0.02 m-0.04 m, 0.04 m-0.06 m and 0.05 m~0.10 m, respectively.
Along with the increasing value ofH1/H, the critical Froude number increases, which is used to judge if the ice is transported or not. At a low submerged depth(H1), the critical Froude number is about 0.06, at a high submerged depth (H1), the critical Froude number can be increased to 0.08-0.09. Obviously, the large submerged depthH1is not advantageous for the ice transportation downstream. Along with the increase of the submerged depth(H1), a greater force is needed to overcome the buoyancy and the increased transportation distance.
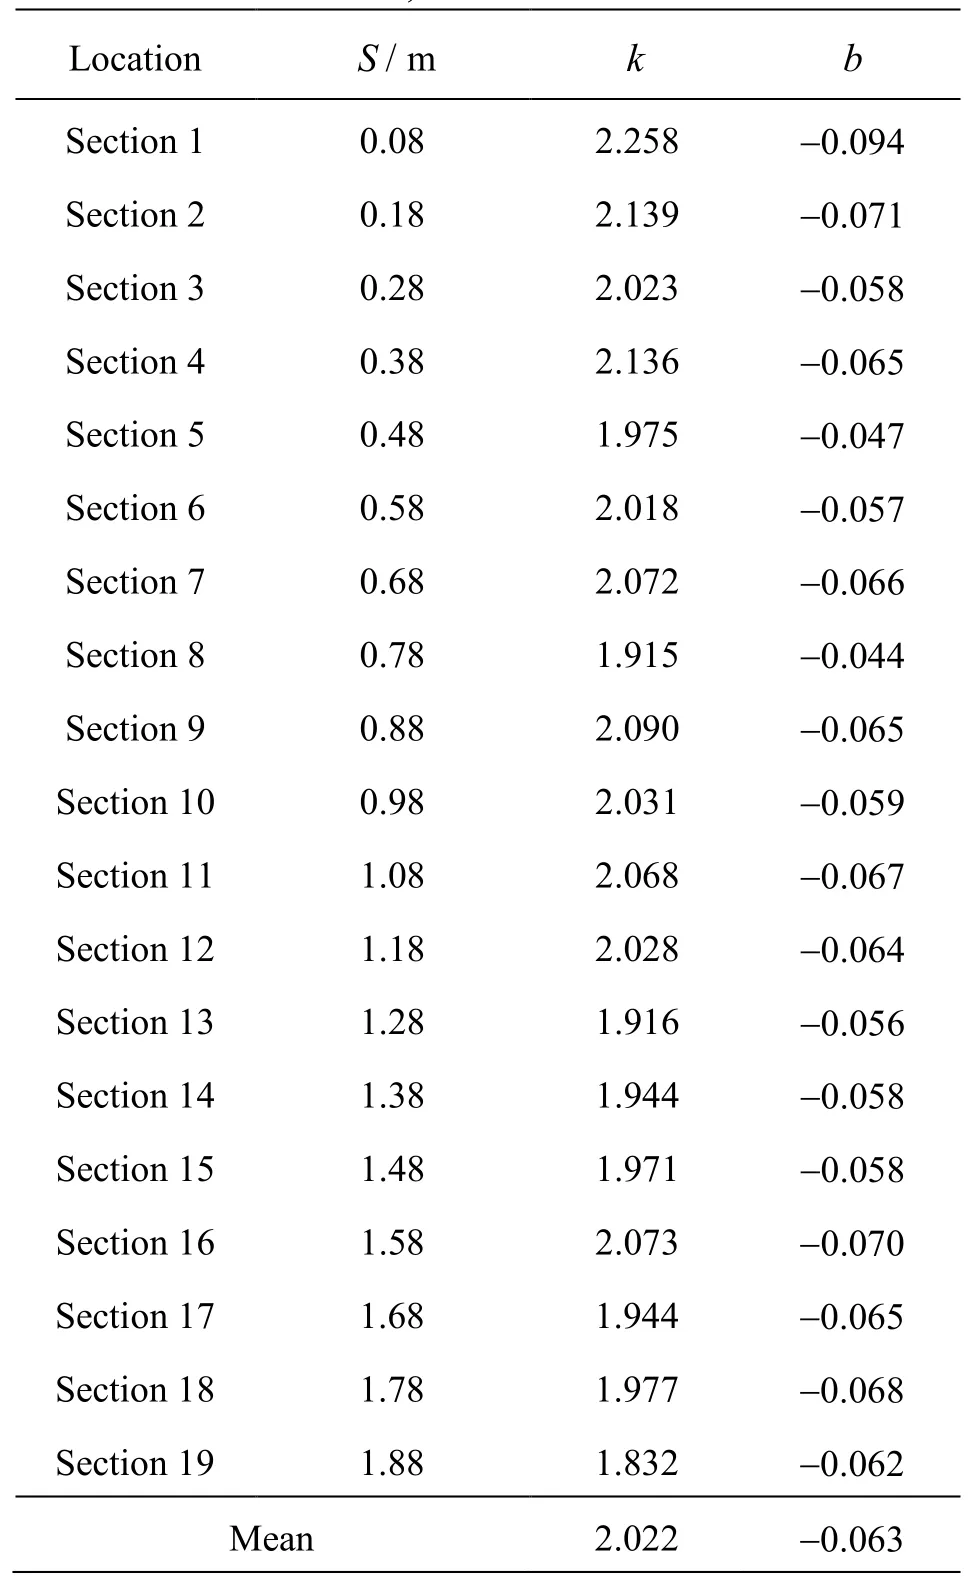
Table 1 The values ofk,bandSfor all sections
5. Ice jam thickness calculation along the channel
The larger the Froude number under the ice jamFri, the larger the ice jam thickness is needed to balance the water thrust. So the ice jam thickness is closely related to the Froude number under the ice jam. In our experiments, the value ofH1/Hvaries from 0.039 to 0.330, andFr(Froude number of open channel upstream) ranges from 0.039 to 0.109. It is obvious that the ice jam thickness before the inverted siphon is closely related to the total water depthH(whenHis fixed, it is related to the submerged depthH1=H−244) and the Froude number under the ice jamFri. According to the plots ofti/HversusFriof all experiment cases, the following linear equation is found to describe the relationship betweenti/HandFri
wherekandbare coefficients, varying with the distance from the inlet of the inverted siphon.
Equation (5) can be used to calculate the ice jam thickness along the channel. The value ofkis in the range between 1.832 and 2.258, with a mean value of 2.022, the value ofbis in the range between 0.044 and 0.094, with a mean value of 0.063. All values ofkandbare shown in Table 1. On the whole, the values ofkandbdo not have a large variation.
The comparison of the measured data and the calculation results of Section 1, Section 9 and Section 19 are shown in Figs.9(a)-9(c), respectively. The mean values ofti/HandFriin all cases are shown in Fig.9(d) (one case corresponds to one data point,ti/HandFriare the mean values of all sections). Figure 9 shows that with the increase ofFri, the criticalti/His also increased. For the section which is closer to the inlet of the inverted siphon, the values ofkandbare larger, on the other hand, the values are smaller for the section away from the inlet of the inverted siphon. This is because the ice jam thickness at the section near the inlet is larger than that at the section far away from it. Symbol × represents the critical case in Fig.9(d). In a low submerged depth case, the value of the criticalFriis about 0.07-0.08, in a high submerged depth case, the value of the criticalFriis about 0.10-0.12. Figure 9 shows that Eq.(5) can fit the measured data well, which can be used to predict the ice jam thickness along the channel by coefficients shown in Table 1. For the mean value calculation in every case, the coefficients shown in Fig.9(d) can be used.
It is interesting that our experiment results have a similar tendency as those at the upper Hequ reach of the Yellow River (1982-1989) and St. Lawrence River (1947-1950)[18-20]. For St. Lawrence River, the Froude number under the ice jam is between 0.05 and 0.25, which is also similar to our experiments (Fig.10). For the upper Hequ reach jam, the larger the value ofFri, the larger the value ofti/Hwill be, but for the lowerHequ reach jams, asFriincreases,ti/Hdecreases (Fig11). One main reason may be that after the formation of the upper ice jam, the ice supply for the lower reach is decreased. Along with a larger Froude number, the water transport capacity is larger and may exceed the incoming ice supply, soFriincreases,ti/Hdecreases for the lower Hequ reach. This shows that the ice discharge also plays an important role in the ice jam process.
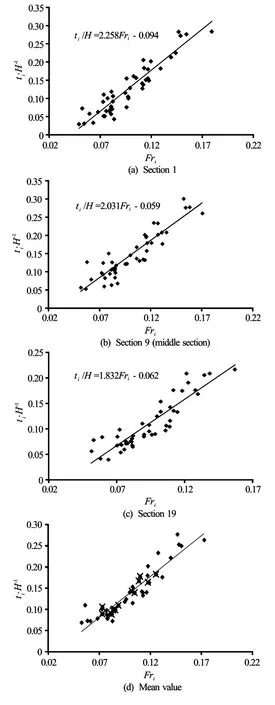
Fig.9 The comparison of measured data and calculations
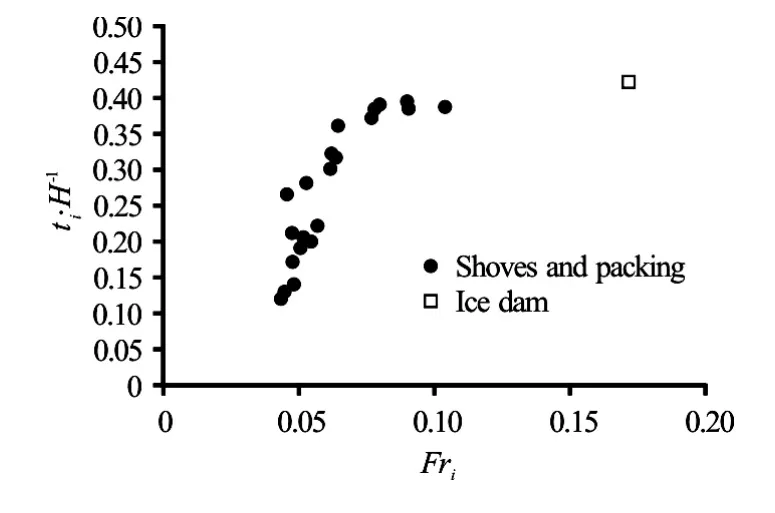
Fig.10 Relationship betweenFriandti/Hof St. Lawrence River
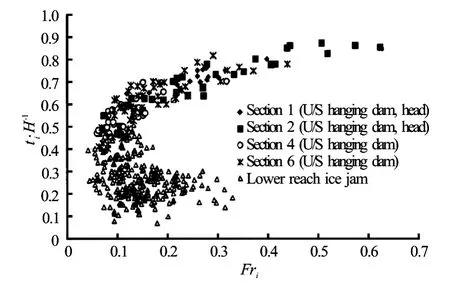
Fig.11 Relationship betweenFriandti/Hof Hequ reach
6. Conclusions
Based on real ice experiments under different hydraulic conditions, the ice jam accumulation process before the inlet of the inverted siphon is studied. With an ice discharge of 0.12 L/s, it is shown that the larger the Froude number under the ice jam(Fri), the larger the dimensionless ice jam thickness(ti/H)will be. The ice jam thickness(ti)is not always increased. When the Froude number of the upstream open channel is large enough (about 0.1 in the experiments), the ice jam thickness(ti)has a tendency to decrease, as shown in Fig.8. The ice supply is also an important factor for the ice jam thickness, an insufficient ice supply may lead to opposite results, just as in the lower Hequ reach of Yellow River. For a water diversion project, the length of every section is about tens of kilometers and the ice jam begins from a downstream hydraulic control structure, just as an inverted siphon, a gate and so on, so the ice supply is considered to be sufficient.
The relationship between the dimensionlessti/HandFriis also investigated in this paper. And a linear equation with the two coefficientskandbis found to describe the ice jam thickness distribution along the channel. And the value of the coefficientkis in the range between 1.832 and 2.258, the value of the coefficientbis in the range between 0.044 and 0.094.
These analysis results may help the ice jam prevention and the safe operation of similar water diversion projects in a high latitude area during ice period.
[1] Fu H., Yang K. L., Wang T. et al. Progress in the study of river ice hydraulics [J].South-to-North Water Transfers and Water Science and Technology, 2010, 8(1): 14-18(in Chinese).
[2] Fu H., Yang K. L., Guo Y. X. et al. An experimental study on ice jam prevention of typical inverted siphon for Southto-North Water Diversion Project [J].Advances in Water Science, 2013, 24(5): 736-740(in Chinese).
[3] Ashton G. D. Ice entrainment through submerged gate [C].19th IAHR International Symposium on Ice. Vancouver, British Columbia, Canada, 2008, 129-138.
[4] Beltao S., Carter T., Rowsell R. Measurements and analysis of ice breakup and jamming characteristics in the Mackenzie Delta, Canada [J].Cold Regions Science and Technology, 2012, 82(4): 570-576.
[5] Shen H. T. Mathematical modeling of river ice processes [J].Cold Regions Science and Technology, 2010, 62(1): 3-13.
[6] Guo X. L., Yang K. L., Fu H. et al. Simulation and analysis of ice processes in an artificial open channel [J].Journal of Hydrodynamics, 2013, 25(4): 542-549.
[7] Dow K. E., Hicks F. E., Steffler P. M. Experimental investigation of the pressure distribution beneath a floating ice block [J].Journal of Hydraulic Engineering,ASCE, 2011, 137(4): 399-411.
[8] Ashton G. D. River and lake ice thickening, thinning, and snow ice formation [J].Cold Regions Science and Technology, 2011, 68(1): 3-19.
[9] Fu H., Yang K. L., Tan S. W. et al. Development and application of low temperature ice-hydrodynamics experiment platform [J].Journal of Hydraulic Engineering, 2013, 44(3): 355-360(in Chinese).
[10] Ashton G. D. Froude criterion for ice block stability [J].Journal of Glaciology, 1974, 13(68): 307-313.
[11] Shen H. T. Mathematical modeling of river ice processes [J].Cold Regions Science and Technology, 2010, 62(1): 3-13.
[12] Matsumoto K., Koshizuka M., Honda M. et al. Measurement on nano scale by scanning probe microscope for obtaining real ice adhesion force [J].International Journal of Refrigeration, 2014, 41(5): 181-189.
[13] Wang J., Chen P. P., SUI J. Progress in studies on ice accumulation in river bends [J].Journal of Hydrodynamics, 2011, 23(6): 737-744.
[14] Wang J., Shi F. Y., Chen P. P. et al. Impact of bridge pier on the stability of ice jam [J].Journal of Hydrodynamics, 2015, 27(6): 865-871.
[15] Sui J., Wang J., He Y. et al. Velocity profiles and incipient motion of frazil particles under ice cover [J].International Journal of Sediment Research, 2010, 25(1): 39-51.
[16] Beltaos S. Progress in the study and management of river ice jams [J].Cold Regions Science and Technology, 2008, 51(1): 2-19.
[17] Yamazaki M., Koyama S., Ken-Ichi H. et al. Accumulation of frazil slush and velocity distribution under the ice cover [J].Journal of Dynamic Systems Measurement and Control, 2014, 136(3): 696-706.
[18] SUI J., Karney B., Fang D. Variation in water level under ice-jammed condition–Field investigation and experimental study [J].Nordic Hydrology, 2005, 36(1): 65-84.
[19] SUI J., KARNEY B., SUN Z. et al. Field investigation of frazil jam evolution−A case study [J].Journal of Hydraulic Engineering,ASCE, 2002, 128(8): 781-787.
[20] Michel B. Comparison of field data with theories on ice cover progression in large rivers [J].Canadian Journal of Civil Engineering, 1984, 11(4): 798-814.
* Project supported by the National Natural Science Foundation of China (Grant No. 51679263), the Special Scientific Research Fund of Public Welfare Profession of China (Grant No. 201501025), and the Research Fund of State Key Laboratory of Simulation and Regulation of Water Cycle in River Basin (Grant No. 2015TS04).
Biography:Hui Fu (1981-), Male, Master, Senior Engineer
Xin-lei Guo, E-mail: guoxinlei@163.com
猜你喜欢
杂志排行

水动力学研究与进展 B辑的其它文章
- Large eddy simulation of free-surface flows*
- Effect of internal sloshing on added resistance of ship*
- Large eddy simulation of turbulent attached cavitating flow with special emphasis on large scale structures of the hydrofoil wake and turbulence-cavitation interactions*
- Assessment of the predictive capability of RANS models in simulating meandering open channel flows*
- The lubrication performance of water lubricated bearing with consideration of wall slip and inertial force*
- Lattice Boltzmann simulations of oscillating-grid turbulence*