Experimental 15-day-lead statistical forecast of intraseasonal summer monsoon rainfall over Eastern China
2016-11-23LIJianYingandMAOJiangYu
LI Jian-Yingand MAO Jiang-Yu
aState Key Laboratory of Numerical Modeling for Atmospheric Sciences and Geophysical Fluid Dynamics (LASG), Institute of Atmospheric Physics,Chinese Academy of Sciences, Beijing, China;bJoint Center for Global Change Studies, Beijing, China;cDepartment of Earth Sciences, University of Chinese Academy of Science, Beijing, China
Experimental 15-day-lead statistical forecast of intraseasonal summer monsoon rainfall over Eastern China
LI Jian-Yinga,cand MAO Jiang-Yua,b
aState Key Laboratory of Numerical Modeling for Atmospheric Sciences and Geophysical Fluid Dynamics (LASG), Institute of Atmospheric Physics,Chinese Academy of Sciences, Beijing, China;bJoint Center for Global Change Studies, Beijing, China;cDepartment of Earth Sciences, University of Chinese Academy of Science, Beijing, China
This study utilizes daily Asian Precipitation-Highly-Resolved Observational Data Integration Towards Evaluation (APHRODITE) gridded rainfall and the U.S. National Centers for Environmental Prediction-Department of Energy reanalysis II products to examine the intraseasonal oscillations (ISOs) of rainfall over Eastern China during each summer of 1996, 2002, and 2006. These three cases represent three typical spatial patterns of intraseasonal rainfall anomalies over Eastern China, with the strongest intraseasonal rainfall occurring over the middle and lower Yangtze Basin, southern Yangtze Basin, and Southeast China, respectively. The intraseasonal rainfall anomalies over Eastern China are dominated by both 30-60- and 10-20-day ISOs in each summer and are further modulated by the boreal summer ISOs(BSISOs) over the entire Asian summer monsoon region. The objective of this study is thus to apply the Bayesian wavelet-banding (WB) scheme to predicting intraseasonal rainfall over Eastern China. Several key factors associated with BSISOs are selected as predictors to experimentally develop a 15-day-lead statistical forecast. The forecast results show promise for the intraseasonal rainfall anomalies over Eastern China. Correlations generally greater than or equal to 0.6 are noted between the observed and predicted ISOs of rainfall over the major intraseasonal activity centers during each of the three summers. Such a high forecasting skill on intraseasonal timescales over various areas in Eastern China demonstrates the general usefulness of the WB scheme.
ARTICLE HISTORY
Accepted 20 October 2015
Intraseasonal oscillations;Bayesian wavelet-banding(WB) scheme; 15-day-lead forecast
1996年长江中下游、2002年华中南部以及2006年华南沿海地区出现了显著洪涝,并均伴随强季节内降水活动。在30-60天和10-20天这两个时间尺度上,季节内降水异常均与亚洲季风区大气季节内振荡密切相关。本文选取亚洲季风区大气季节内振荡的关键要素作为预报因子,应用贝叶斯小波频段方案对季节内降水进行了预报时效为15天的延伸期预测。该方案对这三年的季节内降水中心的预测水平均较好,预测与观测的季节内降水相关系数均在0.6以上。
1. Introduction
The East Asian summer monsoon (E ASM) covers a large area from tropical Southeast Asia to extratropical Northeast Asia (Lau et al. 1988) and is an important circulation system affecting the weather and climate in Eastern China. The EASM has considerable variability on a wide range of timescales (Webster et al. 1998; Yan et al. 2011), in which intraseasonal oscillations (ISOs) are important variations in determining active and break sequences within each summer monsoon season (e.g.,Li and Zhou 2015; Zhou and Chan 2005), with episodes of abundant rainfall (active phases) separated by dry spells (break phases). Strong ISOs could lead to seasonal-mean rainfall anomalies. For example, the 1998 flood over Eastern China in summertime was associated with a 30-60-day ISO (Zhu et al. 2003), whereas the 1996 Yangtze flood resulted from a phase-lock between a wet phase of a 30-60-day ISO and two wet phases of a 10-20-day ISO from late June to mid-July (Li et al. 2015). Forecasts of these wet and dry episodes with longer lead times, particularly 10-30 days, could provide the government with sufficient time for enacting measures to prevent losses. Thus, forecasting the intraseasonal rainfall variations of the EASM is of particular importance. However, this forecasting is highly difficult, particularly for “seamless” dynamical prediction from synpotic to seasonal timescales, because current climate models are not able to effectively reproduce such intraseasonal variability (Sabeerali et al. 2013; Sperber et al. 2013). Therefore, studying statistical forecasting approachesand applications for longer intraseasonal prediction of the EASM is a practical issue of considerable urgency.
Mao et al. (2010) suggested that intraseasonal rainfall anomalies over Eastern China arise in response to the northwestward propagation of tropical intraseasonal systems over the western North Pacific, which is related to the boreal summer ISOs (BSISOs) over the entire Asian summer monsoon (ASM) region (Li et al. 2015). A case study of the Yangtze flood during summer 1996 conducted by Li et al. (2015) showed that BSISOs influenced the Yangtze rainfall by modulating the moisture and vertical motions on both 30-60- and 10-20-day timescales. On the basis of this physical relationship, a multi-linear regression model was constructed in which BSISO indices (Lee et al. 2013) were used to retrieve the Yangtze intraseasonal rainfall anomalies. The correlations between the actual and BSISO-retrieved rainfall anomalies over the Yangtze Basin exceeded 0.6, indicating the potential application of BSISOs in forecasting intraseasonal rainfall anomalies over Eastern China.
Several statistical forecast approaches that have been developed for intraseasonal rainfall exhibit useful skill (Mo 2001; Xavier and Goswami 2007). Mo (2001) combined singular spectrum analysis with the maximum entropy method to forecast intraseasonal convection over the Indian-Pacific Oceans. In their study, the correlation between the observed and predicted outgoing longwave radiation (OLR) reached 0.65 even with a 20-day lead. Based on event-to-event similarity, Xavier and Goswami(2007) developed a physically based real-time forecasting strategy for predicting Indian monsoon ISOs, with correlations greater than 0.6 over central India at a five-pentad lead.
The EASM is controlled by two dominant ISOs for most summers, with distinct periods of 30-60 days and 10-20 days (e.g. Huang et al. 2008), thus a successful forecast should reasonably predict future evolutions of both frequency bands. However, as reported by Webster and Hoyos (2004), noise from one frequency may influence the forecast in another frequency band,thus deteriorating the forecast accuracy. They thereby proposed a dynamically based Bayesian statistical forecast scheme that combines wavelet analysis with multi-linear regression. In this Bayesian wavelet-banding(WB) forecast scheme, regression equations of the filtered predictors and predictand are constructed in each frequency band. This method thus isolates noises from other bands and improves the forecasting skill. Because the intraseasonal rainfall anomalies of our interest have two frequency bands, the WB forecasting scheme is utilized in the present study.
Although there are significant interannual differences in spatial distribution of the intraseasonal rainfall over Eastern China (Lu and Ding 1996; Yuan et al. 2012; Zhu et al. 2003), the strongest intraseasonal rainfall activity often appear in three locations: the Southeast China, the middle and lower ranges of Yangtze River, and the south of Yangtze Basin (not shown). The 1996, 2002, and 2006 summers are selected to reflect these three typical spatial distributions of intraseasonal rainfall over Eastern China. These three cases are also selected to reflect the fact that strong ISOs of rainfall may result in summer-mean flooding(see details in Section 3). Since the selected three cases represent the three patterns of intraseasonal rainfall over Eastern China, the results of WB scheme in forecasting ISOs of rainfall in these three years can indicate the general utility of the WB scheme in Eastern China.
Based on the close relationship between intraseasonal rainfall anomalies in Eastern China and BSISOs over the ASM region, the objective of this study is to apply the WB scheme to develop a tentative 15-day-lead statistical forecast of intraseasonal rainfall anomalies in Eastern China, in which several key factors associated with BSISOs are used as predictors. Section 2 describes the data and methods,and the ISOs of rainfall during each of the three summers are outlined in Section 3. Section 4 presents the choice of predictors and the prediction results. Finally, a summary and discussion are given in Section 5.
2. Data and methods
2.1 Data
The daily gridded rainfall data, extracted from the Asian Precipitation-Highly Resolved Observational Data Integration Towards the Evaluation of Water Resources(APHRODITE) project (Yatagai et al. 2009, 2012), have a highly horizontal resolution of 0.25° longitude × 0.25° latitude and cover the period 1981-2007. The daily atmospheric circulation data were obtained from the National Centers for Environmental Prediction-Department of Energy (NCEP-DOE) Atmospheric Model Inter-comparison Project (AMIP-II) reanalysis (Kanamitsu et al. 2002). Daily OLR data from the National Oceanic and Atmospheric Administration (NOAA) polar-orbiting satellites were used to represent tropical convection (Liebmann and Smith 1996). The OLR and NCEP-DOE reanalysis II data have the same horizontal resolution of 2.5° longitude × 2.5° latitude and were extracted for the period 1981-2010.
2.2 Methods
Daily anomalies for rainfall and other key variables such as OLR and 850-hPa zonal wind were calculated by removing the slow annual cycle (the time-mean and first three harmonics of the day-resolved climatology), and interannualand decadal variability (the mean of the last 120 days) (Lee et al. 2013). A 10-day running mean was finally performed to remove the high-frequency noises, thus isolating the intraseasonal signals.
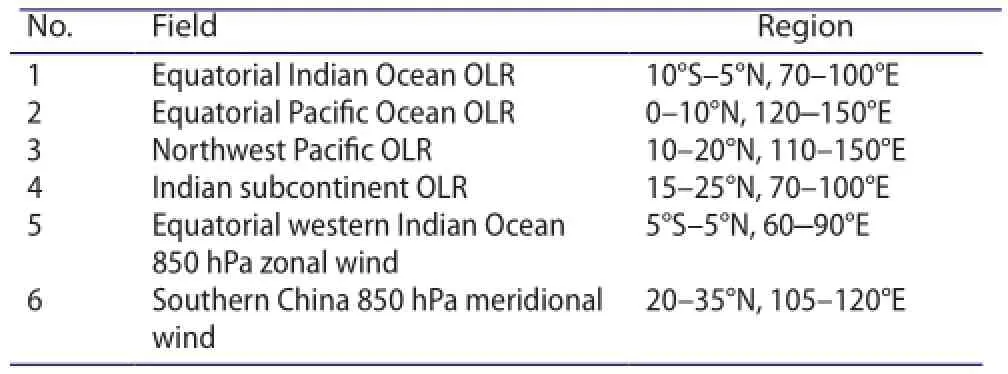
Table 1.Predictors used in the Bayesian wavelet-banding (WB)forecast scheme.
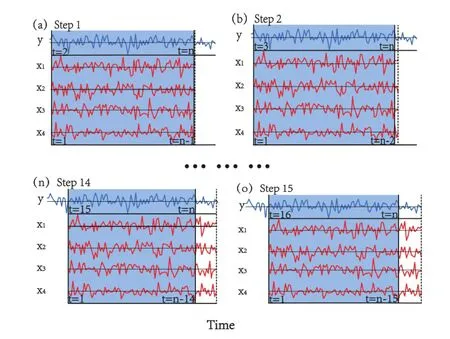
Figure 1.Schematic diagram showing the forecast algorithm for a 15-day-lead forecast step-by-step with time step of one day. The blue curve shows one band of the predictand, the time series of intraseasonal rainfall anomalies. Red curves represent the predictor set from the same wavelet frequency band; only four predictors are shown. (a) Prediction of the first value of the 15-day-lead forecast, denoted by the dashed line, which was determined by a multi-linear regression equation constructed by lagging the predictors one step against the predictand. The blue box shows all of the information used in constructing the multi-linear regression equation. (b)-(o) As in (a) but for the forecasts of the successive values of the predictand.
On the basis of the close physical relationship between BSISOs and intraseasonal rainfall anomalies in Eastern China (e.g., Li et al. 2015), six predictors associated with BSISOs were selected for the intraseasonal rainfall forecast (Table 1), as is subsequently discussed in section 4.1. Following Webster and Hoyos (2004), wavelet analysis was first performed on the time series of area-averaged intraseasonal rainfall anomalies over the strongest ISO domain to identify the frequency bands for the WB scheme. For each frequency band, a multi-linear regression equation was constructed to relate the predictand to the six selected predictors. Although the potential predictability limit of the 30-60-day BSISO is close to five weeks (Ding et al. 2011), the predictability limit of the 10-20-day BSISO is only 21 days (Shi and Ding 2012). Considering these predictability limits, we tentatively produced a 15-day-lead forecast step-by-step with a time step of one day as shown in Figure 1. For each frequency-band, there are six filtered predictors labeled as X = [x1, x2, x3, x4, x5, x6] and one filtered predictand labeled as y in our WB forecast scheme. Because only past data were used in the WB scheme, only predictand and predictors prior to t1were used for a forecast starting at time t1for a future time t1+15. To predict the ithstep of the t1-t1+15forecast, the multi-linear regression equation R[X] was built by regressing X(1)to X(n-i)onto y(i+1)to y(n), with n representing the length of the time series prior to t1and the subscripts in parenthesis denoting the time series of the used predictors and predictand. Then,the predicted intraseasonal rainfall anomaly (y) at time t1+iwas calculated as R[X(n)]. The final predicted intraseasonal rainfall anomalies were obtained by adding the predicted values from the two frequency bands.
3. Rainfall Anomalies over Eastern China during the summers of 1996, 2002, and 2006
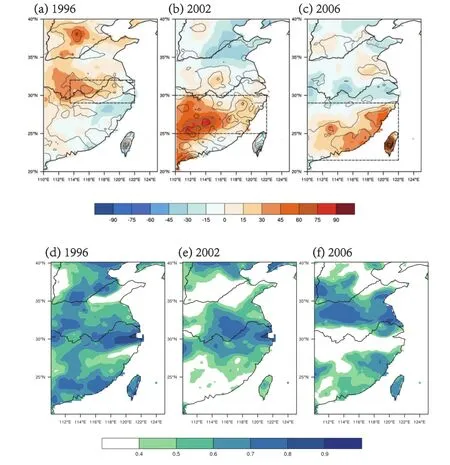
Figure 2.Distributions of percentage of summer total rainfall anomalies (color scales, %) as departures from the 1981-2007 climatology and intraseasonal standard deviations (contours, mm d-1) for extended summers (1 May to 31 October) of (a) 1996, (b) 2002, and (c)2006. The contours are plotted to begin with 2 mm d-1, with an interval of 1 mm d-1. The rectangles denote the regions of maximum intraseasonal rainfall: the lower and middle Yangtze Basin (29-32N, 113.5-122E) in 1996, south of the Yangtze River (25-30N, 110-122E)in 2002, and Southeast China (21.5-29N, 110-122E) in 2006. Each rectangle also represents the domains over which the time series of intraseasonal rainfall anomaly are area-averaged for wavelet analysis in Figure 3. Correlations between the time series of the observed and predicted intraseasonal rainfall anomalies for traditional summers (1 June to 31 August) of (d) 1996, (e) 2002, and (f) 2006.
Figure 2 shows the percentage distributions of seasonal-mean rainfall anomalies during the boreal summer (May 1 to October 31) in 1996, 2002, and 2006. In the 1996 summer, positive rainfall anomalies greater than 15% occurred over the middle and lower Yangtze Basin (Figure 2a), with larger anomalies above 30% appearing over the middle Basin, whereas negative rainfall anomalies appeared to the south. Notice the positive rainfall anomalies also existing over Northern China. Of note is that the maximum rainfall anomalies over the Yangtze Basin were concurrent with larger intraseasonal standard deviations in excess of 2-3 mm d-1(Figure 2a). As suggested by Li et al. (2015),the cumulative effect of these strong ISOs of rainfall is the direct cause of excessive summer-mean rainfall in 1996 summer. Thus, this case was selected to represent the strong ISOs over the middle and lower Yangtze Basin. For the case of 2002, anomalous rainfall exhibited a seesaw pattern (Figure 2b), with positive rainfall anomaliesconfined south of 30°N and negative rainfall anomalies occurring north of 33°N. Note that the amplitudes of positive rainfall anomalies were significantly larger than those of negative rainfall anomalies. The isoline of 45% covered a large area in Southern China with maximum positive rainfall anomalies above 75%, whereas negative rainfall anomalies less than -45% appeared only over the lower reaches of the Yellow River. The strong positive rainfall anomaly center was also accompanied by larger intraseasonal rainfall deviations (Figure 2b), implying that intraseasonal rainfall variability also led to the seasonal-mean flooding over Southern China during summer 2002. During the 2006 summer (Figure 2c), the percentage of summer-mean rainfall anomalies greater than 30% occurred over Southeast China, whereas negative rainfall anomalies less than -15% were observed along the lower and middle Yangtze Basin. The stronger positive rainfall anomalies in Southeast China were also concurrent with strong intraseasonal rainfall variability of 2-3 mm d-1. In contrast, the intensity of intraseaonal rainfall anomalies along the lower and middle Yangtze Basin was weaker. The 2006 summer was thus chosen as a typical case of strong ISOs over Southeast China.
Likewise, we examined the distributions of seasonal-mean rainfall and standard deviations of intraseasonal rainfall in traditional summers including the months of June, July, and August (JJA; not shown). The results were similar to those shown in Figure 2, with amplitudes of both anomalous seasonal-mean rainfall and intensities of intraseasonal rainfall anomalies in JJA comparable to those in the period of May-October for each of the three years. These results indicate that the JJA rainfall anomaly was a major reason for the severe floods in Eastern China. Therefore, we produced the 15-day-lead forecast of intraseasonal rainfall in the key JJA period.
Although the locations of maximum rainfall anomalies varied considerably among years, the positive summer-mean rainfall anomaly centers were all concurrent with strong intraseasonal rainfall variability; negative summer-mean rainfall anomalies were not accompanied by strong intraseasonal variations. As suggested by Webster and Hoyos (2004), intraseasonal fluctuations of summer monsoon rainfall are building blocks for interannual variability; therefore, summer-mean rainfall anomalies and intraseasonal standardized deviations share a common pattern. Over Eastern China, the cumulative effect of intraseasonal rainfall anomalies indeed led to the 1996 Yangtze flood (Li et al. 2015). Therefore, skillful forecasts for intraseasonal rainfall anomalies, particularly over the strong ISO domain, are helpful for improving the seasonal prediction of summer-mean rainfall anomalies.

Figure 3.Wavelet power spectra (contours) of the time series of maximum intraseasonal rainfall anomalies for extended summers (1 May to 31 October) of (a) 1996, (b) 2002, and (c)2006 determined by using the sixth-order Gaussian derivative as wavelet basis function. The contour interval for the spectrum coefficients is 5; the zero-contours are highlighted by thick lines,and the negative contours appear as dashed lines. The shading indicates regions of > 95% confidence level for a red-noise process. The thick dashed line denotes the cone of influence outside which the edge effects become important.
To identify the dominant frequency bands of intraseasonal rainfall anomalies for the Bayesian WB scheme, wavelet spectra of area-averaged intraseasonal rainfall anomalies were analyzed (Figure 3). During the 1996 summer (Figure 3a), the significant spectra covered two distinct frequency bands, 10-20-day and 30-60-day, particularly for JJA months. These two dominant ISOs were also pronounced for the 2002 summer (Figure 3b). In 2006,although the spectra between 30 and 60 days were more significant (Figure 3c), those within 10-20 days were also evident, particularly in JJA. These results indicate that intraseasonal rainfall variations over Eastern China in thesummers of 1996, 2002, and 2006 were all dictated by both 10-20- and 30-60-day ISOs, albeit the locations of major intraseasonal activity centers differed among summers.
4. 15-day-lead forecast of intraseasonal rainfall anomalies over Eastern China
4.1 Choice of predictors
The proper choice of predictors is important for ensuring forecast accuracy. Generally, predictors are determined on the basis of their statistical or physical relationships with the predictand. Actually, both 10-20- and 30-60-day ISOs of rainfall over Eastern China as the predictand are closely related to the BSISO evolutions on the same timescales (Li et al. 2015; Mao et al. 2010).
The 30-60-day BSISO is characterized by a quadrupole structure in anomalous convection and circulation(Lee et al. 2013). Active convection accompanied by anomalous zonal wind convergence in the lower troposphere originates from the equatorial Indian Ocean(EIO; 10°S-5°N, 70-100°E) and propagates eastward as a coupled Kelvin-Rossby wave along the equator (Gill 1980; Wang and Rui 1990) into the Pacific sector. Such anomalous convection over the EIO and equatorial western Pacific (EWP; 0-10°N, 120-150°E) again propagates northward to the Indian continent and northwestward to the northern South China Sea (SCS) and western north Pacific (WNP), forming two complementary meridional dipole patterns along longitudes of India and East Asia/western North Pacific, respectively (Annamalai and Slingo 2001; Lee et al. 2013). When active (inactive) convection anomalies propagate northwestward from the EWP, an anomalous meridional-vertical circulation cell is established along East Asia with descending (ascending) motion over Eastern China, bringing about negative(positive) rainfall anomalies over Eastern China (Li et al. 2015). For the 10-20-day BSISO, convection anomalies over the Indian monsoon and EASM regions evolve in phase (Lee et al. 2013). When active (inactive) convection anomalies exist over the EIO and SCS-WNP, an anomalous vertical circulation cell is also established between the Yangtze Basin and Philippine Sea, thus modulating the precipitation over Eastern China via vertical motion and low-level moisture (Li et al. 2015).
According to the above mentioned close association between BSISOs over the entire ASM area and ISOs of rainfall over Eastern China, the selected predictors should represent the evolution of BSISOs, reflecting the evolution of coupled convection-circulation system from the initiating phase to the most active or inactive phase of each BSISO mode. The anomalous convection on intraseasonal timescales is noted to originate mostly from the equatorial Indian Ocean (the equatorial western Pacific), and then strengthens while propagating northward (northwestward), and finally reaches its strongest state over the Indian Subcontinent (the SCS-WNP). Predictors 1 and 2 respectively denote the convection anomalies over the EIO and EWP, representing the state of BSISO origins. Predictors 3 and 4 describe respectively the anomalous convection conditions over the SCS-WNP (10-20°N,110-150°E) and the Indian subcontinent (15-25°N, 70-100°E),where the strongest BSISOs occur over the ASM area (see Figure 1a of Lee et al. 2013). The combination of the first four predictors depicts the evolution of anomalous convection on the intraseasonal timescales. Predictor 5 is the anomalous 850 hPa zonal wind over the equatorial western Indian Ocean (5°S-5°N, 60-90°E), which represents low-level circulation associated with the anomalous convection over the EIO.
As the BSISOs influence the intraseasonal rainfall anomalies over the Eastern China through the establishment of anomalous vertical circulation cell, the area-averaged anomalous meridional wind over Southern China was defined as Predictor 6 to reflect this key vertical circulation cell.
To sum up, these predictors have essentially captured both the evolutions of BSISOs and the modulating mechanisms on ISO of rainfall over Eastern China (Table 1). Therefore, using these predictors to forecast intraseasonal rainfall is physically reasonable.
4.2 Forecasting results
A 15-day-lead forecast of intraseasonal rainfall anomalies in Eastern China was produced on the basis of the Bayesian WB scheme (Webster and Hoyos 2004) shown in Figure 1. The forecasting skills were evaluated based on the correlation coefficients between the observed and predicted intraseasonal rainfall anomalies. In the 1996 summer (Figure 2d), correlations greater than 0.6 were detected over the lower and middle Yangtze Basin, with the maximum coefficients of 0.8. Note that correlations around another intraseasonal rainfall anomaly center in Northern China also reached 0.6-0.7 (Figure 2d). In 2002(Figure 2e), the correlations were generally above 0.6 south of the Yangtze River, particularly east of 115°E. Although the forecast for the 2006 intraseasonal rainfall anomalies was less skillful than that for the other two years, the correlations were still 0.5-0.6 over most of Southeast China(Figure 2f), with better prediction appearing over some provinces such as Jiangxi, Fujian, and Taiwan. Overall, these results suggest the feasibility of applying the Bayesian WB scheme to intraseasonal forecasts of rainfall anomalies in Eastern China with a lead time of 15 days.
5. Summary and discussion
The intraseasonal rainfall anomalies over Eastern China are closely related to the BSISOs over the entire ASM region,with strong rainfall ISOs mostly resulting in above-normal summer-mean rainfall. Therefore, it is particularly important to predict the intraseasonal rainfall variations with lead times of 10-30 days. Considering some promising statistical forecast approaches used to detect intraseasonal rainfall anomalies, the present study applies the Bayesian WB scheme to experimentally develop a 15-day-lead statistical forecast of intraseasonal rainfall anomalies over Eastern China.
Because considerable interannual differences are noted in the spatial distribution of intraseasonal rainfall anomalies over Eastern China, the summers of 1996, 2002, and 2006 are selected to represent three typical spatial patterns of intraseasonal rainfall anomalies in Eastern China to demonstrate the general utility of the WB scheme. These three cases are typical of strong ISOs existing over the middle and lower Yangtze Basin, south of Yangtze Basin, and Southeast China, respectively. Wavelet analyses show that intraseasonal rainfall variations over Eastern China during each of these three summers are dictated by both 10-20-day and 30-60-day ISOs. Based on the physical association between the intraseasonal rainfall anomalies over Eastern China and the BSISOs in both these two frequency bands, six predictors related to BSISOs are selected for the Bayesian WB forecast scheme. Predictors 1-5 represent the evolution of BSISOs and Predictor 6 represents the modulation mechanisms of BSISOs on intraseasonal rainfall anomalies. In the 15-day-lead forecasting, multi-linear regression equations were separately constructed for the 10-20-day and 30-60-day filtered predictors and predictand to eliminate noise from the other band.
The 15-day-lead forecast results for each summer of 1996, 2002, and 2006 show promise for forecasting the intraseasonal rainfall anomalies over Eastern China. Correlations between the observed and predicted rainfall anomalies over the major intraseasonal activity centers are mostly greater than or equal to 0.6.
It should be noted that besides the modulations of BSISOs from tropical oceans, other sources also produce intraseasonal rainfall anomalies in Eastern China. Lu et al.(2007) reported that a wave train of vortexes propagating westward in the mid-latitude North Pacific influences the intraseasonal rainfall anomalies in Eastern China by modulating the WNP anticyclone. Fujinami and Yasunari(2009) suggested that the mid-latitude Rossby wave train propagating along the Asian jet affects the 10-20-day rainfall anomalies over the Yangtze and Huaihe basins. Li et al. (2014) found the Pacific-Japan teleconnection pattern,which significantly influences the EASM, exhibits salient intraseasonal variations, indicating that the extratropical wave train of the Pacific-Japan teleconnection pattern is another source for the intraseasonal rainfall anomalies over the Eastern China. Considering that both tropical and extratropical signals influence the intraseasonal rainfall over Eastern China, we will include extratropical predictors into the WB forecast scheme in the further research to improve forecasting skills.
Funding
This research was jointly supported by the National Basic Research Program of China [grant numbers 2014CB953902,2012CB417203, and 2012CB955202], the Priority Research Program of the Chinese Academy of Sciences [grant number XDA11010402], and the National Natural Science Foundation of China [grant numbers 41175059, 41375087, and 91537103].
References
Annamalai, H., and J. M. Slingo. 2001. “Active/Break Cycles: Diagnosis of the Intraseasonal Variability of the Asian Summer Monsoon.” Climate Dynamics 18: 85-102.
Ding, R. Q., J. P. Li, and K.-H. Seo. 2011. “Estimate of the Predictability of Boreal Summer and Winter Intraseasonal Oscillations from Observations.” Monthly Weather Review 139: 2421-2438.
Fujinami, H., and T. Yasunari. 2009. “The Effects of Midlatitude Waves over and around the Tibetan Plateau on Submonthly Variability of the East Asian Summer Monsoon.” Monthly Weather Review 137: 2286-2304.
Gill, A. E. 1980. “Some Simple Solutions for Heat-Induced Tropical Circulation.” Quarterly Journal of the Royal Meteorological Society 106: 447-462.
Huang, F., S. Huang, and X. Zhang. 2008. “Study on the Climatological Intraseasonal Oscillation of Chinese Rainfall.”Periodical of Ocean University of China 38 (2): 173-177.
Kanamitsu, M., A. Kumar, H. M. H. Juang, J. K. Schemm, W. Q. Wang, F. L. Yang, S. Y. Hong et al. 2002. “NCEP Dynamical Seasonal Forecast System 2000.” Bulletin of the American Meteorological Society 83: 1019-1037.
Lau, K. M., G. J. Yang, and S. H. Shen. 1988. “Seasonal and Intraseasonal Climatology of Summer Monsoon Rainfall over East-Asia.” Monthly Weather Review 116: 18-37.
Lee, J. Y., B. Wang, M. C. Wheeler, X. H. Fu, D. E. Waliser, and I. S. Kang. 2013. “Real-Time Multivariate Indices for the Boreal Summer Intraseasonal Oscillation over the Asian Summer Monsoon Region.” Climate Dynamics 40: 493-509.
Li, C. Y., W. Zhou, and T. Li. 2014. “Influences of the Pacific-Japan Teleconnection Pattern on Synoptic-Scale Variability in the Western North Pacific.” Journal of Climate 27: 140-154.
Li, C. Y., and W. Zhou. 2015. “Multiscale Control of Summertime Persistent Heavy Precipitation Events over South China in Association with Synoptic, Intraseasonal, and Low-Frequency Background.” Climate Dynamics 45: 1043-1057. doi:10.1007/ s00382-014-2347-6.
Li, J., J. Mao, and G. Wu. 2015. “A Case Study of the Impact of Boreal Summer Intraseasonal Oscillations on Yangtze Rainfall.” Climate Dynamics 44: 2683-2702.
Liebmann, B., and C. A. Smith. 1996. “Description of a Complete (Interpolated) Outgoing Longwave Radiation Dataset.” Bulletin of the American Meteorological Society 77: 1275-1277.
Lu, E., and Y. H. Ding. 1996. “Low Frequency Oscillation in East Asia during the 1991 Excessively Heavy Rain over Changjiang-Huaihe River Basin.” Acta. Meteo. Sina. 54: 730-736.
Lu, R. Y., H. Ding, C. S. Ryu, Z. D. Lin, and H. L. Dong. 2007.“Midlatitude Westward Propagating Disturbances Preceding Intraseasonal Oscillations of Convection over the Subtropical Western North Pacific during Summer.” Geophysical Research Letters 34: L21702.
Mao, J., Z. Sun, and G. Wu. 2010. “20-50-Day Oscillation of Summer Yangtze Rainfall in Response to Intraseasonal Variations in the Subtropical High over the Western North Pacific and South China Sea.” Climate Dynamics 34: 747-761.
Mo, K. C. 2001. “Adaptive Filtering and Prediction of Intraseasonal Oscillations.” Monthly Weather Review 129: 802-817.
Sabeerali, C. T., A. R. Dandi, A. Dhakate, K. Salunke, S. Mahapatra,and S. A. Rao. 2013. “Simulation of Boreal Summer Intraseasonal Oscillations in the Latest CMIP5 Coupled GCMs.” Journal of Geophysical Research 118: 4401-4420.
Shi, Z., and R. Q. Ding. 2012. “Estimating the Predictability of the Quasi-Biweekly Oscillation Using the Nonlinear Local Lyapunov Exponent Approach.” Atmospheric and Oceanic Science Letters 5: 389-393.
Sperber, K. R., H. Annamalai, L. S. Kang, A. Kitoh, A. Moise, A. Turner,B. Wang, and T. Zhou. 2013. “The Asian Summer Monsoon: An Intercomparison of CMIP5 Vs. CMIP3 Simulations of the Late 20th Century.” Climate Dynamics 41: 2711-2744.
Wang, B., and H. Rui. 1990. “Synotic Climatology of Transient Tropical Intraseasonal Convection Anomalies: 1975-1985.”Meteorology and Atmospheric Physics 44: 43-61.
Webster, P. J., and C. Hoyos. 2004. “Prediction of Monsoon Rainfall and River Discharge on 15-30-day Time Scales.”Bulletin of the American Meteorological Society 85: 1745-1765. Webster, P. J., V. O. Magana, T. N. Palmer, J. Shukla, R. A. Tomas,M. Yanai, and T. Yasunari. 1998. “Monsoons: Processes,Predictability, and the Prospects for Prediction.” Journal of Geophysical Research 103 (C7): 14451-14510.
Xavier, P. K., and B. N. Goswami. 2007. “An Analog Method for Real-time Forecasting of Summer Monsoon Subseasonal Variability.” Monthly Weather Review 135: 4149-4160.
Yan, Z. W., J. J. Xia, C. Qian, and W. Zhou. 2011. “Changes in Seasonal Cycle and Extremes in China during the Period 1960-2008.” Advances in Atmospheric Sciences 28: 269-283. doi:10.1007/s00376-010-0006-3.
Yatagai, A., O. Arakawa, K. Kamiguchi, H. Kawamoto, M. I. Nodzu,and A. Hamada. 2009. “A 44-year Daily Gridded Precipitation Dataset for Asia Based on a Dense Network of Rain Gauges.”Sola 5: 137-140.
Yatagai, A., K. Kamiguchi, O. Arakawa, A. Hamada, N. Yasutomi,and A. Kitoh. 2012. “APHRODITE: Constructing a Long-term Daily Gridded Precipitation Dataset for Asia Based on a Dense Network of Rain Gauges.” Bulletin of the American Meteorological Society 93: 1401-1415.
Yuan, F., W. Chen, and W. Zhou. 2012. “Analysis of the Role Played by Circulation in the Persistent Precipitation over South China in June 2010.” Advances in Atmospheric Sciences 29: 769-781.
Zhou, W., and J. C. L. Chan. 2005. “Intraseasonal Oscillations and the South China Sea Summer Monsoon Onset.” International Journal of Climatology 25: 1585-1609.
Zhu, C., T. Nakazawa, J. Li, and L. Chen. 2003. “The 30-60 Day Intraseasonal Oscillation over the Western North Pacific Ocean and Its Impacts on Summer Flooding in China during 1998.” Geophysical Research Letters 30 (18): 1952. doi:10.1029 /2003GL017817.
17 August 2015
CONTACT MAO Jiang-Yu mjy@lasg.iap.ac.cn
© 2016 The Author(s). Published by Taylor & Francis
This is an Open Access article distributed under the terms of the Creative Commons Attribution License (http://creativecommons.org/licenses/by/4.0/), which permits unrestricted use,distribution, and reproduction in any medium, provided the original work is properly cited.
猜你喜欢
杂志排行

Atmospheric and Oceanic Science Letters的其它文章
- Study on the dependence of the two-dimensional Ikeda model on the parameter
- Aerosol absorption optical depth of fine-mode mineral dust in eastern China
- Characteristics of air quality in Tianjin during the Spring Festival period of 2015
- Change of Arctic sea-ice volume and its relationship with sea-ice extent in CMIP5 simulations
- Calculation of stratosphere-troposphere exchange in East Asia cut-off lows: cases from the Lagrangian perspective
- Evaluation of the individual allocation scheme and its impacts in a dynamic global vegetation model