Gustiness and coherent structure under weak wind period in atmospheric boundary layer
2016-11-23LiQiLongChengXueLingndZengQingCun
Li Qi-Long, Cheng Xue-Lingnd Zeng Qing-Cun
aState Key Laboratory of Atmospheric Boundary Layer Physics and Atmospheric Chemistry, Institute of Atmospheric Physics, Chinese Academy of Sciences, Beijing 100029, China;bUniversity of Chinese Academy of Sciences, Beijing 100049, China
Gustiness and coherent structure under weak wind period in atmospheric boundary layer
Li Qi-Longa,b, Cheng Xue-Lingaand Zeng Qing-Cuna
aState Key Laboratory of Atmospheric Boundary Layer Physics and Atmospheric Chemistry, Institute of Atmospheric Physics, Chinese Academy of Sciences, Beijing 100029, China;bUniversity of Chinese Academy of Sciences, Beijing 100049, China
Statistical analysis of turbulent and gusty characteristics in the atmospheric boundary layer under weak wind period has been carried out. The data used in the analysis were from the multilevel ultrasonic anemometer-thermometers at 47m, 120m, and 280m levels on Beijing 325m meteorological tower. The time series of 3D atmospheric velocity were analyzed by using conventional Fourier spectral analysis and decompose into three parts: basic mean flow (period > 10 min), gusty disturbances (1 min < period < 10 min) and turbulence fluctuations (period < 1 min). The results show that under weak mean wind condition: 1) the gusty disturbances are the most strong fluctuations, contribute about 60% kinetic energy of eddy kinetic energy and 80% downward flux of momentum, although both the eddy kinetic energy and momentum transport are small in comparison with those in strong mean wind condition; 2) the gusty wind disturbances are anisotropic; 3) the gusty wind disturbances have obviously coherent structure, and their horizontal and vertical component are negatively correlated and make downward transport of momentum more effectively; 4) the friction velocities related to turbulence and gusty wind are approximately constant with height in the surface layer.
ARTICLE HISTORY
Atmospheric boundary layer; gusty wind;
coherent structure; weak wind; downward flux of momentum
1. Introduction
Atmospheric boundary layer is influenced by the underlying earth surface such as frictional drag and heat transfer, the fluid motion in atmospheric boundary layer is no longer laminar flow-is turbulent. Turbulence plays an important role in transporting moisture, heat, momentum, and pollutants in the vertical direction. Local winds such as mountain and valley winds, sea breeze, which are caused by geographic variations,can transport moisture, heat, momentum, and pollutants also. Recently, researchers pay more attention to gusty wind. Gusty wind is velocity disturbance whose period is between 1 min and 10 min. Zeng, Hu, and Cheng (2007), Zeng et al. (2010), Cheng et al. (2007), and Cheng, Zeng, and Hu (2011) analyzed gusty wind disturbances under strong wind period. The result shows gusty wind is characterized by coherent structure. The coherent structure of gusty wind is beneficial to vertical flux of horizontal momentum. Hence, gusty wind disturbances are as important as turbulence fluctuations in downward flux of momentum. Gusty wind disturbances can transport moisture and pollutants in the vertical direction. And it is the fundamental mechanism of gusty wind blowing dust (Zeng, Hu, and Cheng 2007).
In engineering, the research on gusty wind is systemic and mature. Recently, more and more researchers realize gusty wind in atmospheric science. Some of them were devoted to statistical analysis of wind gusts or gust factor (Jungo,Goyette, and Beniston 2002; Boettcher et al. 2003; Paulsen and Schroeder 2005). In the prediction of gusty wind, Brasseur (2001) proposed a wind gust estimate method, and it was applied to a numerical regional climate model (Goyette, Brasseur, and Beniston 2003). Thorarinsdottir and Johnson (2012)using non-homogeneous Gaussian regression proposed a new prediction method. Some of them to the numerical simulation of wind gusts (Peinke et al. 2004; Zhu 2008; Agustsson and Olafsson 2009; Cheng, Hu, and Zeng 2012; Cheng et al. 2012).
Although researches on gusty wind have been considerable progress. But, researches on the structure of gusty wind are still lack. Only Zeng, Hu, and Cheng (2007), Zeng et al.(2010), Cheng et al. (2007), and Cheng, Zeng, and Hu (2011)found that: under strong wind period behind cold fronts, the gusty wind is characterized by a coherent structure, and the corresponding vertical velocity is negatively correlated with the horizontal wind component. The results have been verified by Guo's research (Guo et al. 2012).
Is gustiness and coherent structure of wind universal? That is, in gusty disturbance spectrum area, whether has the gustiness and coherent structure under the weak wind condition?There is no report on it so far. We use the data obtained frommultilevel ultrasonic anemometer-thermometers located on 325m meteorological tower in Beijing in 2003 to make statistical analysis in order to fill this gap.
For simplicity, we take the mean wind direction as the x-axis, so thatu-(t)is equal to the wind speed, and v-(t)=0.
2. Data Processing
2.1 Data
The multilevel ultrasonic anemometer-thermometers (UAT-1)with frequency of 10 Hz are located at 47m, 120m, and 280m levels on 325m meteorological tower in Beijing, measuring(u,v,w) the three components of velocity and the sonic virtual temperature Ts.
In this paper, 10 h data per month, total 120 h data in 2003 were analyzed. According to Beaufort wind scale, wind speed of 2 m/s is light breeze. So, 2 m/s is chosen as the threshold of velocity data. In all cases of 120 h data, the mean wind speed at the all the three levels are less than 2 m/s. Special atmospheric stratification is not chosen in this paper. And spikes removal is used for quality control of data.
2.2 Extraction of gusty wind by spectral analysis
First of all we simply use the Fourier spectral analysis to decompose the single point time series f into two parts: the low frequency part, whose period is larger than a timescale; and the high frequency part, f′, whose period is equal to and smaller than τ1. So, we have:
Here we take τ= 10 min, call as basic or mean flow, andf′as1′the fluctuation. Next,fis decomposed further into two parts by Fourier spectral analysis with another timescale τ0=1 min,call lower frequency part as gusty wind disturbance,fg(t), and the higher frequency part as turbulences,ft(t). Thus, we haveFor example, of its three components, eiu, eiv, and eiw, andeiuand so on. Further more, we calculate the average of eiu,ivand eiwfor every 1 h (ensemblemean for one case or one hour) and denoted them as Eiu, Eiv, and Eiw, respectively.
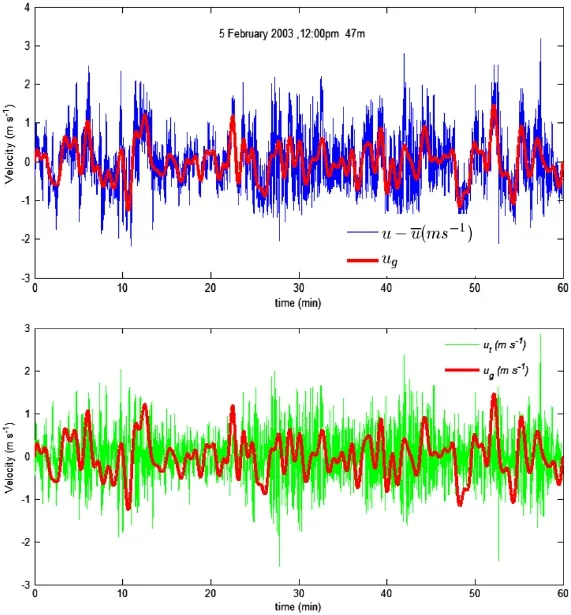
Figure 1. Time series of u′(t)=u(t)-u-(t),w′(t)=w(t)-w-(t)(blue), the gusty wind disturbancesug(t),wg(t)(red), and the turbulent fluctuationsu(t),w(t)(green), at 47 m at 12:00 pm-13:00 pm 5 February 2003.
Etu, Etv, and Etware shown in Figure 2. It can be seen that in most cases they are <0.07 m2s-2. They are nearly equal in these cases; that is turbulence is nearly isotropic whenEtu< 0.07 m2s-2. But the turbulence is anisotropic whenEtu> 0.07 m2s-2.
Egu, Egv, and Egware shown in Figure 3. It can be seen that point are not just located in the vicinity of lineEgu=Egvor Egu=Egw. Therefore, gusty wind disturbances are not isotropic but the turbulent fluctuation is near isotropic.
Figure 4 shows ug(t)andwg(t). Time series ofug(t)and wg(t)are gusty wind wave packets, but disturbed by strong turbulence or convective eddies. In this picture, it can be seen that gusty wind at every level possesses the coherent structure: the vertical velocity is downward when horizontal velocity is in the peak phase, but upward when horizontal velocity is in the valley phase. Sometimes, convection disturbs the gusty wind and violates the coherent structure.
where the timescale ofu- is larger than 10 min; Time scale of gusty wind disturbances is between 1 min and 10 min; and the turbulent fluctuations,ut, is less than 1 min. Zeng et al.(2010) indicated that the period of gusty wind is 3-6 min. To be prudent, we take τ0=1 min and τ1= 10 min. And this matches the definition of gusty given by WMO (2008).
Figure 1 shows an example of time series off-, f,fg, and (f=u,w). Neglecting the rapid fluctuations, the wind gustiness in f′can be very clearly seen and well represented byfg. Series ftshows more rapid fluctuations.
3. The Characteristics of gusty wind disturbances and turbulences
Considering e =eg+et, where egand etcorrespond to gusty wind and turbulence, respectively. Here ei(i=t, g) is the sum

Figure 1. (Continued).
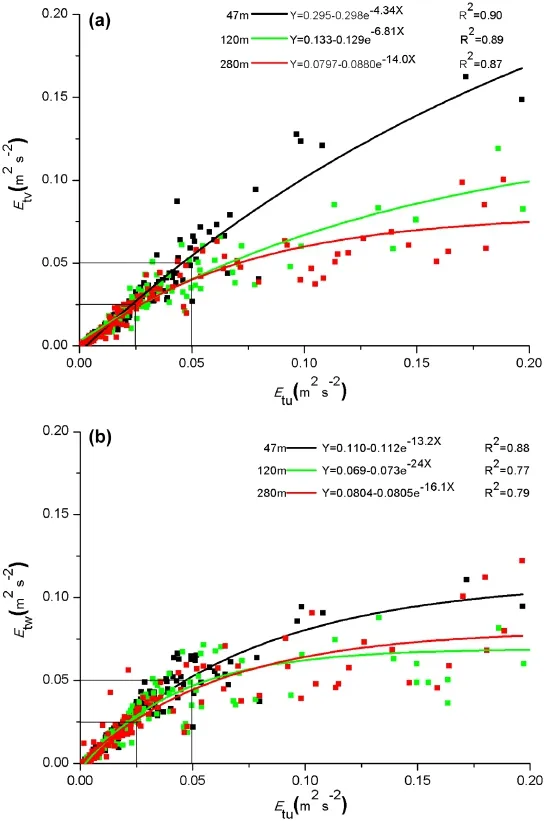
Figure 2.Three components of turbulence kinetic energy Etu, Etv, and Etwat three levels. (a)EtvversusEtu. (b)Etwversus Etu.
According to Zeng, Hu, and Cheng (2007), Zeng et al.(2010), Cheng et al. (2007), and Cheng, Zeng, and Hu (2011),the coherent structure of the gusty wind disturbances is also very well represented quantitatively by the correlation coefficient,Rugwgor simply denoted as Rg:
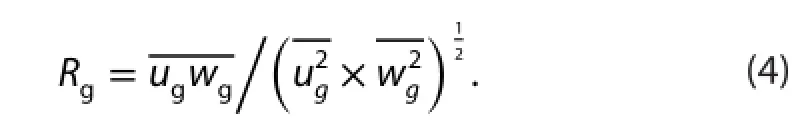
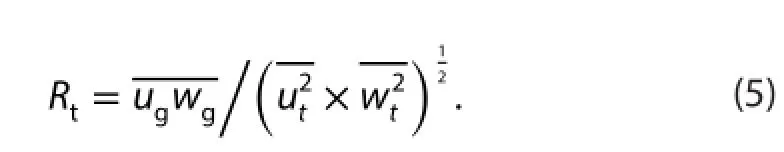
Table 1 gives Rg. As the same, the correlation coefficient for turbulent fluctuationis given in Table 2, and It can be seen from these tables that most ofare between 0.2 and 0.5, but most ofare less than 0.1. This clearly indicates that the structure of gusty wind disturbances is coherent,and that of turbulences is near random. Very few cases in Table 1 have<0.2, maybe they are disturbed by convection or suppressed by strong stable stratification, hence structurededdies can occur only random. These results also show, that the coherency of gusty wind disturbance under weak wind is less than that under strong wind (|Rg|>0.5, see Cheng, Zeng,and Hu (2011) ).

Figure 3.Three components of gust kinetic energy Egu, Egv, and Egwat three levels. (a)EgvversusEgu. (b)Egwversus Egu.
Next, the vertical flux of momentum can be directly calculated byThe direction of vertical flux contributed by the gusty disturbances even can be determined by the sign of Rg.means, that there is Rg<0and downward flux of momentum. And in our cases it is the case.
4. The vertical profiles of turbulences and gusty disturbances
Gust kinetic energy,eg=egu+egv+egw, turbulent kinetic energy,et=etu+etv+etw. The one-hour averages ofeg, etare denoted as Eg, Et. The vertical profiles ofEg, Etare given in Fig. 5, respectively. It can be seen that (1)Egis approximately constant with height; (2)Eg>Etat every height. Our calculations show gust kinetic energy accounted for 65% at 47 m height,64% at 120 m height, and 55% at 280 m height of total eddy kinetic energy (E′).
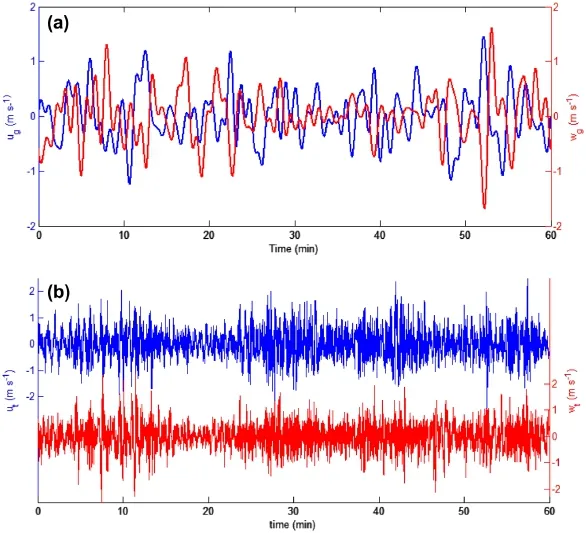
Figure 4.(a) Time series ofug(t)andwg(t). (b) Time series ofut(t)andwt(t)at 47 m at 12:00 pm-13:00 pm 5 February 2003.
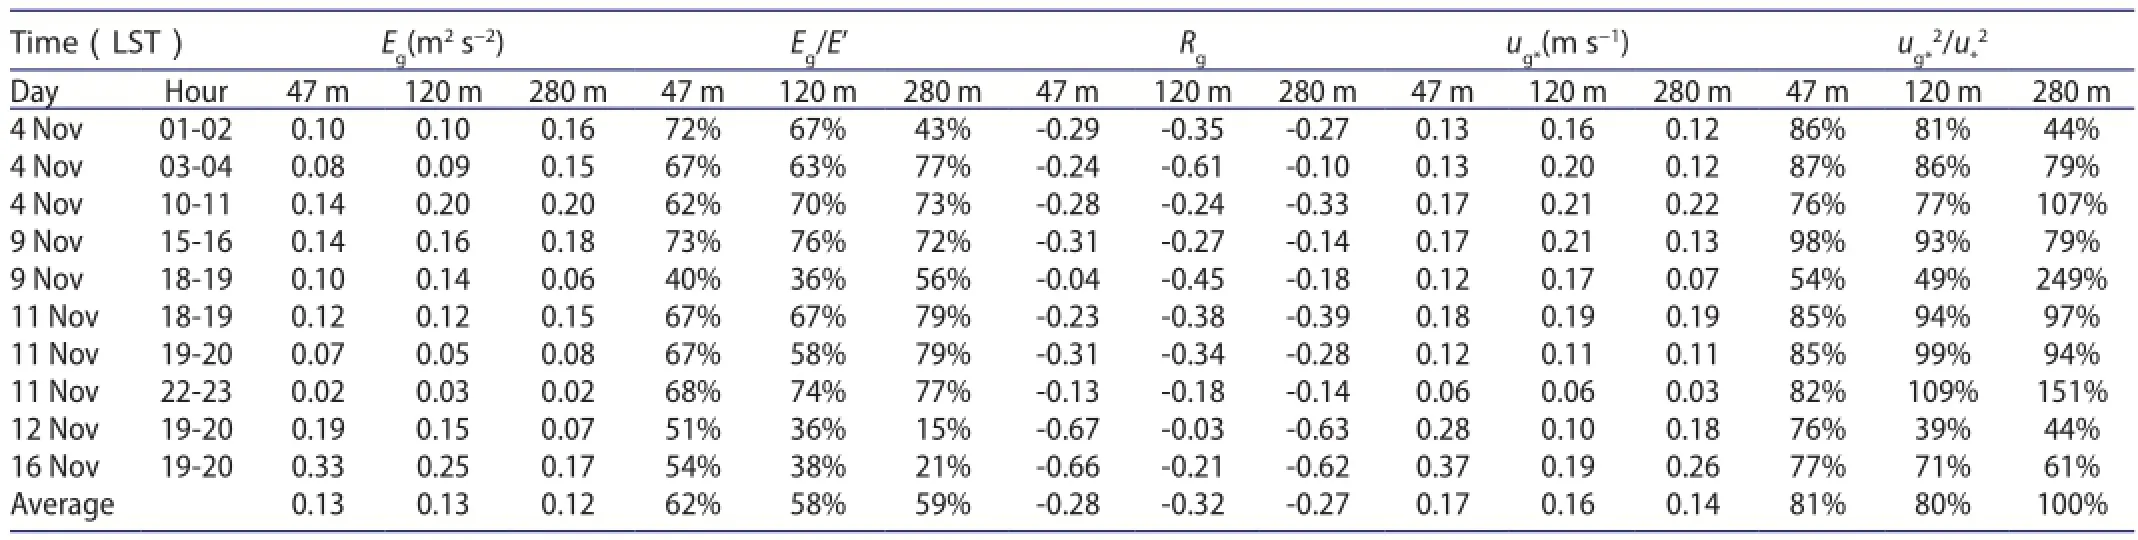
Table 1.Correlation coefficients,Rg, between the two components of gusty disturbances, (ug, wg), and some basic quantity at three heights in November 2003.
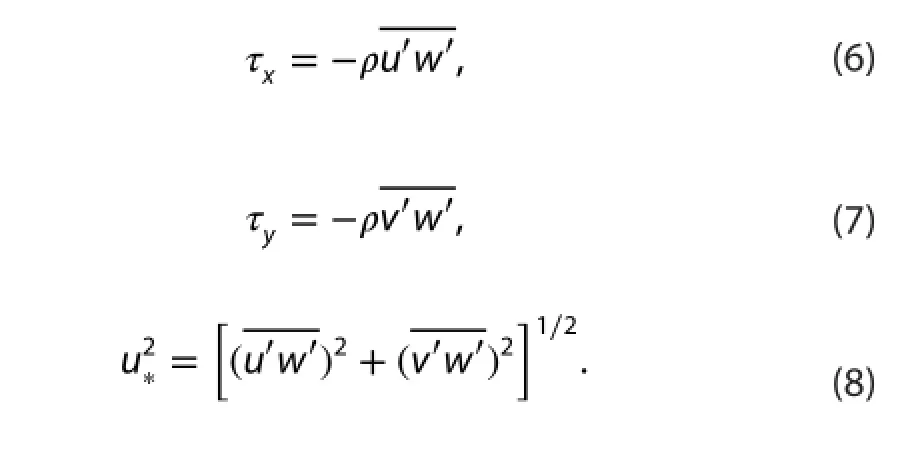
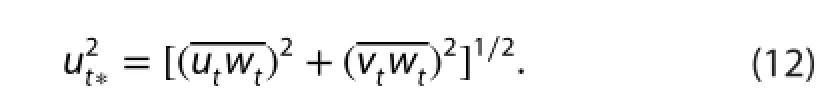
The vertical kinematic eddy flux of horizontal momentum(τx, τy) is Here ρ is the air density. The fluxes are decomposed into two parts, corresponding to gusty wind and turbulence with isotropic motion. So, we have:Program of China (2010CB951804), and the Research Program of the Chinese Academy of Sciences (XDA10010403).
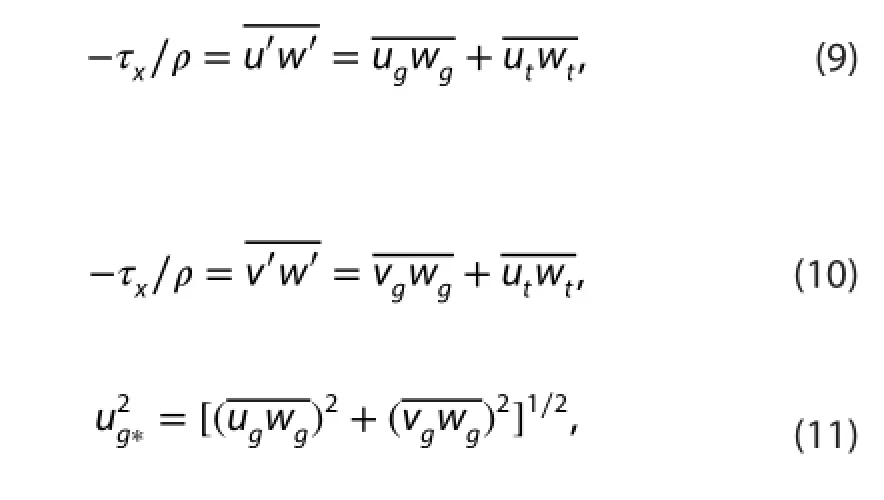
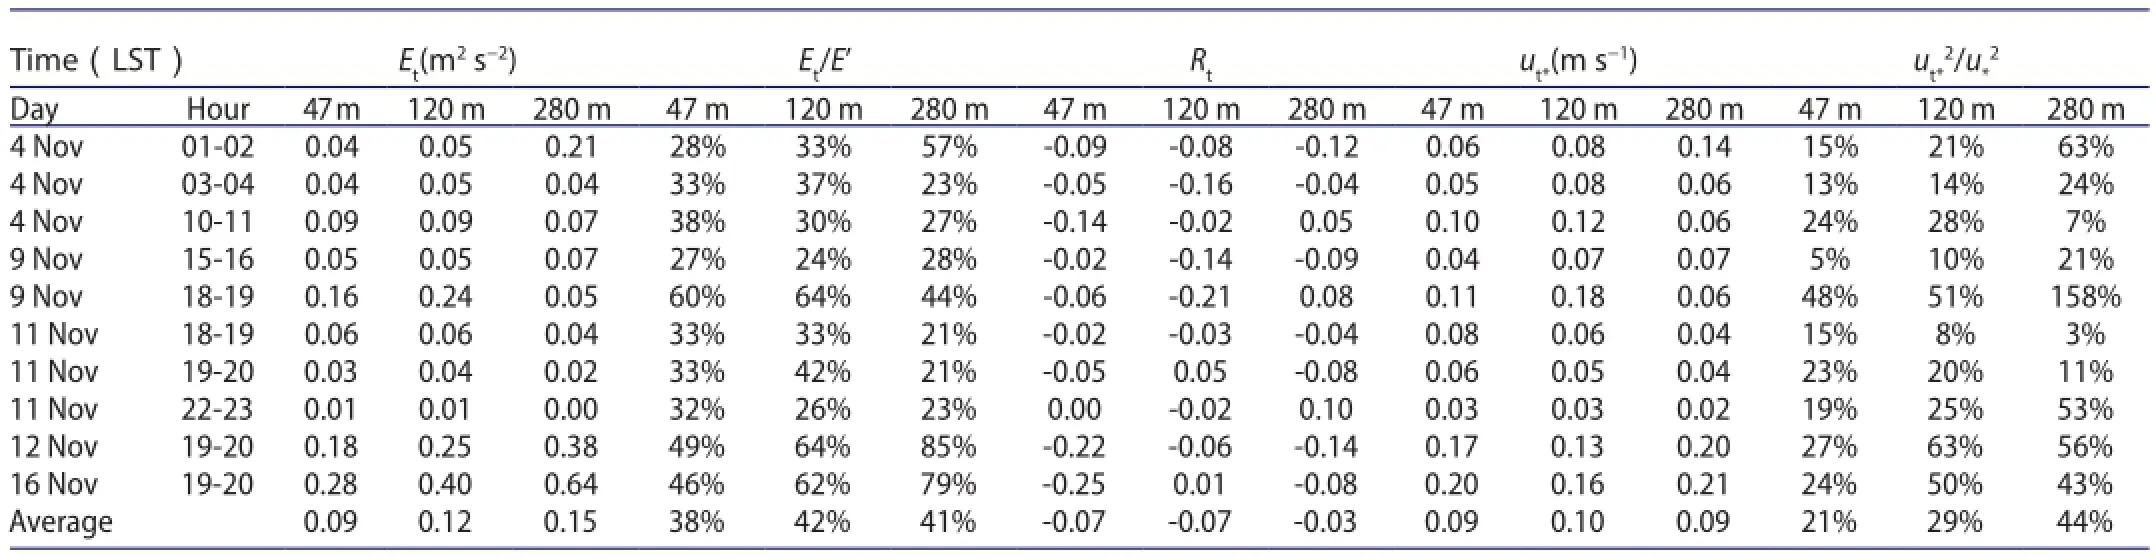
Table 2.Correlation coefficients,Rt, between the two components of turbulent fluctuations, (ut, wt) , and some basic quantity at three heights in November 2003.
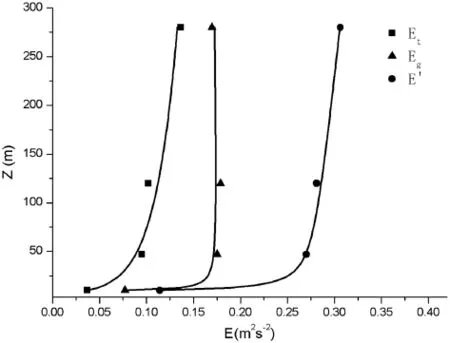
Figure 5.The vertical profile ofE, E, andE′.tg
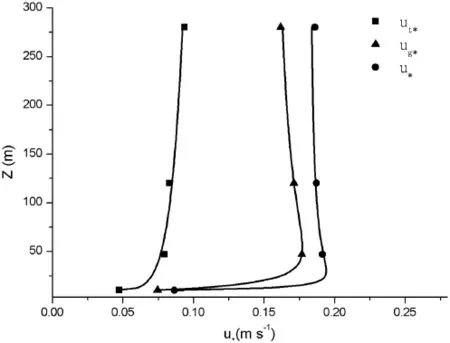
Figure 6.The vertical profile of ut*, ug*, andu∗.
Andug*is the friction velocities relate to gusty wind,ut*is the friction velocities relate to turbulence. The vertical profiles ofug*and ut*are given in Fig. 6, respectively.ug*and ut*are the average for 120 h.
It can be seen that 1)ug*is approximately constant with height between 47 m and 280 m. Hence, the downward momentum flux relate to gusty wind are approximately constant with height under weak wind; 2)ut*is approximately constant with height also; 3) The downward momentum flux is approximately constant with height in the surface layer under weak wind; 4)ug*are larger than ut*at every height. Our calculations showaccounted for 85% at 47 m height, 84% at 120 m height, and 73% at 280 m height of. Hence, the gusty wind contributes about 80% downward flux of momentum under weak wind.
5. Conclusion
Through analyses of multilevel ultrasonic anemometerthermometer monitoring data during the weak winds period,it is revealed:
(1) Superimposed on the basic air flow, there are gusty wind wave packets with a period between 1 min and 10 min.
(2) Even during the weak winds period, the gusty wind is characterized by a coherent structure, and the corresponding vertical velocity is downward when horizontal velocity is in the peak phase, but upward when horizontal velocity is in the valley phase. It is the same during the strong winds period, but it is more regular during the strong winds period.
(3) There are pronounced differences between gusty wind disturbances and turbulent fluctuations, the gusty wind disturbances are always anisotropic with moderate coherency, while the turbulent fluctuations are isotropic and nearly random.
(4) The gusty wind disturbances (periods in the range[1 min, 10 min]) carry most of the eddy kinetic energy and play a major role in downward momentum flux. Turbulent fluctuations (period < 1 min) only contribute a few of these.
(5) The kinetic energies of turbulent fluctuations grow with height under 280 meters. The friction velocities relate to turbulence fluctuations and gusty wind disturbances are approximately constant with height between 47 and 280 meters.
Acknowledgements
This work was supported by the National Natural Science Foundation of China (40830103 and 41375018), the National Basic Research
References
Agustsson, H., and H. Olafsson. 2009. “Forecasting wind gusts in complex terrain.” Meteorology and Atmospheric Physics 103: 173-185.
Boettcher, F., C. Renner, H. P. Waldl, and J. Peinke. 2003. “On the statistics of wind gusts.” Boundary-Layer Meteorology 108: 163-173.
Brasseur, O. 2001. “Development and application of a physical approach to estimating wind gusts.” Monthly Weather Review 129: 5-25.
Cheng, X. L., Q. C. Zeng, F. Hu, and Z. Peng. 2007. “Gustness and coherent structure of strong wind in the atmospheric boundary layer.” Climatic and Environmental Research (in Chinese) 12: 227-243.
Cheng, X. L., Q. C. Zeng, and F. Hu. 2011. “Characteristics of gusty wind disturbances and turbulent fluctuations in windy atmospheric boundary layer behind cold fronts.” Journal of Geophysical Research 116: D06101. doi: 10.1029/2010JD015081.
Cheng, X. L., F. Hu, and Q. C. Zeng. 2012. “Simulation of wind gust structure in the atmospheric boundary layer with Lattice Boltzmann Method.” Chinese Science Bulletin 57: 1196-1203.
Cheng, X. L., L. Wu, F. Hu, and Q. C. Zeng. 2012. “Parameterizations of some important characteristics of turbulent fluctuations and gusty wind disturbances in the atmospheric boundary layer.” Journal of Geophysical Research 117: D08113. doi:10.1029/2011JD017191.
Goyette, S., O. Brasseur, and M. Beniston. 2003. “Application of a new wind gust parameterization: Multiscale case studies performed with the Canadian regional climate model.” Journal of Geophysical Research 108: 4374. doi:10.1029/2002JD002646.
Guo, Y. Q., R. M. Yuan, T. Luo, J. N. Sun, and W. W. Jiang. 2012. “Research on relationships between high-speed coherent structure and turbulence flux.” Chinese Journal of Atmospheric Sciences (in Chinese) 36: 733-743.
Jungo, P., S. Goyette, and M. Beniston. 2002. “Daily wind gust speed probabilities over Switzerland according to three types of synoptic circulation.” International Journal of Climatology 22: 485-499.
Paulsen, B. M., and J. L. Schroeder. 2005. “An examination of tropical and extratropical gust factors and the associated wind speed histograms.” Journal of Applied Meteorology 44: 270-280.
Peinke, J., S. Barth, F. Bottcher, D. Heinemann, and B. Lange. 2004.“Turbulence, a challenging problem for wind energy.” Physica A 338: 187-193.
Thorarinsdottir, T. L., and M. S. Johnson. 2012. “Probabilistic wind gust forecasting using nonhomogeneous Gaussian regression.”Monthly Weather Review 140: 889-897.
WMO (World Meteorological Organization). 2008. Guide to Meteorological Instruments and Methods of Observation. 7th ed. Chapter 5, Part I. WMO.
Zeng, Q. C., F. Hu, and X. L. Cheng. 2007. “The mechanism of dust entrainment by gustwind.” Climatic and Environmental Research(in Chinese) 12: 251-255.
Zeng, Q. C., X. L. Cheng, F. Hu, and Z. Peng. 2010. “Gustiness and coherent structure of strong winds and their role in dust emission and entrainment.” Advance in Atmospheric Science 27: 1-13.
Zhu, P. 2008. “A multiple scale modeling system for coastal hurricane wind damage mitigation.” Natural Hazards 47: 577-591.
29 May 2015 Accepted 13 July 2015
CONTACT Cheng Xue-Ling chengxl@mail.iap.ac.cn
© 2015 The Author(s). Published by Taylor & Francis.
This is an Open Access article distributed under the terms of the Creative Commons Attribution License (http://creativecommons.org/licenses/by/4.0) which permits unrestricted use, distribution,and reproduction in any medium, provided the original work is properly cited.
杂志排行

Atmospheric and Oceanic Science Letters的其它文章
- Study on the dependence of the two-dimensional Ikeda model on the parameter
- Aerosol absorption optical depth of fine-mode mineral dust in eastern China
- Characteristics of air quality in Tianjin during the Spring Festival period of 2015
- Change of Arctic sea-ice volume and its relationship with sea-ice extent in CMIP5 simulations
- Calculation of stratosphere-troposphere exchange in East Asia cut-off lows: cases from the Lagrangian perspective
- Evaluation of the individual allocation scheme and its impacts in a dynamic global vegetation model