Flow hydrodynamics in embankment breach*
2015-12-01ZHAOGenshengVISSERPaulRENYankaiUIJTTEWAALWimDepartmentofHydraulicEngineeringDelftUniversityofTechnology2628CNDelftTheNetherlands2FlandersHydraulicsResearchFlemishGovernmentDepartmentofMobilityandPublicWorksBerchemlei240Ant
ZHAO Gensheng, VISSER Paul J., REN Yankai, UIJTTEWAAL Wim S. J.. Department of Hydraulic Engineering, Delft University of Technology, 2628CN, Delft, The Netherlands2. Flanders Hydraulics Research, Flemish Government Department of Mobility and Public Works,Berchemlei 5, B-240, Antwerp, Belgium, E-mail: g.zhao@tudelft.nl
Flow hydrodynamics in embankment breach*
ZHAO Gensheng1,2, VISSER Paul J.1, REN Yankai1, UIJTTEWAAL Wim S. J.1
1. Department of Hydraulic Engineering, Delft University of Technology, 2628CN, Delft, The Netherlands
2. Flanders Hydraulics Research, Flemish Government Department of Mobility and Public Works,Berchemlei 115, B-2140, Antwerp, Belgium, E-mail: g.zhao@tudelft.nl
(Received January 21, 2015, Revised August 26, 2015)
Breaching flow occurs during the breach development of the embankment, dike, earthen dam, landslide barrier, etc. and plays an import role in the breaching erosion as the driving force. According to the previous research, the breaching process can be classified into initiation phase, breach widening phase and breach deepening phase. Based on the breaching development classifications, the breaching flow can be seen as a special compound weir flow when the breach channel is in the relatively equilibrium condition. There were five physical flow models were designed in the hypothesis of rectangular shape and trapezoidal shape for the breach channel cross sections to study the breaching flow characteristics. The distributions of water level and velocity were measured and analysed in the breaching flows in overtopping condition and emerged condition. There were two helicoidal flows above the breach channel slopes and triangular hydraulic jump in the downstream of the breach channel in the overtopping condition and emerged condition. The hydraulic energy loss was calculated according to the breaching velocity and water level distribution in the upstream and downstream of the model. It is found that the test results of the breach flow physical model can be valuable to bring insight of the breaching process of embankment and make contributions to the validations and verifications of breach numerical models.
embankment breach, physical model, breaching flow, helicoidal flow, hydraulic jump
Introduction0F
Former researchers investigated the breaching process of embankment dams using physical model,numerical model and prototype analysis[1-8]. A lot of numerical models have been developed on the basis of the former research, most of which are based on the empirical analysis and hypotheses[1-4]. The data are rare for the prototype of dam-breach and they are usually very rough. In the laboratorial scale, the researchers usually focused on the development of the breach and ignored and/ or had some difficulties to measure the hydraulic characteristics of the breach. What is more, the numerical models need to be validated and calibrated with the measurement data, especially for the breach hydraulic model.
In the beginning of the breach, the flow usually overtops the embankment crest and starts to erode the crest surface, which is called the breach initiation. The breaching flow passes the breach initiation channel and the rest of the crest is in the initial phase of the breach. The breaching flow develops in the overtopping and/or submerged condition. It can be seen as the submerged weir flow in this phase. As the breach channel develops wider and deeper due to the erosion, the upstream water level decreases and the flow goes only in the breach channel. The breaching flow starts to develop in the emerged condition. Generally the breaching flow develops from overtopping condition in the initiation phase into emerged condition when the breach channel is enlarged due to the erosion. The overtopping condition and emerged condition can be transferred since there is a hydraulic boundary change in the upstream. The breaching flow would transfer from emerged condition into overtopping condition if there is an additional discharge into the upstream.
In the model of Visser[1], a relatively small initial breach is assumed in the top of the dike that is so large that water flows through it starting the breach erosion process. By assuming a trapezoidal shape of initialbreach with the angle of repose, he distinguished the process of breach erosion for sand-dike into five stages (Fig.1):
(1) Steepening of the inner slope from initial value.
(2) Yielding a decrease of the width of the crest of the dike in the breach.
(3) Lowering of the top of the dike in the breach,with constant angle of the critical breach side slopes,resulting in an increase of width of the breach.
(4) Critical flow stage, in which flow is virtually critical throughout the breach and the breach continues to grow mainly laterally.
(5) Subcritical stage, in which the breach continue to grow, mainly laterally due to the subcritical flow in the breach.

Fig.1 Schematic illustration of breach growth in a sand dike[1]
In the first three stages the initial breach cuts itself into the dike and most discharge through the breach happens at stage 4 and 5.
In the process of breach, the discharge varies with different upstream water level as well as the different breach shape. The converged flow goes into the breach channel from the upstream. In the area of breach channel, there is not only critical flow but also shock wave that propagates downstream of the breach(Fig.2(a)). Eddy zones are also generated due to the non-uniform distribution of the breaching flow. The breaching flow can be seen as a type of weir flow in the breach channel. It starts as subcritical flow in the upstream, then becomes critical flow and later supercritical flow, finally changes back into subcritical flow after the hydraulic jumps when it passes through the breach (Fig.2(b)).
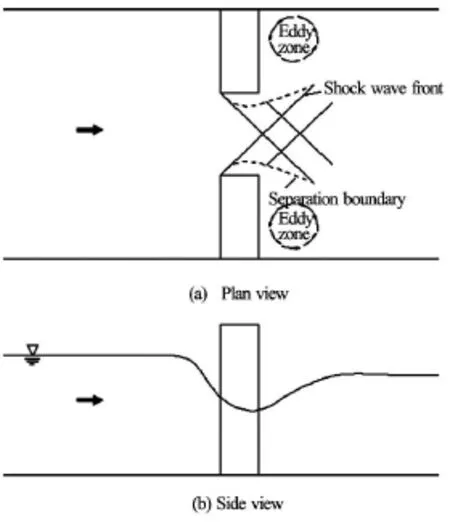
Fig.2 Flow characteristics in the breach
Generally the breaching flow is a kind of compound weir flow due to the constraints from the breach channel and the embankment. The breach crosssection shape is usually idealized as rectangular or trapezoidal, but it depends on the embankment materials as well as the hydraulic condition during the embankment breach. According to the shape of cross-section,the compound weir can be simplified into rectangular compound weir and trapezoidal compound weir. The submerged compound weir flow is called when the flow goes fully over the weir including the breach and the rest crest. The emerged compound weir flow occurs when the flow just goes through the breach.
In the paper, a series of experiments were conducted in the flume to simulate the hydraulic characteristics of breaching flow in the overtopping and emerged conditions. The breach process was simplified into five phrases according to the physical process of breach in the laboratorial experiments, field measurement and prototype investigations. The transversal water level distribution, depth-averaged velocity as well as the hydraulic energy loss was analyzed according to the test results.
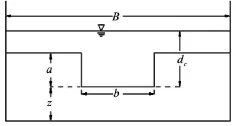
Fig.3 Sketch of broad-crested weir with rectangular compound-section in overtopping condition
1. Hydraulic parameters of breaching flow
1.1 Overtopping compound weir flow
In overtopping condition, the breaching flow goes through the rectangular compound cross section(Fig.3), the discharge can be expressed as a function of upstream water depth[9]
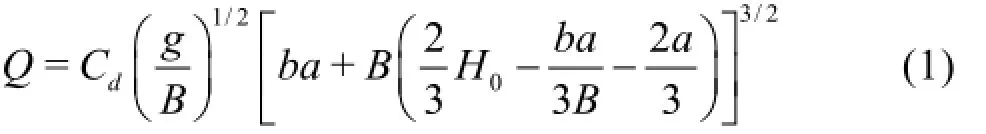
where Cdis the discharge coefficient,Bis the width of weir anda is the breach depth,H0is the energy height over crest. In the equation, the control section is considered as combination of two rectangular sections over the weir crest and the breach part.
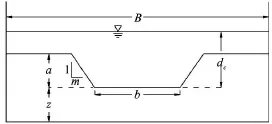
Fig.4 Sketch of broad-crested weir with trapezoidal compoundsection in overtopping condition
When the breach channel is of a trapezoidal shape (Fig.4), the discharge can be calculated as
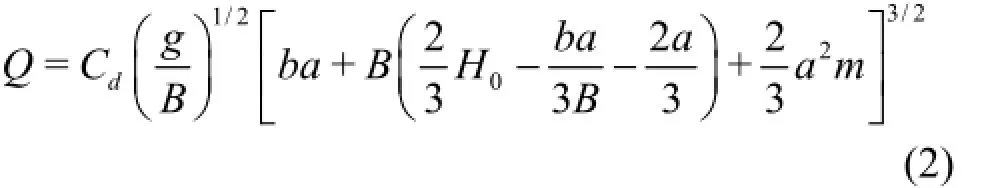
where Cdcis the discharge coefficient over the crest, Cdbis the discharge coefficient in the breach,H0cis the energy head above the weir crest,H0bis the energy head above the breach bottom. The first part on the right hand side of the formula represents the discharge over the crest and the second part represents the discharge through the breach.
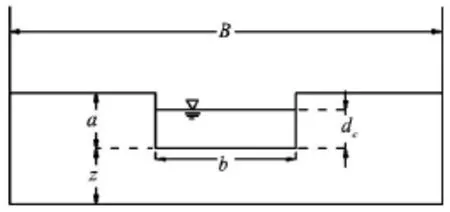
Fig.5 Sketch of broad-crested weir with rectangular compoundsection in emerged condition
1.2 Emerged compound weir flow
Emerged flow condition refers to the flow only passing through the breach. In order to compensate for actual flow conditions such as energy losses, non-uniformity of velocity distribution, and streamline curvature in reality, a discharge coefficient,Cd, is introduced to the weir flow formula.
According to the relationships between weir discharge and upstream water depth in the emerged condition (Fig.5), the discharge through the rectangular compound weir can be expressed as
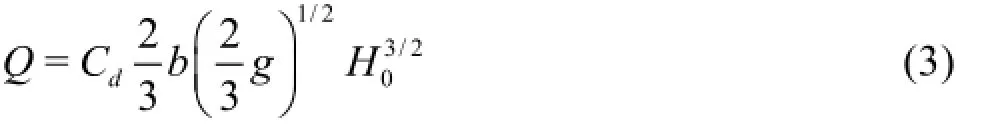
where Cdis the weir discharge parameter,bis the width of the lower weir crest,H0is the upstream energy head above the weir.
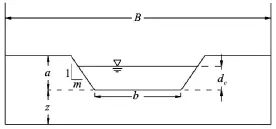
Fig.6 Sketch of broad-crested weir with trapezoidal compoundsection in emerged condition
Bos[10]studied the flow over broad-crested weirs with trapezoidal control section (Fig.6) and the discharge formula in emerged flow condition can be written as

wherem is the side slope,bis the width of breach bottom,dcis the water depth above the weir, and approximately equals 2/3H0in the critical weir flow condition (Visser 1998).
2. Experiments of breaching flow
2.1 Experiment setup
The embankment model was built with crest length Lw=0.18 m, height P =0.13mand slope of 1V:3Hin both upstream and downstream with the breach located in the middle of the weir crest (see Fig.7).
The breach shape does not have a regular pattern during the embankment breaching process in prototype, however, it is usually similar to rectangular or trapezoidal shapes. In this study, the breach cross sections were idealized into rectangular shape in the beginning phase of breach, and trapezoidal shapes in the other phases. According to Visser[1], five cases with different cross sections were designed (Fig.8).
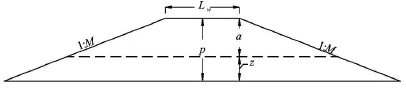
Fig.7 Side view of designed weir
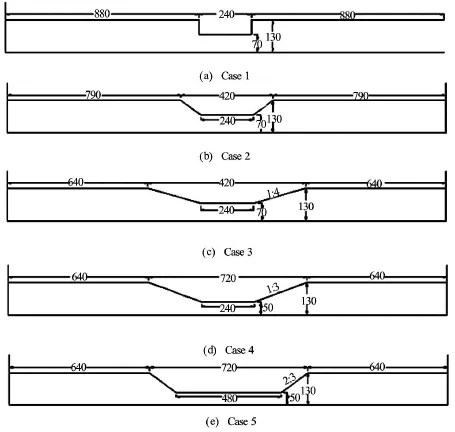
Fig.8 Sketches of the breach cross-sections
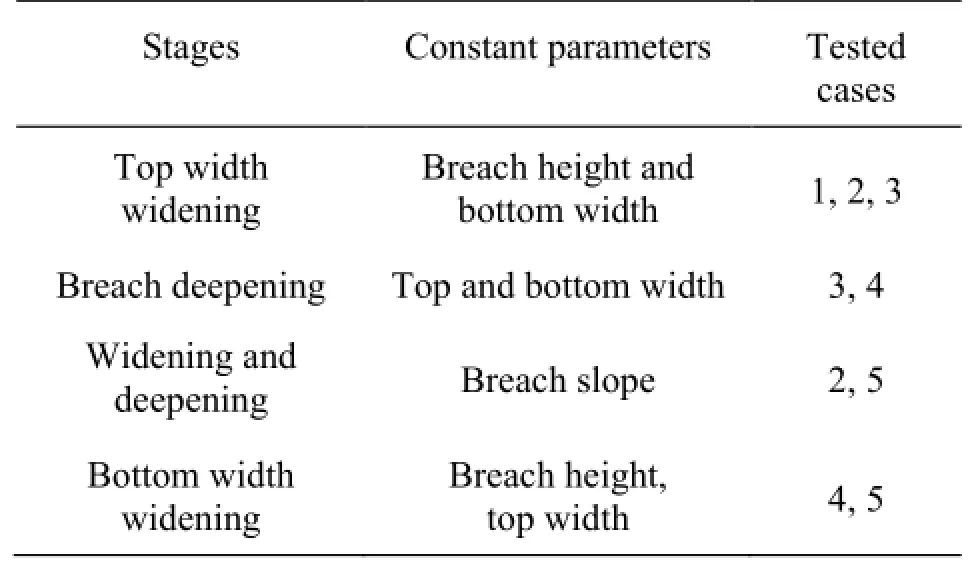
Table 1 Breaching stages in the test
In order to simulate the breaching process, the model was designed into 5 stages (Table 1) to express the deepening and widening process of breach (Fig.9)in the embankment breach development.
The experiment was conducted in a flume with the dimension of 2 m×20 m (see Fig.10). The slope's influence was not considered in the breach experiment. Therefore the slope is 0 in the flume. The width is large enough to decrease the effects from the side wall. The bottom is stick by gravels with diameter from 0.005 m to 0.006 m to increase the bottom roughness.
2.2 Hydraulic boundary conditions
The embankment breach was modeled by a weir with a fixed profile and lateral contraction in a laboratory flume. The experiment was expected to fulfill the objective of getting insight into the characteristics and behaviors of breach flow over broad-crested weir with breach of various geometries. In order to achieve this,some tests were conducted by varying the breach geometry. The experiment was carried out in the Fluid Mechanics Laboratory of Delft University of Technology.
There were five cases for the breach process in the experiment. The upstream boundary for each case of breach is controlled by the discharge which has the different upstream water level shown in Fig.11. Each breach has its own relationship between discharge and water level. As the upstream water level increases, the breach discharge increases. With the development of breach, the discharge increase step by step at the sameupstream water level. As for the downstream boundary, the water lever was controlled by the tailgate with water level gauge.
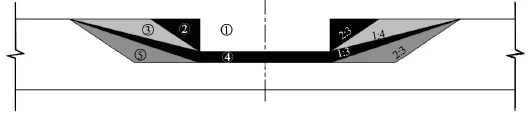
Fig.9 Sketches of the breach widening and deepening process
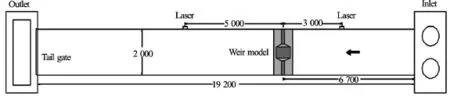
Fig.10 Layout of the flume
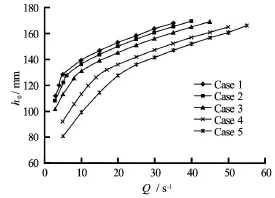
Fig.11 Hydraulic boundary conditions for each breach case
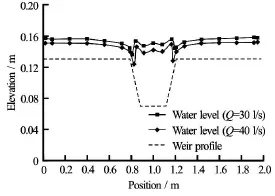
Fig.12 Water level in overtopping condition (Case 2)
3. Analysis of experiment results
3.1 Water level distribution
In the overtopping condition, the water level keeps almost constant, but it drops above the breach slopes and increases into normal level in the middle of the breach (Case 2, Fig.12). The water level above the breach slope is lower than those in the breach and on the dam crest, since there is much turbulence along the boundary of breach, and the helicoidal flow occurs above the breach slopes. In the same boundary conditions, the total water level increases by 0.01 m if the upstream discharge increases from 30 l/s to 40 l/s.
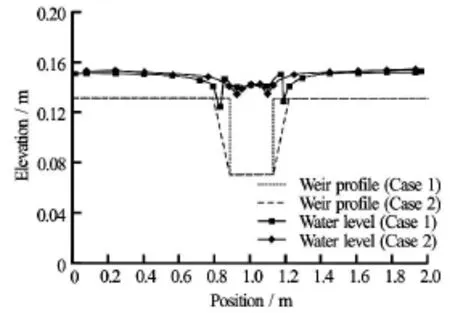
Fig.13 Water level in overtopping condition (Q=30l/s)
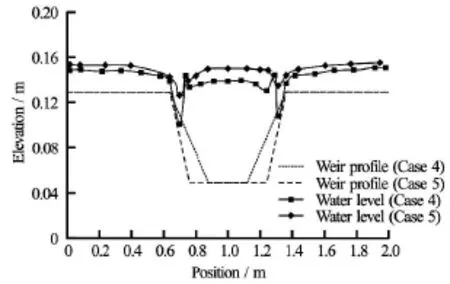
Fig.14 Water level in overtopping condition (Q=50l/s)
As the breach develops, the breach shapes change to adjust the breach flow. In overtopping condition, two water level valleys move as the breach widens to the breach sides (see Fig.13 and Fig.14). The water level valleys above the breach slopes drop to the breach slopes as they move toward the sides. And the water level in the middle of the breach also drops down as the breach widens towards two sides. The patterns that the water level moves are almost the same even there are changes from rectangular to trapezoid and from trapezoid to trapezoid. But the two water level valleys drop more drastically in the change from trapezoid to trapezoid than that from rectangular to trapezoid.
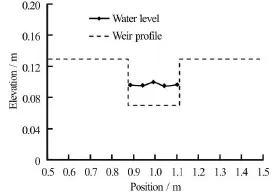
Fig.15 Water level in emerged condition (Q =4l/s, Case 1)
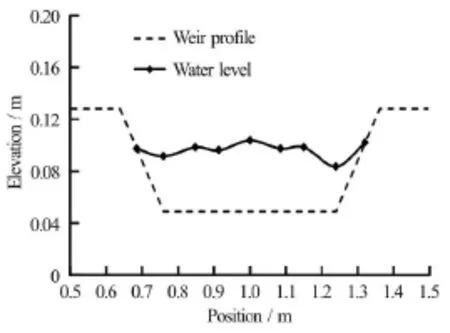
Fig.16 Water level in emerged condition (Q=20l/s, Case 5)
In the emerged condition, the lateral distribution of the water level is almost constant in the breach channel of rectangular cross section (Fig.15), but the water level reduces above the breach slope (Fig.16). The water level has a peak point in the middle of the cross section and two valleys above the breach slopes,especially in the condition of trapezoid breach shapes.
3.2 Breach discharge distribution
Particularly in overtopping condition, it is of great interest to investigate how much water passes through the breach or over the crest. This is important to simulate the breaching process and estimate the discharge contributing to the breaching.

Fig.17 Comparison of theory predictions and laboratory measurements on discharge distribution
The predicted discharge distribution by Eq.(2)and test results and are plotted in Fig.17. The analytical prediction for Cases 1 and 5 is slightly underestimated compared with the experiment data and overestimated for Case 3 at low discharges. As for the other cases, the theory and laboratory results fit well. Overall, it can be concluded that the laboratory results for the five cases are in good agreement with the theoretic predictions. Based on the results of theory and experiment, it can be found that the breach conveys less compared to the total discharge with the increase of discharge for each case. It is reasonable that for high stage water the effect of breach is reduced and at the same discharge, the larger the breach size is, the more water flows through the breach.
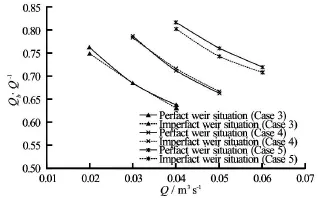
Fig.18 Discharge distribution in the case of subcritical flow in the breach and critical flow over the crest
During the experiment, it can be found that the flow in the breach would become subcritical first and then the flow over the crest if gradually raising the tail gate from low level. Hence, there is a situation that at the same time. The discharge distribution in the situation is illustrated in Fig.18. The differences on the discharge distribution are small between perfect weir and imperfect weir situations in Cases 3 and 4, which indicate the influence of breach is small over the distribution. But in Case 5 which owns larger size of breach,the difference is evident. Therefore the discharge distribution is dependent on the stages of breach in the situation of subcritical flow in the breach and critical flow over the crest.
3.3 Velocity distribution
In the breaching process, the velocity plays an important role in the erosion and scour of the embankment, the widening and deepening process of breach,and the flood propagation process in the downstream,etc..
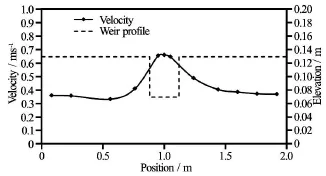
Fig.19 Depth-averaged velocity distribution in breach cross section (Q =30l/s, Case 1)
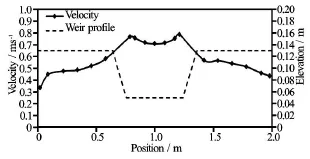
Fig.20 Depth-averaged velocity distribution in breach cross section (Q =50l/s, Case 5)
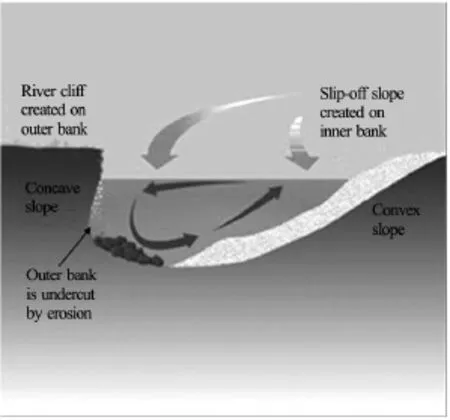
Fig.21 Helicoidal flow in meandering channel
In the overtopping condition of Case 1, the breaching flow goes both in the breach channel and the embankment crest, and the flow velocity in the breach channel is higher than that over the crest (Fig.19)). In Case 5 the velocity in the breach is much higher than the crest and reaches its maximum value close to the side slope (Fig.20). There are two velocity peaks just above the breach slope due to the helicoidal flow turbulence on the breach. The turbulence on the breach is triggered by the helicoidal flow. The turbulence is generated by the resistance from the breach channel bed. Between the two velocity peaks, the velocity reduces step by step, and reaches the minimum velocity in the middle of the breach. In the breach channel, the velocity above the breach slope is higher than that in the middle of the channel.
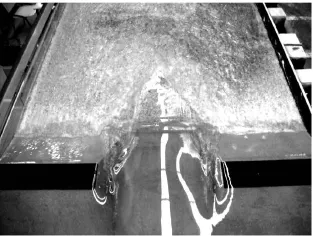
Fig.22 Breaching flow pattern in overtopping condition (Q= 50l/s , Case 5)
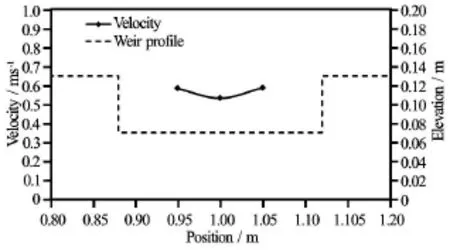
Fig.23 Depth-averaged velocity distribution in breach cross section (Q =4l/s, Case 1)
In the meandering channel of river, there is a type of helicoidal flow, which moves as the corkscrew in a meandering flow (Fig.21). It is a contributing factor to the formation of slip-off slopes and river cliffs in a meandering section of river. The helicoidal motion of the flow aids the processes of hydraulic action and corrosion on the outside of the meander, and sweeps sediment across the floor of the meander towards its inside. The breach flow structure (Fig.22) is similar to the helicoidal flow in the fluvial channels,and it can be called breach helicoidal flow in the brea-ching process. Additionally there is a triangular hydraulic jump at the toe of the breach, which is generated by the constrictions of the breach when the flow in the breach transition from subcritical to supercritical.
In the emerged condition, the flow only passes through the breach. In Fig.23, the flow close to the side is a bit faster than the middle in the low discharge condition. Nevertheless, by increasing the discharge to the overtopping condition (Fig.19), it can be seen that the velocity in the breach is much larger than the crest and the flow also speeds up in the near field of breach. After further increase of the incoming flow (Fig.19),the maximum velocity in the breach does not change too much. However, the flow velocity over the crest increases largely. Hence, the difference of velocity magnitude between the breach and crest is smaller compared to that with the lower discharge.
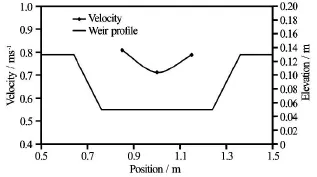
Fig.24 Depth-averaged velocity distribution in breach cross section (Q =20l/s, Case 5)
The transverse velocity of the breaching flow also plays an important role in the erosion of breach. Figure 24 shows the transverse velocity distribution in vertical direction of breach channel. From the surface of the breaching flow to the bottom, the transverse velocity increases and the velocity reaches the largest value at the bottom of the breach channel. The transverse breaching flow stimulates the helicoidal flow in lateral direction.
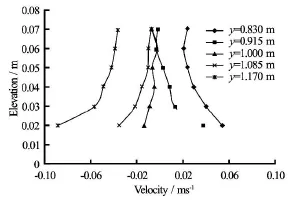
Fig.25 Transverse flow velocity in breach channel (Q= 20l/s , Case 5)
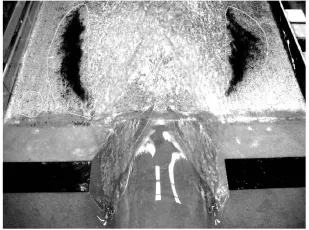
Fig.26 Breaching flow pattern in emerged condition (Q= 20l/s , Case 5)
The breaching flow goes in the trapezoidal cross section (Fig.25) when the flow is in the emerged condition. The minimum depth-averaged velocity is in the middle of the cross section. The helicoidal flow happened in the breach channel in the emerged condition(Fig.26). There is a triangular hydraulic jump at the toe of the breach, which is generated by the constrictions of the breach when the flow in the breach transits from subcritical flow to supercritical flow. The eddies occurred in the downstream of the breach channel close to both sides of the channel bank downstream of the breach.
3.4 Breach energy loss
In imperfect situation, the upstream flow conditions have a significant influence on energy head loss for given downstream water levels. According to the energy conservation in the upstream and momentum balance in the downstream, it can be found that the energy loss can be expressed as a function of downstream water depth in imperfect weir situation.

Fig.27 Energy head loss versus upstream discharge at given tail heights
By applying a high tail gate for each case and gradually increasing the upstream discharge, the energy head loss against the upstream discharge is shown in Fig.27. It can be seen from the plot that the energy head loss increases with the raise of discharge and there can be observed an obvious break in slope for each curve. It is due to the discontinuity caused by the sudden change of flow control section when the flow starts overtopping. According to the curves, the discontinuity occurs one after the other from Cases 1 to 5,which depends on the size of breach. It is also worth mentioning that the energy loss increases linearly with the increase of discharge but at different rates before and after the overtopping. In emerged condition, the curve rate tends to decrease during the process of enlargement. However, the rate drops significantly after overtopping and the curves seem to be parallel to each other. Therefore, one can draw conclusions that the rate of energy loss would keep constant after overtopping.

Fig.28 Energy head loss versus downstream water depth
As stated above, the energy head loss can be expressed as a function of downstream water depth in highly submerged condition. In Fig.28, the relation between them is presented. And the curves are discontinuous due to the weir geometry and the transition zone can be clearly seen. In both the emerged and overtopping conditions, Case 2 may have more energy loss than Case 1 at the same downstream water depth,which indicates the top widening from rectangular to trapezoidal breach shape results in higher loss. It is the same case among Cases 2, 3 and 4. Therefore, the process of top widening and height deepening of breach dissipate more energy. Nevertheless, at the same downstream flow condition, the energy loss drops largely in Case 5 after widening the breach bottom from Case 4.
3.5 Discharge coefficient
As the discharge equations for emerged and overtopping flows are both derived from continuity equation and energy conservation, the corresponding discharge coefficients based on them are comparable. The discharge coefficient from emerged condition to overtopping condition regarding the upstream energy head is plotted in Fig.29.
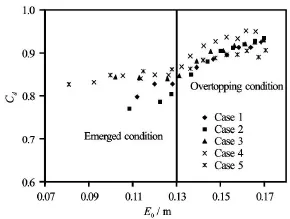
Fig.29 Discharge coefficient from emerged condition to overtopping condition
The discharge coefficients increase with the rising of the upstream energy head. In merged flow, the values of Cases 1 and 2 have a relatively large increasing rate than the other three in which the changes are small. After overtopping, the discharge coefficients are more close to each other, and increase at a decreasing rate and finally reach more or less constant values. The values for emerged flow are more scattered due to the complex of three-dimensional characteristics of the flow there. However, the influence of breach reduces in the overtopping condition.
The effect caused by breach is different between the emerged flow and overtopping flow. For instance,the discharge coefficient for Case 5 is highest in emerged flow and lowest in overtopping flow. Moreover,the difference is the smallest in the two flow conditions compared to others. It is caused by the fact that the large size of breach is dominant in breach flow. Therefore, it is reasonable to see that the values for the small-sized trapezoidal shape of breach, e.g., Case 2,are of great difference under the two flow conditions.
4. Conclusions
The breaching flow plays an important role in the embankment breaching process coupled with hydraulic process and sediment transport process[11-15]. During the breaching process, the flow overtops the whole of embankment crest and generates the breach channel in the initial phase of breach development[3,7]. As the breach develops, the breaching flow only goes through the breach channel due to the decrease of the upstream water level. So the breaching flow can be classified as overtopping compound weir flow and emerged compound flow, which have their own special characteristics. There are two helicoidal flowsabove two breach slopes and a triangular hydraulic jump at the toe of the breach. The helicoidal flow is generated by the roughness of the breach and the constriction from the breach boundary, which triggers water level drops and velocity jumps above the breach slopes. And the velocity distributions and water level distribution are changed by the breach hydraulic boundary. The helicoidal flow accelerates the sediment undermining at the toe of the breach slopes and widens the breach in the lateral direction of the embankment. The triangular hydraulic jump happens when the breach flow change from subcritical flow into super critical flow, with a triangular critical area at the toe of the breach. The triangular hydraulic jump works as a driving force to the head cut erosion in the breach process and scour hole development at the toe of embankment. According to the hydraulic energy loss in the breach, the discharge coefficients are analyzed from emerged condition to overtopping condition, which can be very useful in the calculation of breach discharge in the breach model.
[1] VISSER P. J. Breach growth in sand-dikes[D]. Doctoral Thesis, Delft, The Netherlands: Delft University of Technology, 1998.
[2] ZHU Y. H., VISSER P. J. and VRIJLING J. K. Review on embankment dam breach modeling, new developments in dam engineering[M]. London, UK:Taylor and Gracis Group, 2004.
[3] ZHAO G., VISSER P. J. and PEETERS P. et al. Headcut migration prediction of the cohesive embankment breach[J]. Engineering Geology, 2013, 164(18): 18-25.
[4] ZHAO G., REN Y. and VISSER P. J. et al. Hydraulics of dam breaching flow[C]. Proceedings of 24th ICOLD Congress. Kyoto, Japan, 2012.
[5] ZHAO G., VISSER P. J. and VRIJLING J. K. Breach growth of cohesive embanks[C]. 3rd International Workshop on River and Reservoir Hydrodynamics and Morphodynamics. Lisbon, Portugal, 2012.
[6] ZHAO G., VISSER P. J. and PEETERS P. Large scale embankment breach experiments in flume[R]. Report of Delft University of Technology, Flanders Hydraulics Research and Rijkswaterstaat, 2013.
[7] ZHAO G., VISSER P. J. and PEETERS P. et al. Hydrodynamic erosion of cohesive embankment breach[C]. Proceedings of 7th International Conference on Scour and Erosion. Perth, Australia, 2014.
[8] PEETERS P., ZHAO G. and De VOS L. et al. Largescale dike breaching experiment at lillo in Belgium[C]. Proceedings of 7th International Conference on Scour and Erosion. Perth, Australia, 2014.
[9] GÖGÜS M., DEFNE Z. and ÖZKANDEMIR V. Broadcrested weirs with rectangular compound cross sections[J]. Journal of Irrigation and Drainage Engineering, 2006, 132(3): 272-280.
[10] BOS M. G. Discharge measurement structures[M]. 3rd Edition, Wageningen, The Netherlands: ILRI publication, 1989, 20.
[11] SINGH V. Dam breach modelling technology[M]. Dordrecht, The Netherlands: Kluwer Academic Publishers, 1996.
[12] WAHL T. L. Uncertainty of prediction of embankment dam breach parameters[J]. Journal of Hydraulic Engineering, ASCE, 2004, 130(5): 389-397.
[13] WALDER J. S., O'CONNOR J. E. Methods for predicting peak discharge of floods caused by failure of natural and constructed earthen dams[J]. Water Resources Research, 1997, 33(10): 2337-2348.
[14] WANG P., KAHAWITA R. Modelling the hydraulics and erosion process in breach formation due to overtopping[C]. Proceedings of the Symposium held in Monte Verità. Monte Verità, Switzerland, 2002.
[15] MORRIS M. W. IMPACT: Investigation of extreme flood processes and uncertainty[C]. Proceedings of the 40th Defra Flood and Coastal Management Conference. York, UK, 2005.
杂志排行

水动力学研究与进展 B辑的其它文章
- An effective method to predict oil recovery in high water cut stage*
- Experimental study of breach process of landslide dams by overtopping and its initiation mechanisms*
- Implicit large eddy simulation of unsteady cloud cavitation around a planeconvex hydrofoil*
- Prediction of ship-ship interactions in ports by a non-hydrostatic model*
- The variations of suspended sediment concentration in Yangtze River Estuary*
- Experimental investigation of motion responses of tunnel element immerging by moored barge*