Optimal Scheme Selection of Agricultural Production Structure Adjustment — Based on DEA Model; Punjab (Pakistan)
2015-11-18ZeeshanAhmadMengJunMuhammadAbdullahMazharNadeemIshaqMajidLateefandImranKhan
Zeeshan Ahmad, Meng Jun*, Muhammad Abdullah, Mazhar Nadeem Ishaq, Majid Lateef, and Imran Khan
1College of Economics and Management, Northeast Agricultural University, Harbin 150030, China
2Department of Agriculture Economics and Management, Northeast Forestry University, Harbin 150040, China
3School of Economy and Management, Harbin Institute of Technology, Harbin 150001, China
4Department of Management Science, The Islamia University of Bahawalpur, Pakistan
Optimal Scheme Selection of Agricultural Production Structure Adjustment — Based on DEA Model; Punjab (Pakistan)
Zeeshan Ahmad1, Meng Jun1*, Muhammad Abdullah1, Mazhar Nadeem Ishaq1, Majid Lateef2, and Imran Khan3,4
1College of Economics and Management, Northeast Agricultural University, Harbin 150030, China
2Department of Agriculture Economics and Management, Northeast Forestry University, Harbin 150040, China
3School of Economy and Management, Harbin Institute of Technology, Harbin 150001, China
4Department of Management Science, The Islamia University of Bahawalpur, Pakistan
This paper used the modern evaluation method of DEA (Data Envelopment Analysis) to assess the comparative efficiency and then on the basis of this among multiple schemes chose the optimal scheme of agricultural production structure adjustment. Based on the results of DEA model, we dissected scale advantages of each discretionary scheme or plan. We examined scale advantages of each discretionary scheme, tested profoundly a definitive purpose behind not-DEA efficient, which elucidated the system and methodology to enhance these discretionary plans. At the end, another method had been proposed to rank and select the optimal scheme. The research was important to guide the practice if the modification of agricultural production industrial structure was carried on.
agricultural industrial structure adjustment, agricultural production structure, DEA efficient, DMU's ranking, Punjab
Ιntroduction
In the course of research of evaluation of multiple agricultural production structure adjustment schemes of Punjab Province (Pakistan) based on DEA (Data Envelopment Analysis) model and results gained by multi-objectives optimization programming model, four possible schemes have been proposed and then their comparative efficiencies have been also weighed (Zeeshan et al., 2015). On the other hand, it is important to search clearly the definitive reason for not-DEA efficient schemes and simplify the methodology to modify and enhance them. DEA methodology has the benefit of assessment of discretionary schemes, particularly in case of multipleinputs and multiple-outputs (Wu, 2002; Wang, 2000)in addition to this, it also provides some helpful management information which can be practical and applied to enhance not-DEA efficient DMUs(Decision Making Units) (Wei, 2001; Li, 2000; Li,2010).
In this manuscript, we explored the definite causes of ineffective schemes on the basis of DEA model by bringing the concept of redundancy rate of input and deficiency rate of output, later expressed the method to enhance or modify the input and output indexes of relevant scheme so that it could also become a DEA efficient DMU.
In conventional DEA model, it's hard to choosethe optimal scheme amongst DEA efficient DMUs,even if it is a challengeable assignment for decision makers. In this manuscript, new methodology of ranking DMUs had been anticipated to choose the optimal scheme.
DEA Efficiency of Each Optimal Scheme
Every scheme was considered as a DMU in DEA model. As per the outcome of optimizing programming model, four possible schemes had been proposed and their comparative efficiencies had been assessed on the basis of DEA method (evaluation results are shown in Table 1). Using DεC2R model of DEA (Quan,1998; Peihua et al., 2013), we got the evaluating results as given.
Outcomes of DEA models had categorized the four schemes into three ranks: rank 1 involved scheme DMU1and scheme DMU2, both of which were technically and scale efficient; rank 2 was weak DEA efficient scheme DMU4. And the optimal solution of DEA model after assessing the comparative efficiency of scheme DMU4was:

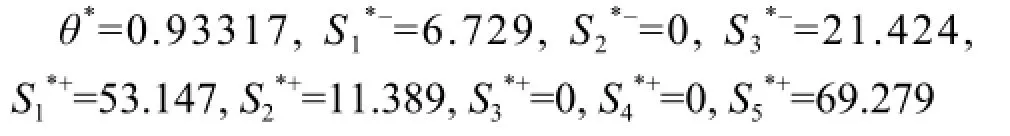
It resulted in weakening DEA efficiency, scheme DMU3was the after everything else hence rank 3. The solutions of resultant DEA model were given as follows:
This implied that it was not-DEA efficient. Now it could be found the vital causes for inefficiency and enhanced it as per the analysis in section-4.

Table 1 Assessment section of four DMUs (C² R)
Analysis of Scale Advantage and Enhancement on not-DEA Efficient DMU
Considering the ongoing conversation, we looked into the definite causes for not-DEA efficient DMUs by assessing more carefully scale advantages and comparative efficiency of each input and output indexes. Later we explained and discussed different methods of enhancement.
Analysis of scale advantage
On the basis of the solution of DEA evaluation inthe given Table 1, defining) and k was known as the scale advantage of DMUj. Its potential value included the given scenarios.
If k=1, then it showed that scale advantages of DMUjcould be improved by adding inputs appropriately.
If k=1, then it showed that DMUjwas on the point with optimal scale advantages.
If k=1, it meant the scale advantages of DMUjdeclines as its inputs raised.
For each input and output index for DMUj,identifying redundancy rate αtjfor inputs xtjand deficiency rate βrjfor outputs Ytjcorrespondingly as follows:
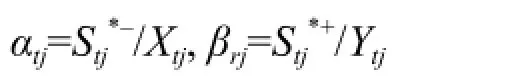
At this point, αtjindicated the ratio of i input could be decreased with outputs being constant.
At the same time, βrjrepresented the ration of j output could be increased with inputs being constant. Careful analyses of the results of each scheme are given in Table 2.

Table 2 Results assessment section of four DMUs (C²R)
Table 3 gave an idea about schemes 1 and 2 had been the optimal scale advantage position. Even though scheme 4 was weak DEA efficient, along with this it also had the optimal scale advantages point. Simply scheme 3 was the only scheme which was not scale efficient. The redundancy βrjfor both 1st and 5th output indexes was 12.32% and 13.14% correspondingly. This meant that scheme 3 didn't get the proper attention for raising the stocks in the industry, which resulted in the constraint to the benefit of stock rising to affect.
Evaluation and enhancement of schemes
Assuming the optimal outcomes of DEA models (DεC2R) were λ0, S0-, S0+, and θ0. Characterizing Xj0=θ0Xj0-S0-, Yj0=Yj0-S0+, seemingly (Xj0, Yj0) was DEA efficient and it was mentioned and known as projection of DMUj. Now planed scheme 3 to the efficient exterior of DEA (Table 3), which was quite a methodology to enhance it.
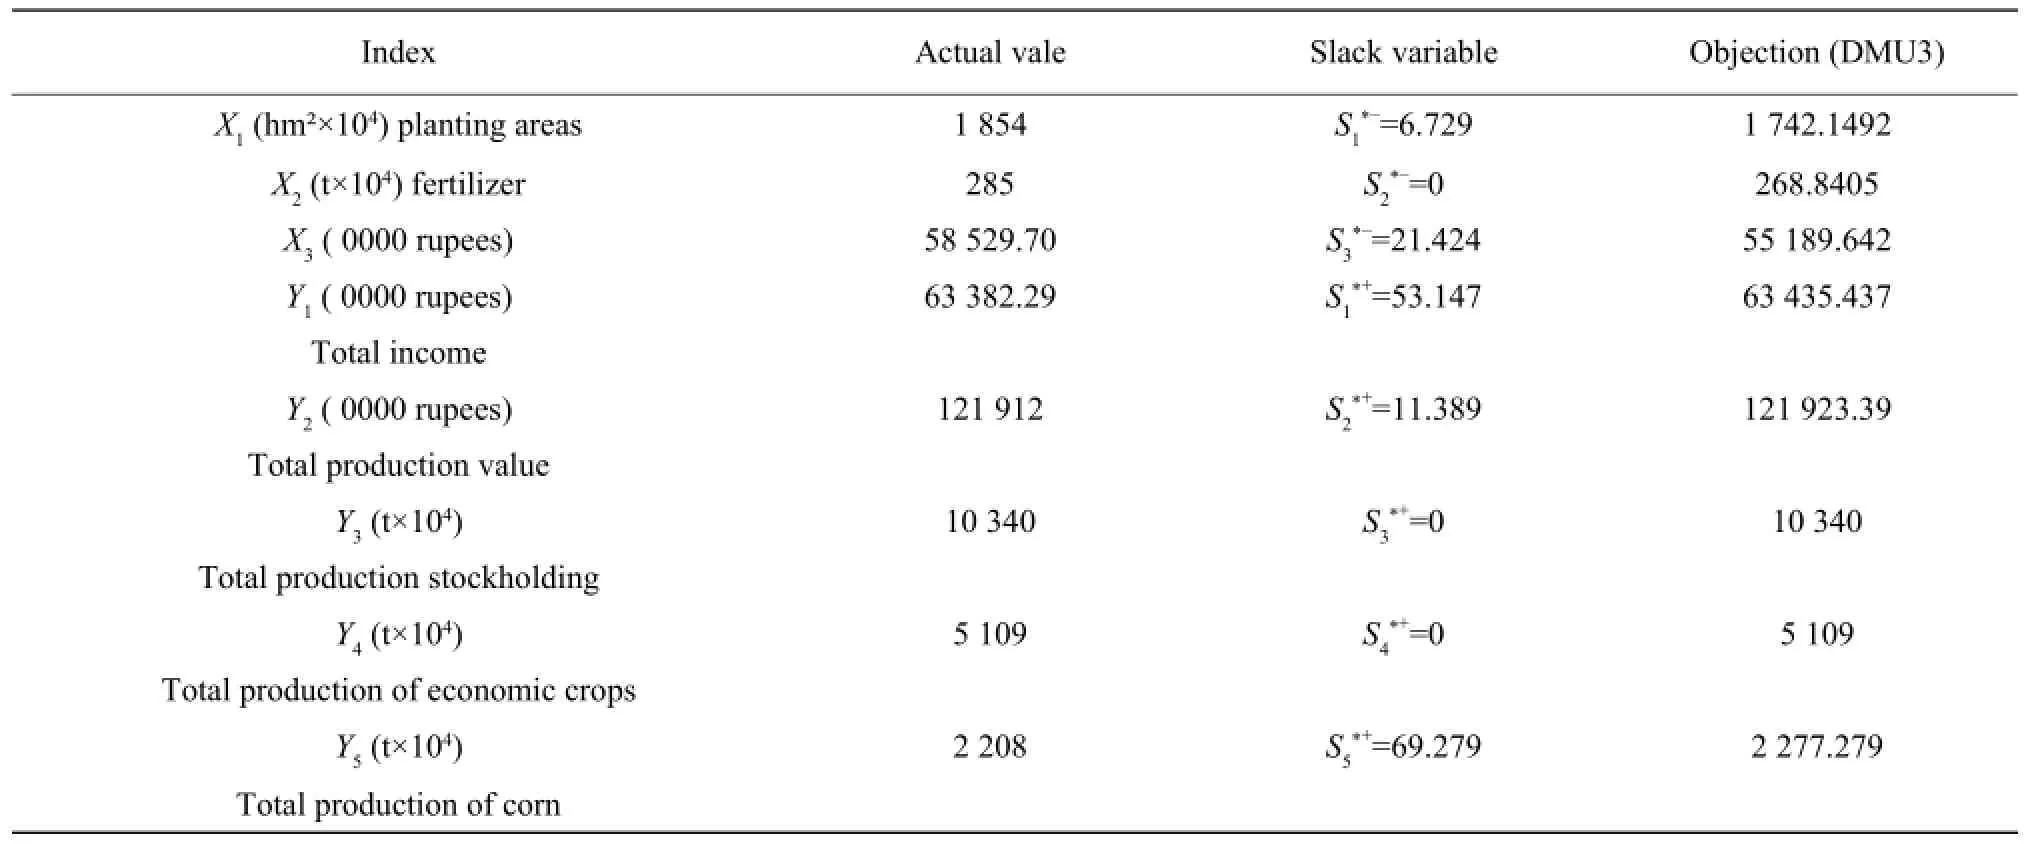
Table 3 Projection of scheme 3
Here, X={X13, X23, X33} and Y={Y13, Y23, Y33, Y43,Y53} indicated the input output vector of the scheme 3 correspondingly. After planning or projecting DMU3had been modified into a DEA efficient DMU, which illustrated that the methodology to enhance and modify DMU3, even though it was curtail to examine whetherthe modified DMU3was according to or satisfied the restraint conditions of optimizing model. This process redounded to act out as novel DMUs which in case was extra efficient and rational.
Categorizing and Choosing Optimal Scheme
In conventional DEA model, it's not easy to differentiate which one is the suited one amongst numerous DEA efficient DMUs. Currently, there has been quite some research and debates on the methodology of ranking and then choosing the optimal schemes amongst numerous DEA efficient DMUs(Zilla et al., 1998; Li et al., 2004; Meilin et al., 2009). In this manuscript, we implemented a novel ranking methodology which illustrated an ideal DMU (in current case DMUL). The inputs of DMULwere of the smallest amount whereas the outputs were the greater and most amongst other DMUs. Conceptualizing a new DEA model focusing on maximizing the efficiency of DMULto take a set of mutual weights named λj0(j=1, 2, . . . n), after this applied the mutual weights for evaluating each DMU's comparative efficiency, which actually was the foundation of ranking.
Setting up an ideal DMU (DMUj)
The nominal input Xminkand the highest output Ymaxrof the four DMUs were composed of the inputs and outputs of DMULcorrespondingly as follows: X1L=1 784, X2L= 307, X3L=62 930; outputs: Y1L=56 933.18 ,Y2L=119 864, Y3L=10 500 , Y4L=6 441, Y5L=2 715.
Developing evaluation DEA model
Indentifying indicated the efficiency index of DMUL,developing a DEA model focused on maximizing efficiency of DMUL. As given below,
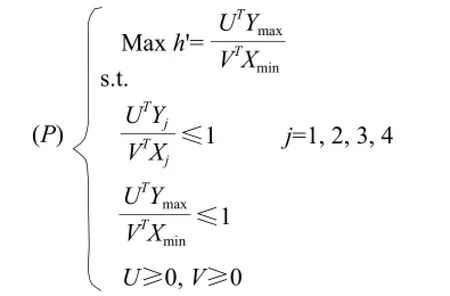
Whereas, U=(u1, u1, …, ul(sl))T, V=(v1, v2, …,vl(ml))T. Considering that the optimal outcome of the above given model (P) was U*& V*, indicated that U*& V*were the communal ranking weights of all DMUj. Concurrently, identifying (whereas j=1, 2, …, n)was the efficiency index for DMUj(whereas j=1, 2, …, n).
DMUs ranking
幸好,有一个同事,帮了我很多忙。还有一些朋友,时不时来看我;出院后,他们带着我玩,外地和本地。抑郁症患者最重要的是多一些交流和沟通,少一个人在房间里闷着、胡思乱想。身边朋友们的好,是一种拯救。也因此,对所有人感恩,感激于每一个对你无偿伸出援手的人,还有那些不落井下石,给予只言片语安慰和鼓励的人,不仅是一种自觉的素质,更是一种必不可少的习惯和品性。
After using the optimal programming software LINGO(Xie et al., 2011), we acquired the model (P) solution as:
h'*=1, U*=(7.8244, 3.402, 4.613)T, V*=(1.06948,5.01931, 0.7138, 0, 4.8397)T.
The comparative efficiency index calculations of each DMU are being shown in Table 4.

Table 4 Efficiency ranking index of all DMUs
Conclusions
In the manuscript, detailed evaluations of four schemes were given using DEA model from both theoretical and practical perspectives. We analyzed and computed scale efficiency of each scheme. In addition to this, by defining the concept of redundancyrate and insufficiency rate, discovered the definite causes for the not-DEA efficient DMU, shed light on how to improve it. By applying the concept of projection theorem, scheme 3 then had been improved to be a DEA efficient DMU. At the end, a novel methodology of DEA ranking had been applied to choose the best and optimal scheme for implementation purposes.
The scheme 2's efficiency and benefits in material form were more rational for the respective agricultural industrial production structure. The scheme developed the mainly most of comparative advantages of agriculture resources in Punjab Province (Pakistan),which as a result helped a lot to exercise powerful dragging effect of stocks raising and speeding up the industry to build up more synchronization. This research work in fact would get some guiding significance to carry through structure adjustment of agricultural industrial production structure of the province.
Li G, Cheng X Y. 2004. A method of ranking decision making unit. J of Pred Markets, 4: 51-53.
Li J L. 2010. DEA method in the evaluation of motor production application. J of Mech Mana and Devel, 25(5): 88-89.
Meilin W, Huaishu L 2009. Fuzzy data envelopment analysis (DEA): model and ranking method. J of Com and App Math, 223: 872-878.
Peihua fu, Zheng G Z, Cheng J W. 2013. Efficiency analysis of Chinese road systems with DEA. J of Soc and Beh Sci, 96: 1227-1238.
Quan L Q 1998. Evaluation relative efficiency DEA method - a new field of operation research. China People University Publishing House,Beijing. pp. 11.
Wang Q T, Wang X J. 2000. Evaluation mechanism of multi-index system based on optimal production function. J of Sci Prog and Count, 17(10): 103-105.
Wei Q L. 2001. Data envelopment analysis. Chimes Science Bulletin,46(16): 8.
Wu Wen J 2002. Application of data envelopment analysis method. China Statistics Publishing House, Beijing. pp. 11.
Xie J X, Xing W X. 2011. Using LINGO software solution of linear programming. Uni Math Exp Beijing: Tsinghua University Press, Beijing. Zeeshan A, Meng J. 2015. Agricultural production structure adjustment scheme evaluation and selection based on DEA model of Punjab(Pakistan). Journal of Northeast Agricultural University (English Edition), 22(2): 87-91.
Zilla S, Friedman L. 1998. DEA and the discriminating analysis of ratios for ranking units. Euro J of Op Re, 111: 470-478.
S9 Document code: A Article lD: 1006-8104(2015)-04-0048-05
Received 16 July 2015
Zeeshan Ahmad (1983-), researcher, Ph. D, engaged in the research of agricultural production structure adjustment in Pakistan. E-mail: zeeshanahmad00@yahoo.com
* Corresponding author. Meng Jun, professor, supervisor of Ph. D student, engaged in the research of agricultural production structure adjustment. E-mail: 1135044376@qq.com
猜你喜欢
杂志排行
Journal of Northeast Agricultural University(English Edition)的其它文章
- Effects of Ιnitial Ιnfestation Levels of Callosobruchus maculatus (F.)(Coleoptera: Chrysomelidae) on Cowpea and Use of Nicotiana tabacum L. Aqueous Extract as Grain Protectant
- Ιmpact of Microbial Ιnoculants on Microbial Quantity, Enzyme Activity and Available Nutrient Content in Paddy Soil
- Phenotypic and Genetic Characterization of Bacillus Species Exhibiting Strong Proteolytic Activity Ιsolated from Terasi, An Ιndonesian Fermented Seafood Product
- Effect of Quercetin on Egg Quality and Components in Laying Hens of Different Weeks
- Screening of Adoptive Elite Tea (Camellia sinensis) Clones
- Study on Hexagon-enveloping Leaf-stripping Mechanism for Corn Stalk