Cross-sectional study of use of electronic media by secondary school students in Bangkok, Thailand
2014-12-08KomsanKIATRUNGRITSirichaiHONGSANGUANSRI
Komsan KIATRUNGRIT*, Sirichai HONGSANGUANSRI
Cross-sectional study of use of electronic media by secondary school students in Bangkok, Thailand
Komsan KIATRUNGRIT*, Sirichai HONGSANGUANSRI
social networking, computer games, internet, adolescents, Thailand
1. Introduction
Several authors have expressed concerns about the increasing use of cell phones, internet games, and various types of social media by adolescents.[1,2]The concern is focused both on the inordinate amount of time using these media (which detracts from other developmentally important activities) and on the often sexual and violent content they are exposed to on these media. Excessive use of these media has been associated with increased aggressiveness, early sexual activity, and the use of tobacco and alcohol.[3,4]Other studies report an association with obesity and eating disorders.[5-8]Studies about the relationship between media use and cognitive development and academic achievement have not be conclusive.[9-14]
There have been some studies about media use among adolescents in Thailand, but most of these studies had substantial methodological flaws (e.g.,asking parents about their children’s media use, limiting the questionnaire to one or two types of media, etc.)that raise serious questions about the validity of the reported results. This study tries to address these limitations by selecting a representative sample of adolescent school children in Bangkok and administering a survey that covers the full range of media (cell phone,television, video games, listening to music, social networking media, etc.) and that asks respondents both about the duration of use and about the type of content used.
2. Methods
2.1 Sample and setting
The sampling procedure is shown in Figure 1. A stratified random sample of four schools were identified from the 385 middle/high schools and 20 vocational schools in the Bangkok Municipality and then at each selected school one class from each grade (grades 7 to 12) was selected and the students in those classes (11 to 19 years of age) were given the survey questionnaire to complete at home and return within 24 hours. Both the student and a parent signed the informed consent form for the survey. The survey was conducted between September and December 2011.
2.2 Questionnaire
The questionnaire used in this study was translated and modified from the ‘Generation M2 - Media in the Lives of 8- to 18-Year-Olds’ questionnaire, which has been used widely in the United States. (The original questionnaire is available in Appendix C of the document available at: http://kaiserfamilyfoundation.files.wordpress.com/2013/01/8010.pdf.) We received permission from the Kaiser Family Foundation to translate and use the questionnaire in Thailand.
In the survey respondents are asked about the frequency and duration of use of different types of electronic media over the previous day. Frequency of use is categorized as: ‘never’, ‘a little of the time’, ‘some of the time’ and ‘most of the time’. Duration of use is categorized ‘none’, ‘5-30 min’, ‘30-60 min’, ‘1-3 h’ and‘more than 3 h’. The responses were kept anonymous so it was not possible to identify the results for individual students.
Respondents were also asked about the number of electronic media in the household, including televisions,VCD/DVD players, radios, computers, and game consoles. The responses were classified as ‘1’, ‘2’, ‘3’,and ‘more than 3’. A separate set of questions asked about the availability of portable devices including mobile phones, CD players, MP3 players, laptops,tablets, internet connectable devices, and handheld game consoles. Finally respondents indicated which devices were available in their bedrooms.
Questions about use of phones covered the time spent talking on landlines and mobile phones, and the frequency of using mobile phones for text messaging,taking photos, recording videos, listening to music,connecting to the internet, playing games, watching television, watching movies, and using social networking services. Television use was specified by time period(’07:00 to 12:00’ ’12:00 to 18:00’ and ‘after 18:00’) and by type of media (standard television, mobile phone,MP3 player, internet, computer, and VCD/DVD player).The time spent playing games on electronic devices was categorized by type of device: stationary game console, mobile phone, handheld game console. Time spent listening to music, news, and podcasts was also categorized by device: radio, CD player, MP3 player,mobile phone, and computer.
The duration of use of computers at home, school,internet cafe, and other location over the prior 24 hours was categorized by type of activity: ‘doing homework’,‘playing computer games’, ‘instant messaging’,‘emailing’, ‘reading magazines or newspapers online’,‘doing graphical work (e.g. powerpoint, photo editing,web design)’, ‘visiting social networking sites such as Myspace or Facebook’, ‘visiting websites to watch or upload videos (e.g. YouTube)’, visiting other types of websites (e.g. Wikipedia, Yahoo, MTV.com, Kapook or Sanook) for anything besides schoolwork’ and ‘doing something else on the computer (not including listening to music or watching DVDs or TV shows, which was recorded elsewhere)’. Separate questions assessed whether or not the respondent hadeverdownloaded music from the internet; used instant messaging;obtained information on the internet about a health issue; listened to the radio through the Internet; visited MySpace, Facebook, Hi-5 or Twitter; created a profile onMySpace, Facebook, Hi-5 or Twitter; watched a TV show on the internet from a computer; watched a TV show on a cell phone or iPod or other MP3 player; read a blog;written a blog; watched a video on a site like YouTube or Google Video; or posted a video to a site like YouTube or Google Video.
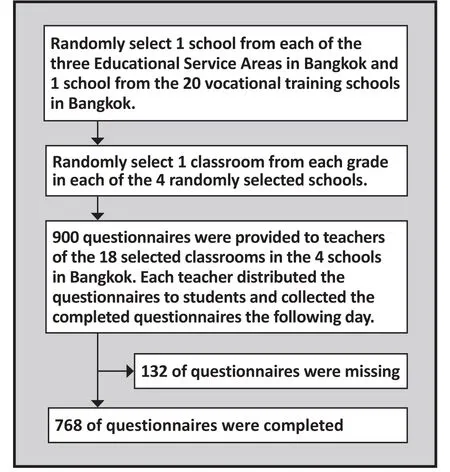
Figure 1. Identification of survey participants
Respondents indicated how often their parents enforced rules about mobile phone use and about the use of other electronic media; their responses were categorized as ‘most of the time’, ‘some of the time’, ‘a little of the time’, ‘never’, and ‘parents don’t have rules about phone (or other electronic media) use’.
2.3 Statistical analyses
We used SPSS version 20 for statistical analyses.
The questionnaire recorded times using each device for each specific use in time ranges (i.e., none,5-30min, 30-60min,1-3 hours, and >3 hours) so it was not possible to compute the times engaged in each activity by simply adding the times using each specific device for the activity (e.g., adding time using fixed phone and time using mobile phone to determine totaltime using a phone). To overcome this we estimated the time engaged in an activity by assuming that the time spent using each specific device for the activity was the lowest value in the reported range (e.g., if time using a cell phone was scored as ‘1-3’ hours, we assumed it was 1 hour when combining it with time using a fixed phone to arrive at total time using a phone). We used the same process when combining the times engaged in the various activities to estimate the ‘total time using electronic devices in last 24 hours’ variable.
We compared the time spent engaged in each type of activity and the total time spent using mobile phones,computers, or any type of electronic device by gender,age (below 15 vs. 15 and older), and parental education(with or without university degree) using Mann-Whitney rank tests (reporting the standardized Z-value); we also compare these measures with the student’s grade point average in the prior year (0.00 - 2.50, 2.50 - 3.00,3.00 - 3.50, and more than 3.50) using Spearman (rank)correlation coefficients. All tests were two-tailed and statistical significance was set as p-value <0.05.
3. Results
The characteristics of respondents are shown in Table 1. The 768 participants who completed the survey included 325 (42.3%) males and 443 (57.7%) females;their mean (sd) age was 15.4 (1.5) years.
The availability of electronic devices is shown in Table 2. Virtually all respondents reported having a television in the home, 97% reported having a computer in the home, and 90% reported having internet access in the home; 28% had more than 3 television sets in the home and 15% had more than 3 computers in the home. Among the respondents, 94% had mobile phones, 77% had a television in their bedroom, 52%had a computer in their bedroom, and 47% had internet access in their bedroom.
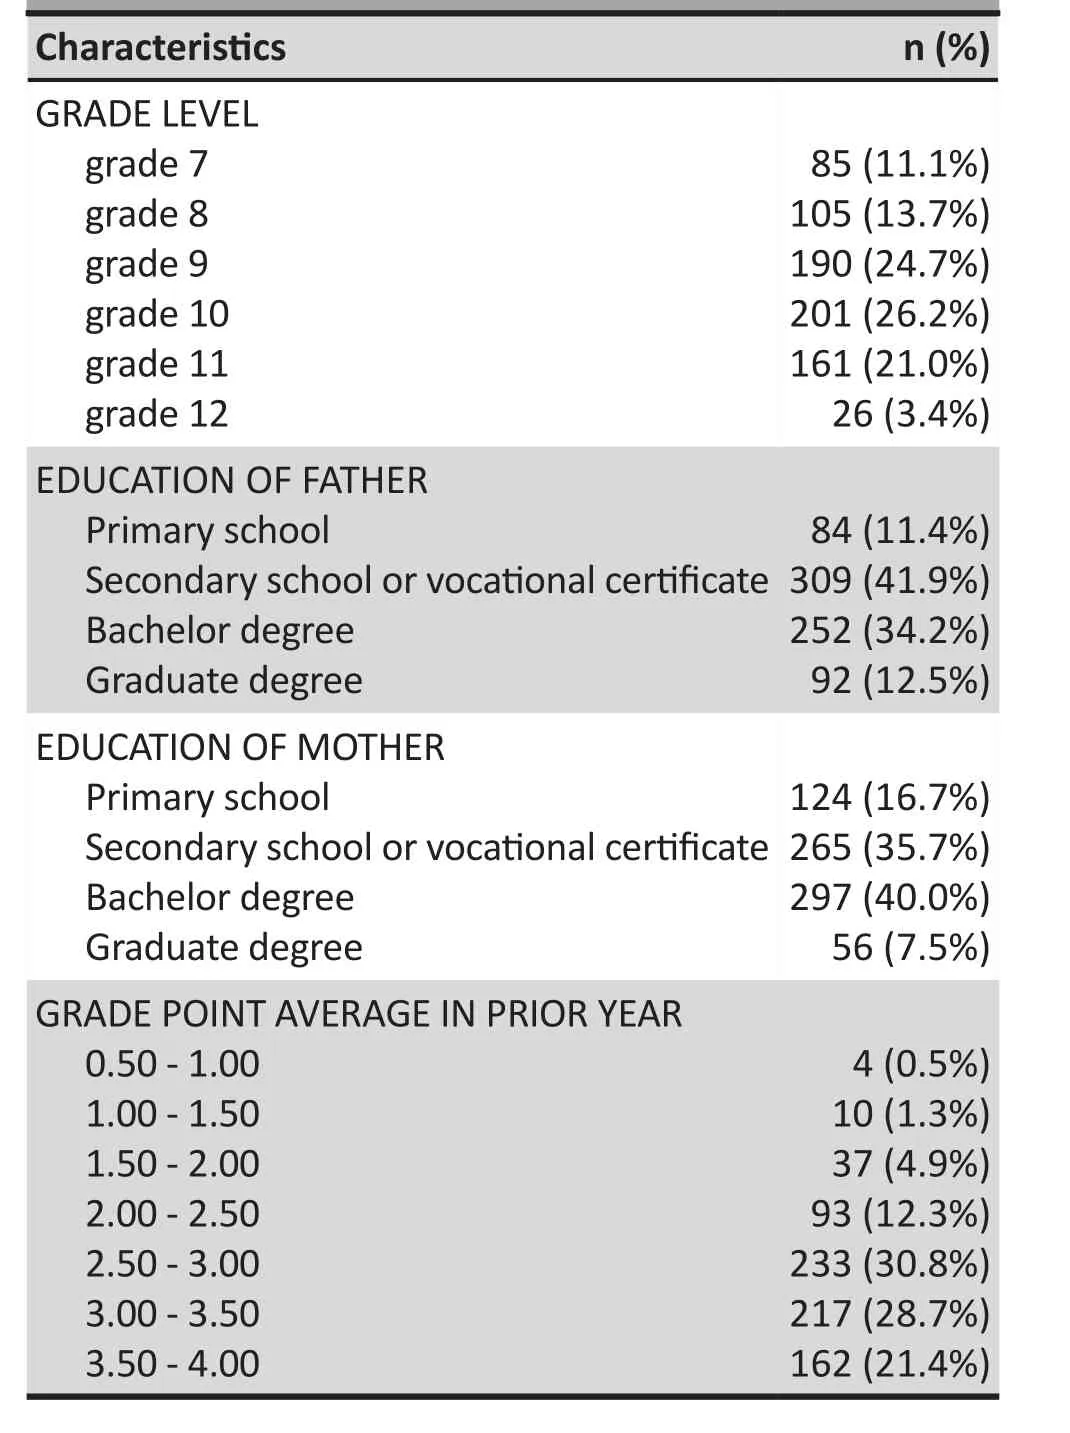
Table 1. Characteristics of the sample
3.1 Use of electronic devices
The frequency and pattern of use of the different electronic devices are shown in Tables 3 and 4. Almost all respondents used multiple electronic devices for a variety of purposes in the 24 hours prior to the survey.Among the respondents, 96.2% had watched television shows or movies using a variety of devices; 94.3% had listened to music; 91% had used social networks or instant messaging; 90.4% had used a computer for some other recreational purpose (e.g., watching music videos); 95.3% had played games on an electronic device; 94.4% had used a phone; and 70.6% had used a computer to do homework.
The time spent engaging in these activities was substantial. Among the respondents, 39% reported watching television shows or movies for 3 hours or more per day, primarily in the evening hours on a household television set or the internet. In addition, 28% reported spending 3 or more hours per day communicating with others on social networking sites, by instant messaging,or by e-mailing; 25% reported spending 3 or more hours per day listening to music, primarily on a computer or mobile phone; 18% reported spending 3 or more hours per day playing games on a computer or other device;and 16% reported using computers 3 hours or more per day for other recreational activities such as downloading videos, watching music videos, and so forth. Using a computer to do homework or talking on a phone with friends consumed much less time than these other activities: only 4.8% used a computer for homework for more than 3 hours per day and only 2.5% talked on a phone (usually a mobile phone) for more than 3 hours per day.
Overall, using a conservative method to compute total time spent using various electronic devices in the prior 24 hours (see methods section), 21.4% reported using electronic devices for less than 3 hours, 23.8%used electronic devices for 3 to 5 hours, 27.6% used electronic devices for 6 to 11 hours, and 27.2% used electronic devices for 12 or more hours. Only 6% of respondents used electronic devices for 1 hour or less in the prior day.
Among all respondents 56% reported having some household rules about the use of electronic devices(including cellphones) and 19% reported that there were parental rules about the use of electronic devices in the home that were regularly enforced. Only 69 respondents (9%) reported having mobile phone use rules in the home that were regularly enforced.
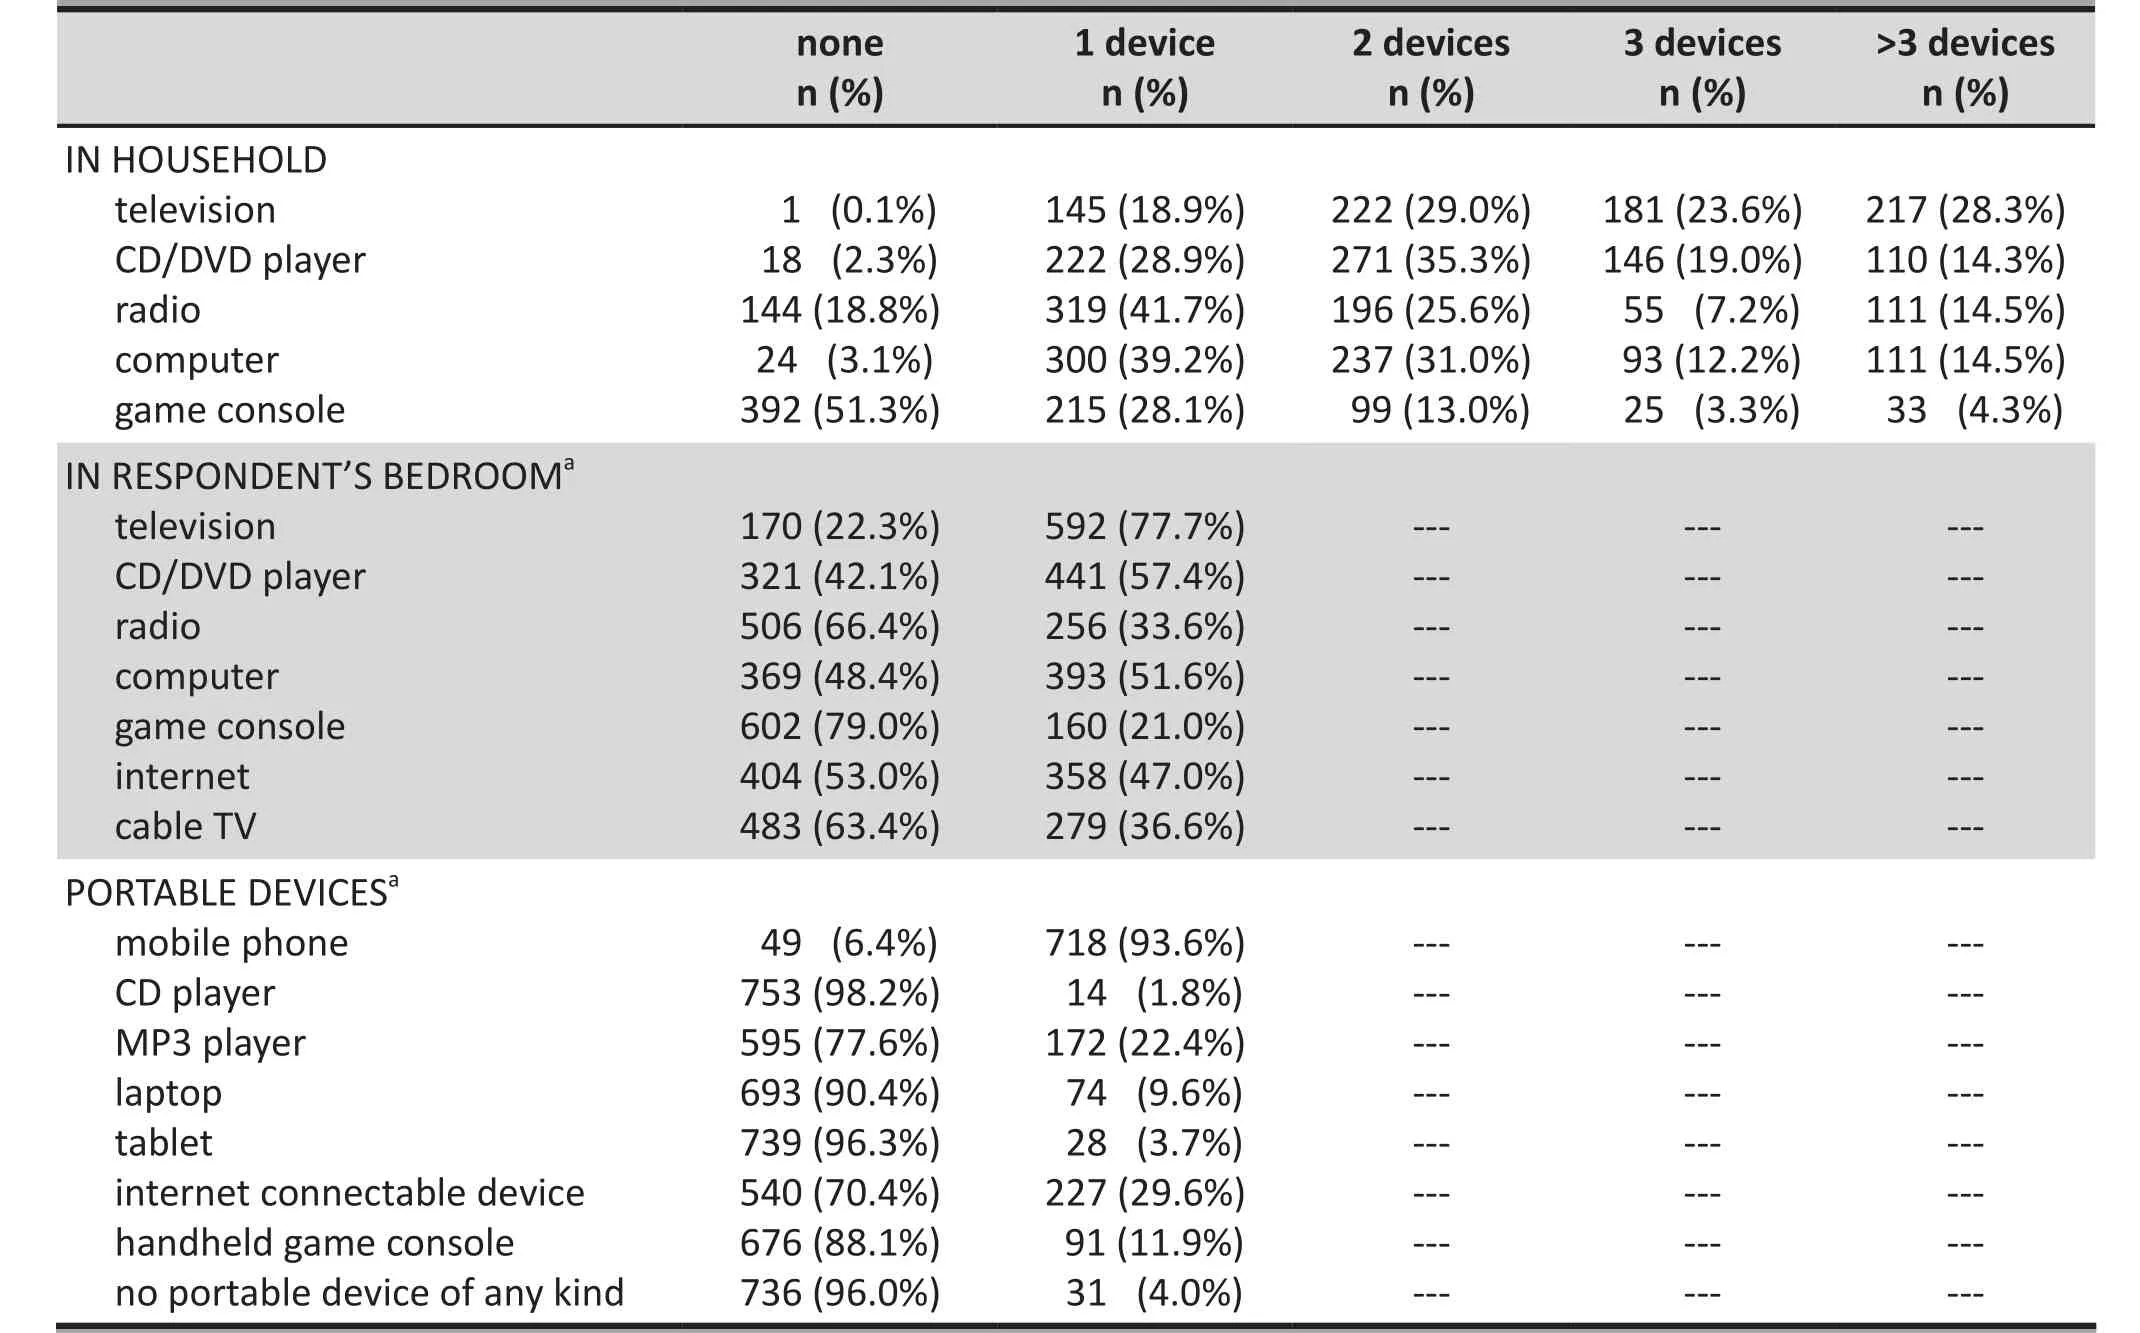
Table 2. Availability of electronic devices
3.2 Association between usage of electronic devices and demographic factors
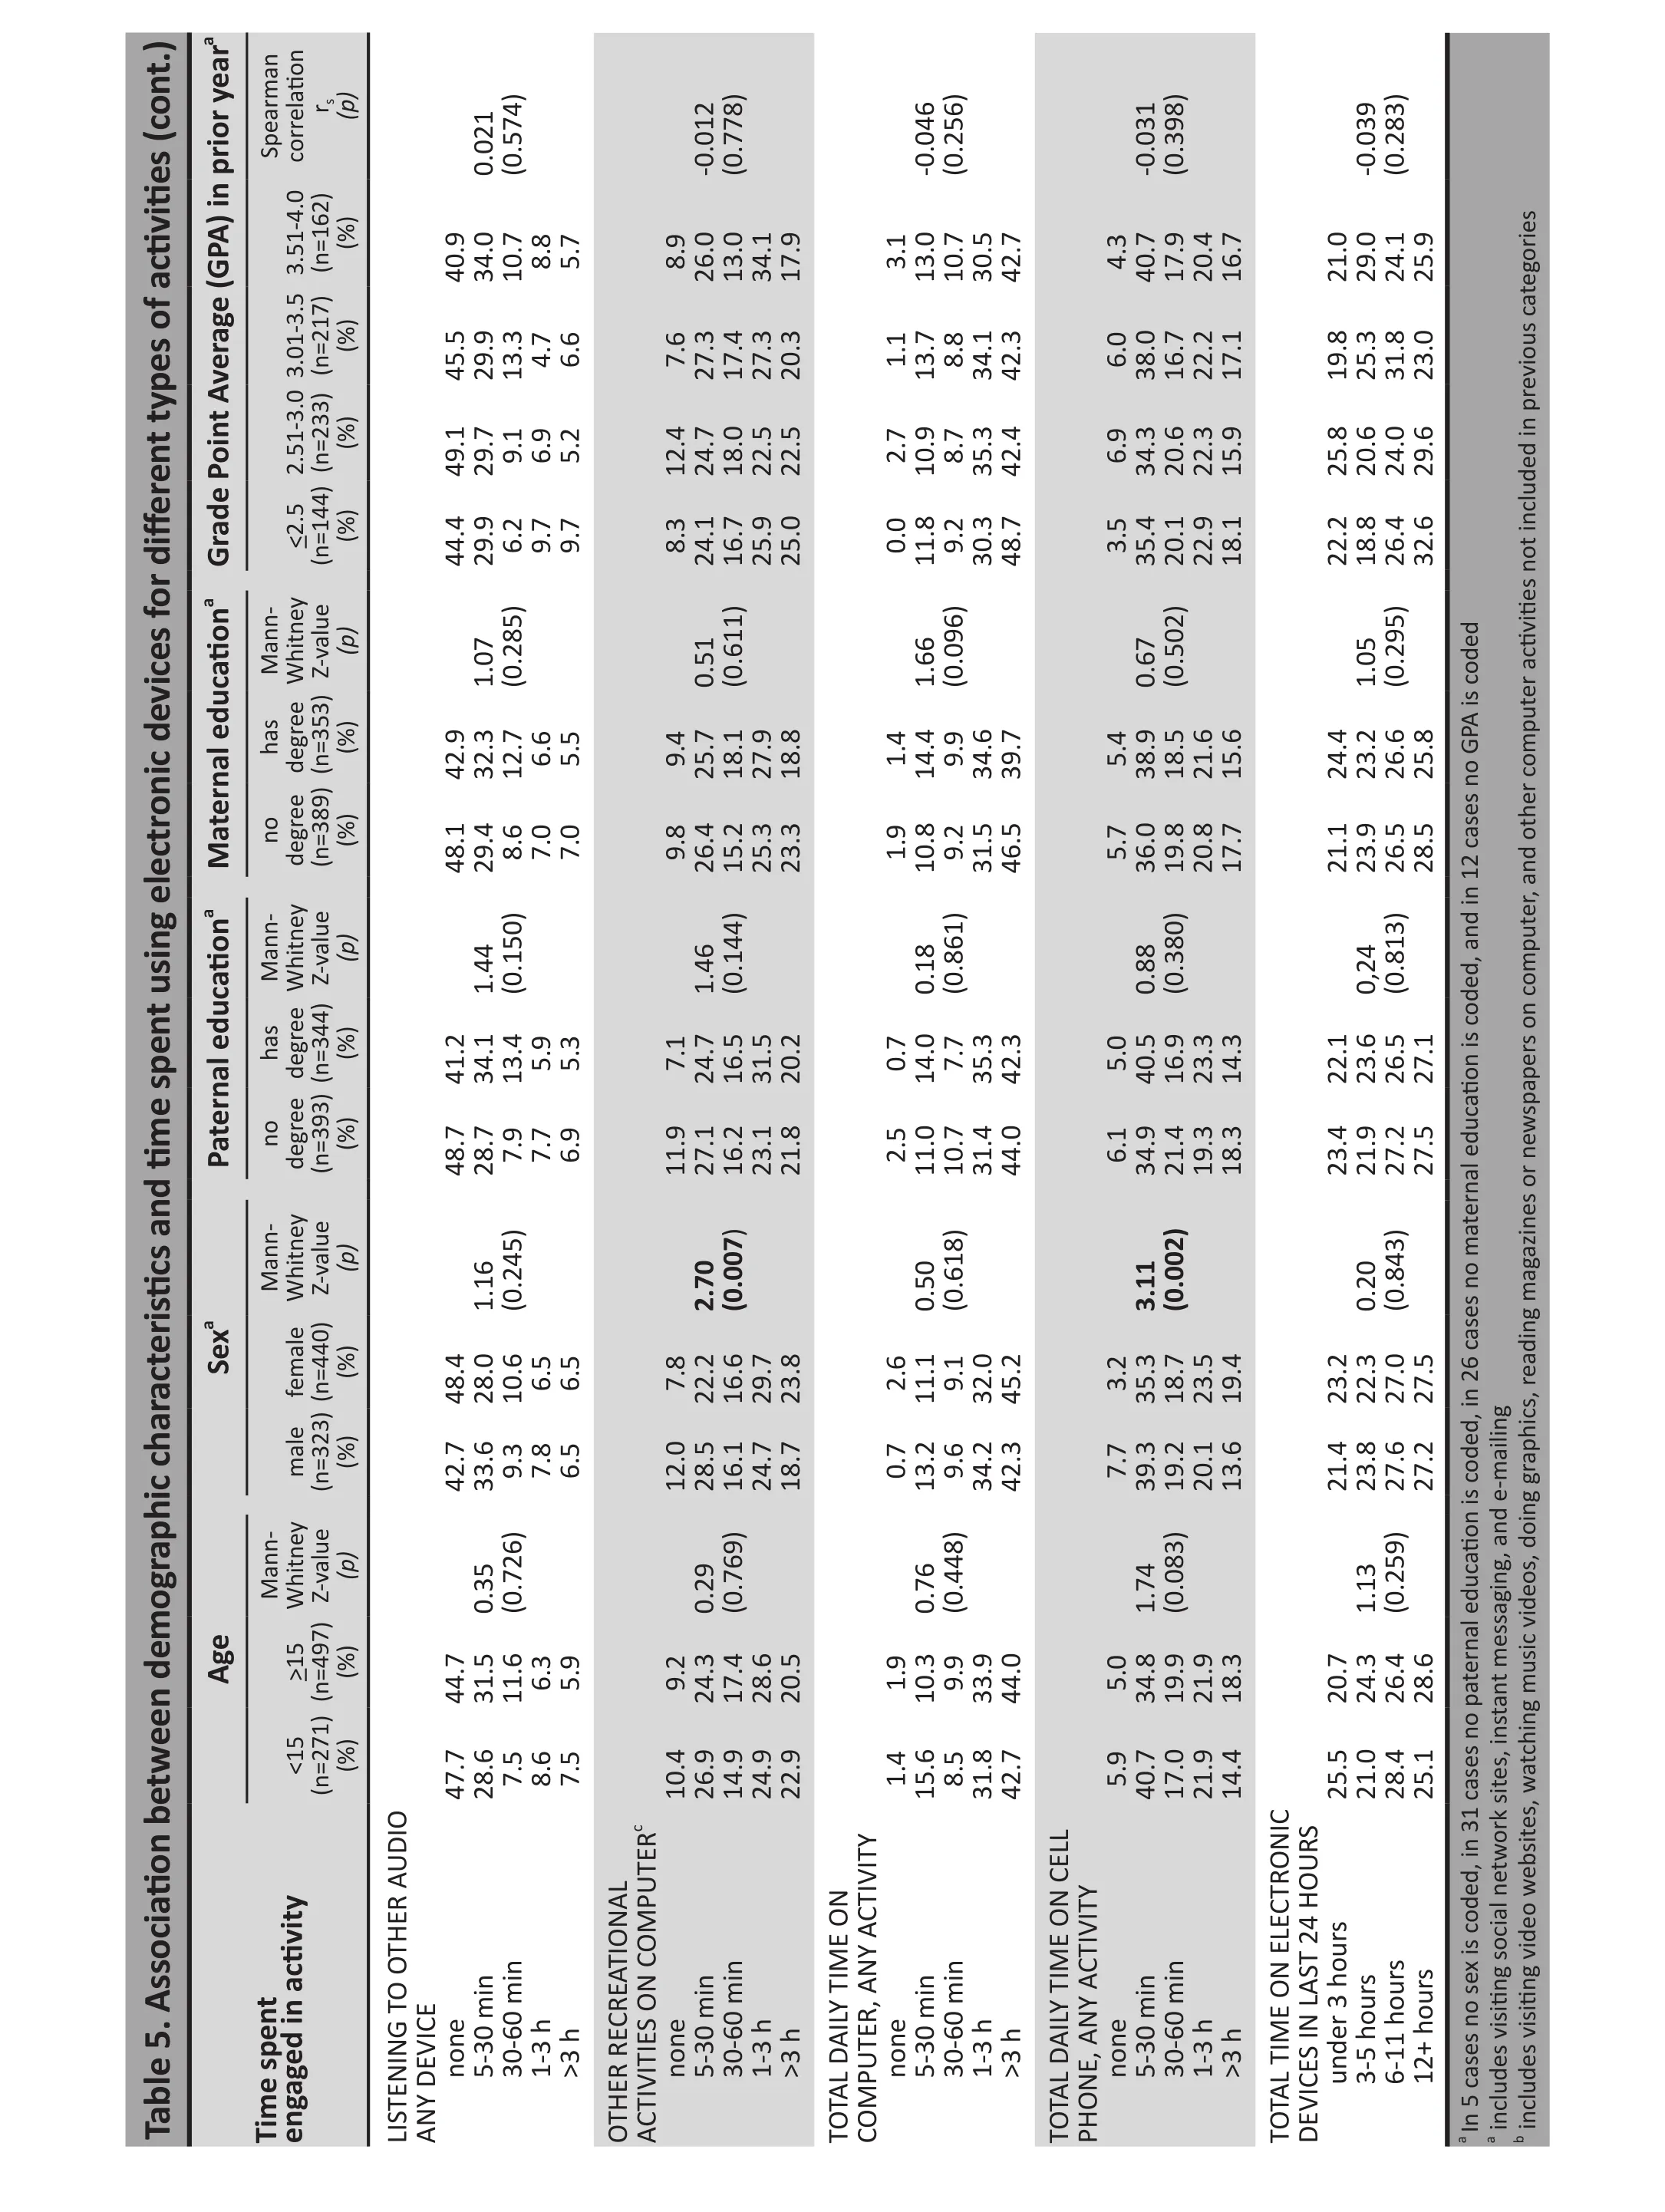
The relationship between the amount of time spent engaged in the various types of device-enhanced activities and the total time spent using cell phones,computers, or any electronic device with gender, age,parental education, maternal education, and grade point average are shown in Table 4.
The overall lack of associations between these demographic variables and the time engaged in the various activities using electronic devices was remarkable. Parental and maternal level of education were unrelated to any of the variables. Student grade point average (GPA) in the prior year was only related to one variable: students with lower GPAs were more likely to spend longer playing games on electronic devices(rs=-0.094,p=0.014). Age (under 15 vs. 15 or older) was only related to the two interpersonal communication variables: older children spent significantly more time talking with friends on phones and engaged in other forms of social communication (via social networks, text messaging, and e-mailing) than younger children.
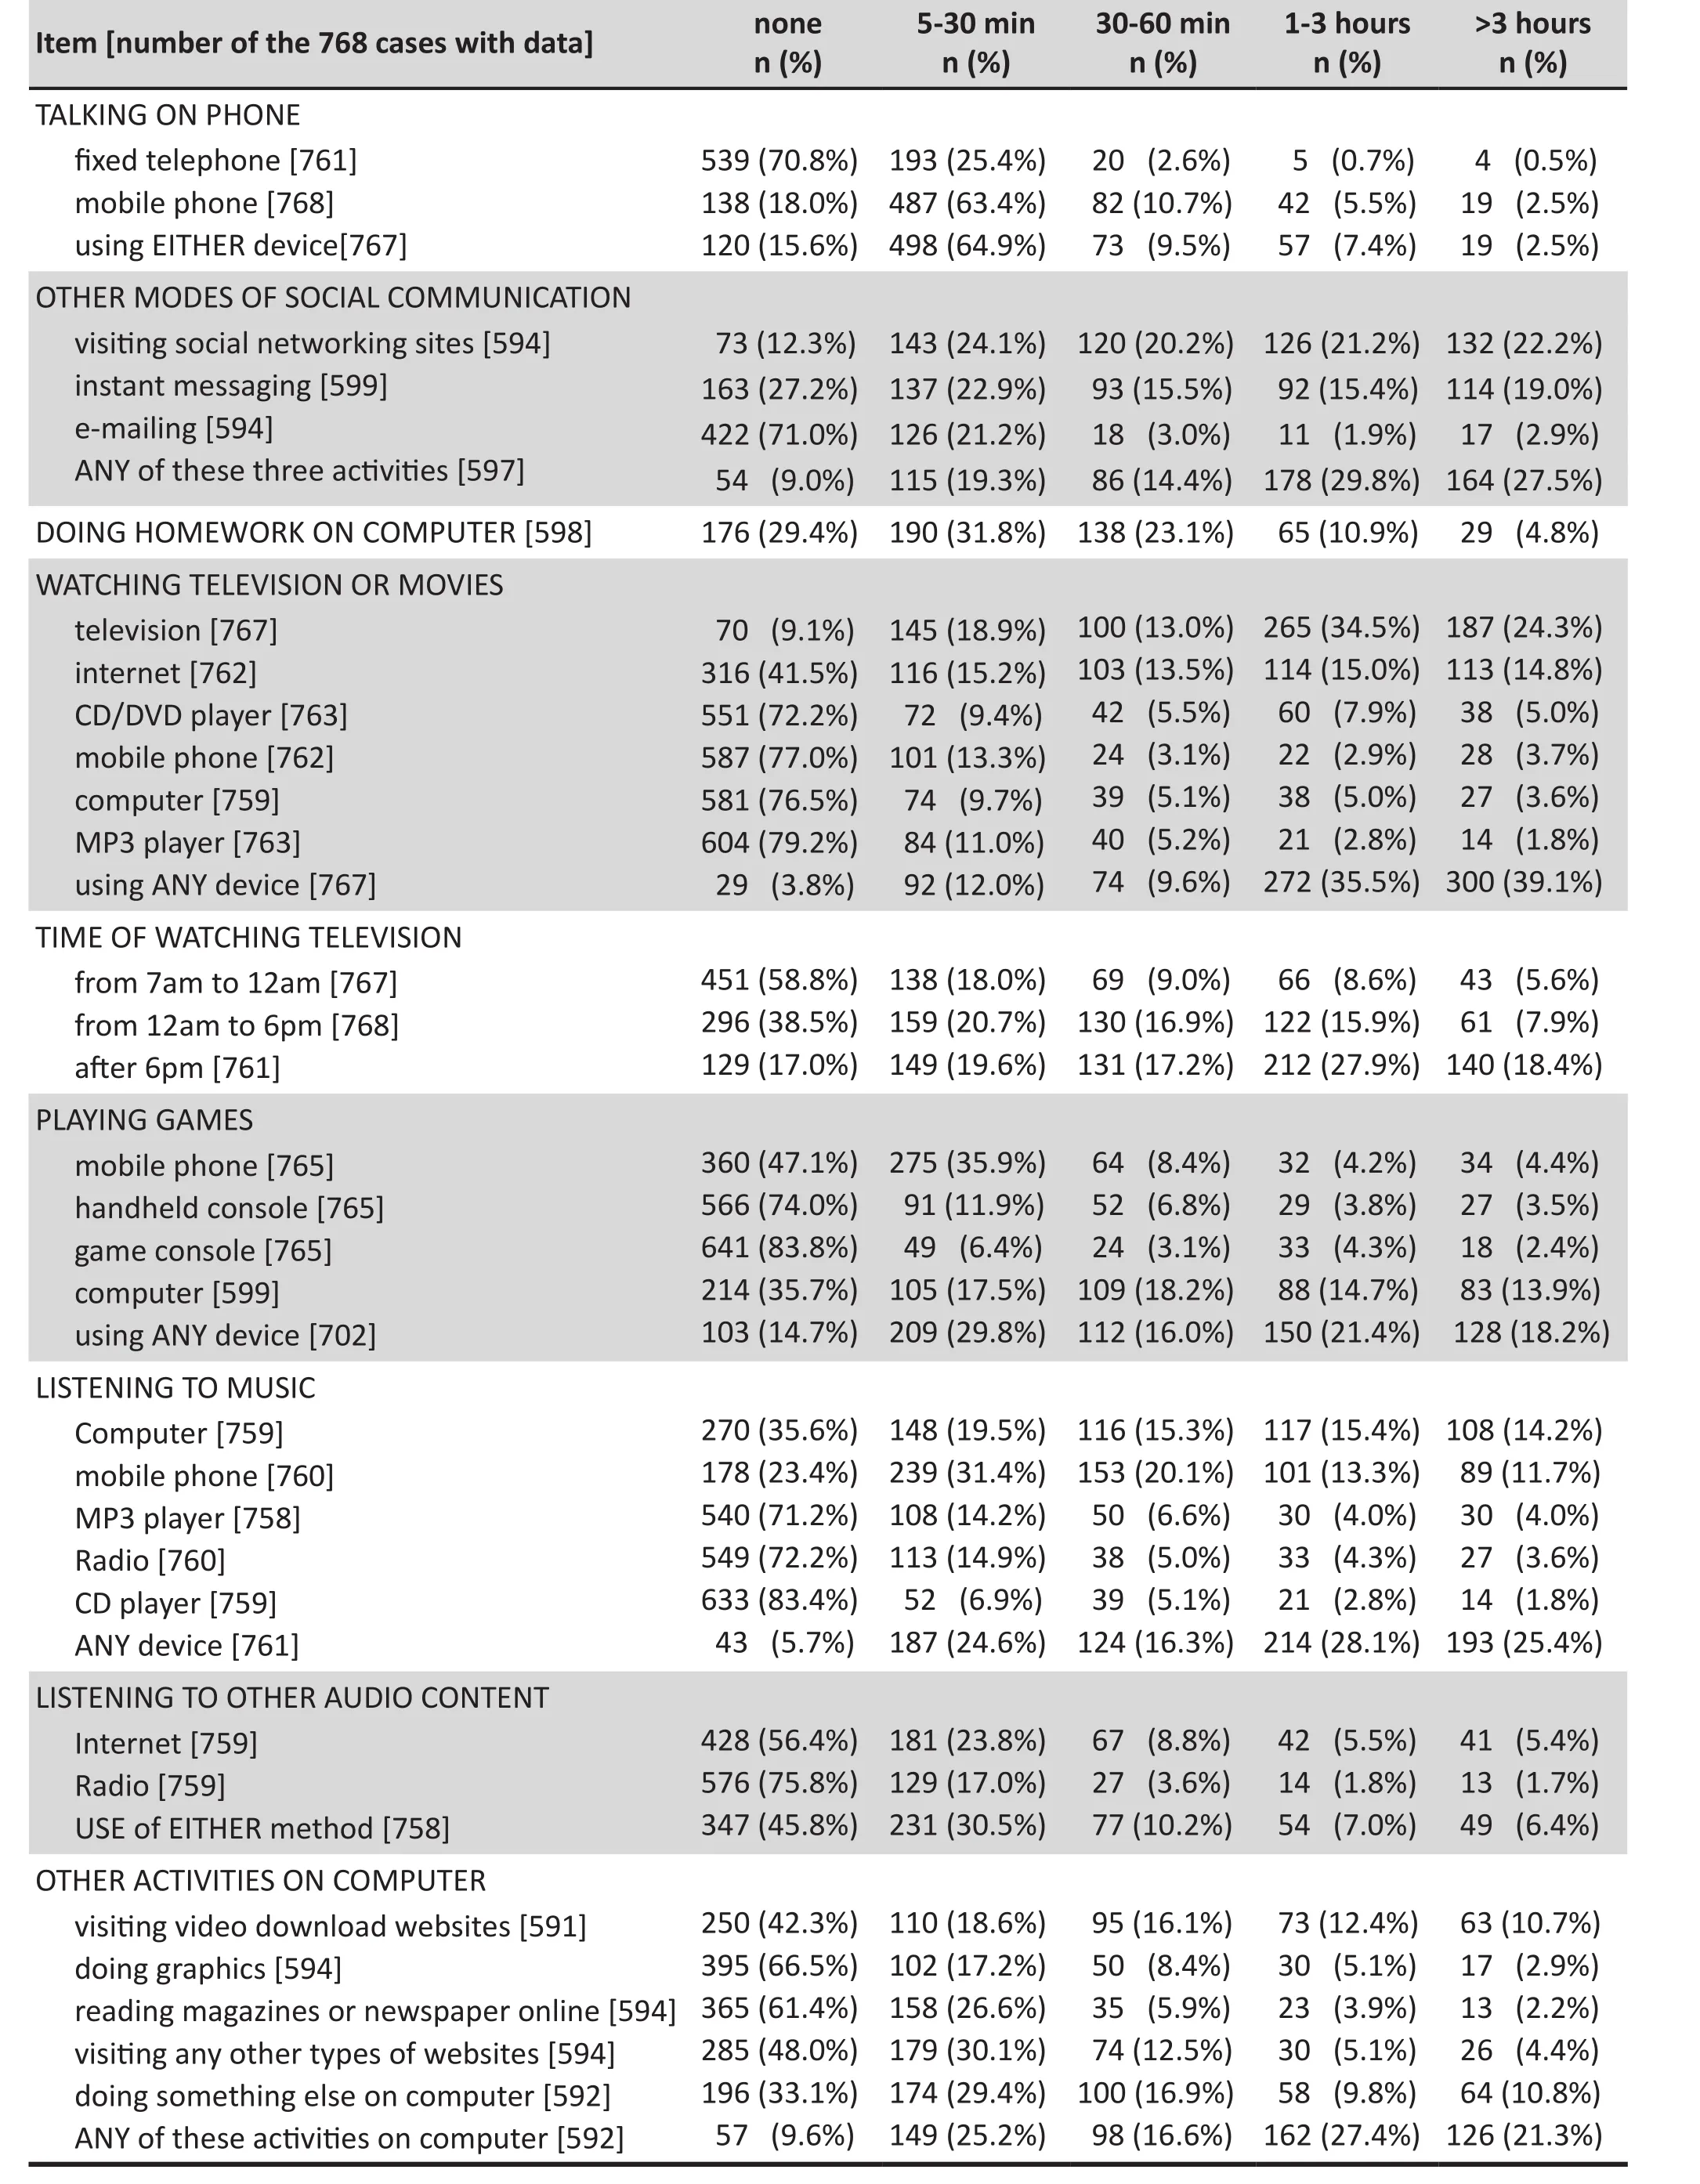
Table 3. Time engaged in different activities using various electronic devices in prior 24 hours
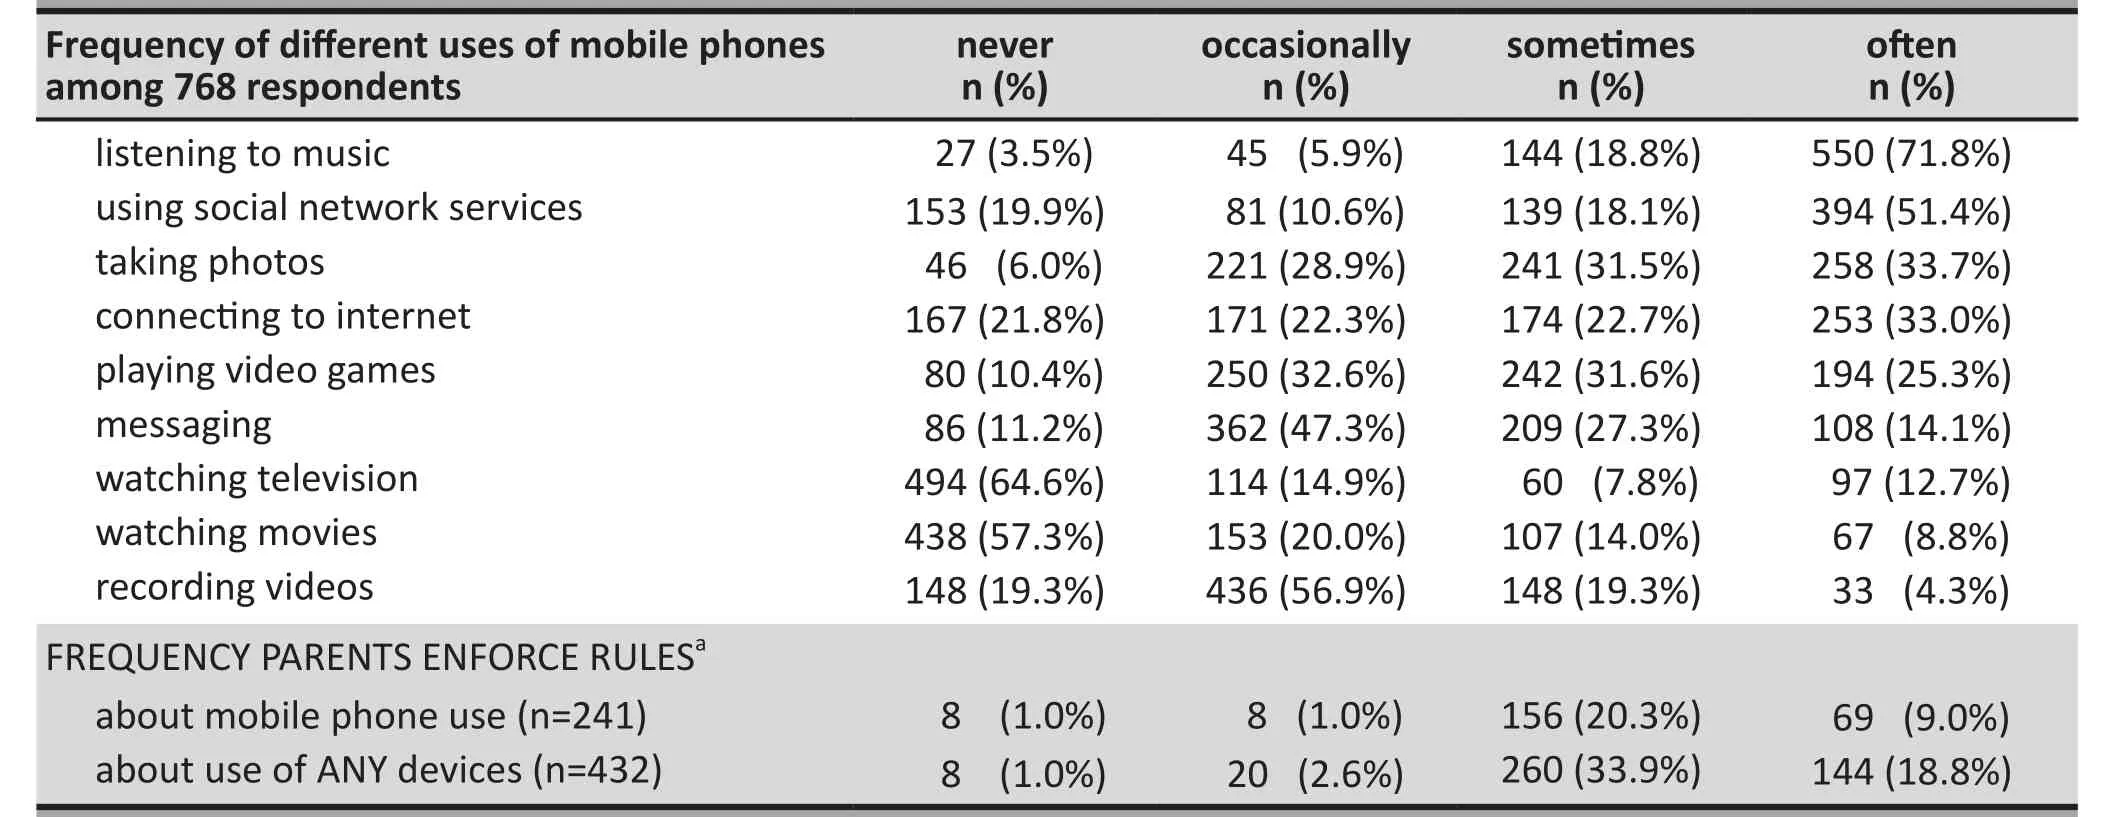
Table 4. Mobile phone use by adolescents and the prevalence and enforcement of parental rules about use of electronic devices in the recent past
There were, however, some interesting differences by gender. Girls spent more time than boys engaged in interpersonal communication activities using a phone or other means of social communication. Boys spent much more time playing games on electronic devices than girls but girls spent more time listening to music. There was no difference in the total time spent on a computer during the day by gender, but girls spent more time than boys using a computer for other types of recreational activities (not including watching television shows,watching movies or playing games) and there was a non-significant trend (p=0.059) for girls to spend moretime using a computer to do homework than boys. Girls also spent more time using cell phones than boys.
None of the demographic variables assessed was significantly related to our measure of total time using electronic devices in the prior day.
4. Discussion
4.1 Main findings
Given the widespread availability of a bewildering array of electronic devices to adolescents, and the—as yet unproven – assumption that excessive use of these devices or the access to inappropriate content afforded by these devices has serious social and psychological consequences, accurate monitoring of the time they spend on these media and of the content they see on these media is essential. Without such information it will not be possible to confirm the presumed negative impact of the use of these devices and, more importantly, it will not be possible to assess the effectiveness of interventions aimed at decreasing usage and decreasing access to inappropriate content.There has been considerable research in this area in high-income countries but relatively little such research in low- and middle-income countries.
The current study used an adapted version of an instrument used for this purpose in the United States with a sample of middle school and high school students in Bangkok, Thailand. Using this adapted instrument,we found that the adolescent respondents had ready assess to most types of electronic devices, often in their bedroom. They used these devices for a substantial part of the day (over one-quarter of respondents used these devices for more than 12 hours per day!) and typically utilized several different types of devices to obtain content of interest. Interestingly, the time engaged in different activities using the devices and the total time using a computer, a cell phone, or any electronic device was not related to parental education – a marker of the socioeconomic status of the family. The use of the devices was also not related to prior academic performance, with the one exception of a weak negative correlation between time spent playing computer games and grade point average in the prior year. The usage pattern by age and gender was consistent with current understanding of adolescent social development: as they age adolescents become increasingly focused on interpersonal relationships so they tend to spend more time on electronic media engaged in interpersonal communication (i.e., talking on the phone, visiting social network sites, and text messaging); and girls tend to be more engaged in interpersonal relationships and passive recreational activities like listening to music while boys are more interested in competitive games.

?
?
The access to electronic devices and the pattern of usage was similar, but not identical, to that reported in the study that used the same instrument among adolescents in the United States.[1]Cross-national differences in the availability of devices are probably due to cross-national differences in the relative cost of the devices and cross-cultural differences in household sleeping arrangements (unlike the United States, in Thailand most adolescent children still sleep in the same bedroom as their parents). Access to devices can change dramatically over relatively short periods of time; for example, an earlier internet-based study[15]reported that 72% of Thai teens owned mobile phones while our study found that 94% owned mobile phones.This may partly explain differences in the platforms used by teens in different countries to access the same type of content: for example, we found that the mobile phone was the most frequently used device for listening to music in Bangkok while the United States study[1]found that MP3 players were the most commonly used platform for listening to music.
We did not confirm previous reports about the close relationship between high levels of media use and poor school performance.[1,4,16]We found a weak correlation between time spent playing games on computers (a predominantly male activity) and lower grade point average, but none of the other types of media usage were related to academic performance.Further research will be needed to determine whether or not there is a causal relationship between the amount and content of the use of electronic media by Thai adolescents and their academic performance – or other outcomes of interest such as tobacco and alcohol use, anxiety and depressive symptoms, aggressive behavior, and self-harm.
4.2 Limitations
There are several limitations that need to be considered when assessing these results.
(a) This is a relatively large sample of middle school and high school students from a randomly selected set of schools in Bangkok, but the specific classes chosen in each school were determined by the coordinating teacher, so we are unable to determine how representative the sample is of all adolescents in Bangkok.
(b) The students were sent home with the survey instrument so they were not observed while completing the form; it is possible that friends or family members influenced their responses.
(c) Several items in the questionnaire were left blank by over 150 or the 768 respondents (they probably skipped some of the sections) so this may have biased some of the results.
(d) The time frame for the estimates of the duration of usage of the various devices was in the last day.The purpose of doing this was to limit the problem of recall bias, but the day chosen may have been a weekend or atypical for one reason or another, so the responses may not provide an accurate picture of a ‘typical’ day for the respondent.
(e) The times engaged in each activity using each device were recorded categorically (i.e., none,5-30 minutes, 30-60 minutes, 1-3 hours, and over 3 hours) so it was not possible to directly estimate times engaged in each activity (which typically involved using various devices). We developed an algorithm for crudely estimating these times(described in the methods section) but this method provides a very conservative estimate of the time using electronic devices for the various activities; the actual times may be substantially higher than those reported in the results.
(f) Given the categorical nature of the time data, it was not feasible to assess the relationship of the duration of engagement in various activities with subcategories of demographic variables of interest(e.g., males <15, males >, females <15, and females>15).
(g) The test-retest reliability of the questionnaire has not yet been assessed.
(h) The validity of these self-reports has not been assessed by comparing them with other measures of usage (e.g., parental reports).
(i) This is a cross-sectional study so it was only able to assess associations between the demographic variables and the times engaged in various activities, prospective studies are needed to assess cause-effect relationships.
(j) This study did not include assessment of type of content accessed by respondents who watched television shows, movies, and other types of media. Subsequent studies aimed at assessing the relationship between the use of different media and subsequent adolescent behavior (e.g., violence to others, self-harm, substance abuse, unprotected sex, etc.) will also need to obtain more detailed information about the type of content accessed.
4.3 Implications
The almost universal availability of a wide range of electronic devices to youth is an inevitable part of modern urban life. Despite limitations in the categorical method of assessing the time using various devices employed in this study, a clear pattern emerges:adolescents spend a substantial part of every single day using these devices, most content of interest to adolescents is obtained from a variety of devices, the pattern of use varies with age and by gender, and parental rules about the use of electronic devices are only intermittently enforced. Overall, 94% of respondents used electronic media for more one hour each day, so it is doubtful that the Thai parental recommendations to limit use to 1 hour or less on school days and 2 hours or less on weekends and vacations[17]is feasible or enforceable. More direct evidence about the negative effects of media use by adolescents is needed before recommending the promotion of such draconian measures. Longitudinal studies with more precise time logs of device usage that simultaneously assess the type of content accessed are needed to determine the extent to which these activities have negative (or positive) effects on the social and psychological development of adolescents. If there are negative effects – the evidence for this remains ambiguous because most studies show associations,not causal relationships – subsequent studies will be needed to assess the effectiveness of parental or other restrictions on reducing adolescent usage of these devices and, more importantly, to determine whether or not decreased usage actually results in a reduction of the negative outcomes of concern.
Acknowledgements
The authors would like to thank the four schools in this study for their cooperation and support in the survey.We also thank Professor Sirichai Hongsanguansri from the Department of Psychiatry, Ramathibodi Hospital,Mahidol University who provided important suggestions in study designs and implementation.
Disclaimer
The views expressed in this article are those of the authors and not an official position of the authors’institution or the funding agency for the study.
Conflict of interest
The authors report no conflict of interest related to this manuscript.
Funding
The research was funded by a ‘Routine to Research’grant from the Ramathibodi Hospital.
Ethics approval
This study was approved by the Institutional Review Board of Ramathibodi Hospital, Mahidol University Faculty of Medicine.
Informed consent
All participants and parents or guardians of the participants gave written informed consent before participation.
1. Victoria JR, Ulla GF, Donald FR, editor. Generation M2 media in the lives of 8- to 18-year-olds [Internet]. A Kaiser Family Foundation Study; 2010 [cited 20 Jan 2010]. Available from:http://kff.org/other/event/generation-m2-media-in-the-lives-of/
2. Lenhart L, Purcell K, Smith A, Zickuhr K.Social Media& Mobile Internet Use Among Teens and Young Adults.Washington D.C.: Pew Internet & American Life Project;2010. p. 1-37
3. Susan V. Impact of media on children and adolescents:a 10-year review of the research.J Am Acad Child Adolesc Psychiatry. 2001; 40: 4. doi: http://dx.doi.org/10.1097/00004583-200104000-00007
4. Strasburger VC, Jordan AB, Donnerstein E. Children,adolescents, and the media: health effects.Pediatr Clin North Am. 2012; 59(3): 533-587. doi: http://dx.doi.org/10.1016/j.pcl.2012.03.025
5. Hancox RJ, Milne RJ, Poulton R. Association between child and adolescent television viewing and adult health: a longitudinal birth cohort study.Lancet. 2004; 364: 257–262.doi: http://dx.doi.org/10.1016/S0140-6736(04)16675-0
6. van den Berg P, Neumark-Sztainer D, Hannan PJ, Haines J.Is dieting advice from magazines helpful or harmful? Fiveyear associations with weight-control behaviours and psychological outcomes in adolescents.Pediatrics. 2007;119(1): e30–37. doi: http://dx.doi.org/10.1542/peds.2006-0978
7. Marなnez-González MA, Gual P, Lahoriga F, Alonso Y, de Irala-Estévez J, Cervera S. Parental factors, mass media influences,and the onset of eating disorders in a prospective population based cohort.Pediatrics. 2003; 111(2): 315–320. doi: http://dx.doi.org/10.1542/peds.111.2.315
8. Benowitz-Fredericks CA, Garcia K, Massey M, Vasagar B,Borzekowski DL. Body image, eating disorders, and the relationship to adolescent media use.Pediatr Clin North Am.2012; 59(3): 693-704. doi: http://dx.doi.org/10.1016/j.pcl.2012.03.017
9. Bremer J. The internet and children: advantages and disadvantages.Child Adolesc Psychiatr Clin N Am. 2005; 14(3):405-428. doi: http://dx.doi.org/10.1016/j.chc.2005.02.003
10. Christakis DA, Zimmerman FJ, DiGiuseppe DL, McCarty CA. Early television exposure and subsequent attentional problems in children.Pediatrics. 2004; 113(4): 708–713
11. Hancox RJ, Milne BJ, Poultn R. Association of television viewing during childhood with poor educational achievement.Arch Pediatr Adolesc Med. 2005; 159(7): 614–618. doi: http://dx.doi.org/10.1001/archpedi.159.7.614
12. Zimmerman FJ, Christakis DA. Children’s television viewing and cognitive outcomes: a longitudinal analysis of national data.Arch Pediatr Adolesc Med. 2005; 159(7): 619–625. doi:http://dx.doi.org/10.1001/archpedi.159.7.619
13. Borzekowski DLG, Robinson TN. The remote, the mouse,and the No. 2 pencil: the household media environment and academic achievement among third grade students.Arch Pediatr Adolesc Med. 2005; 159(7): 607– 613. doi: http://dx.doi.org/10.1001/archpedi.159.7.607
14. National Statistical Office of Thailand. Survey of parent’s view of internet or computer use of their children and family members [Internet]. [cited 2013 Oct 13]. Available from:http://service.nso.go.th/nso/nsopublish/servopin/servop_internet.html. Thai
15. Synovate Young Asian. Survey of teens behaviours in asian region 2010 [Internet]. [cited 2013 Oct 27].Available from: http://www.tpa.or.th/industry/content.php?act=view&id=4683. Thai
16. Strasburger VC, Jordan AB, Donnerstein E. Health effects of media on children and adolescents.Pediatrics. 2010; 125(4):756-767. doi: http://dx.doi.org/10.1542/peds.2009-2563
17. Charnwit P, Sirichai H, Nutthotn P, et al. Parental suggestion on children and adolescents internet use [Internet]. Child and adolescent psychiatric society of Thailand [cited 2014 May 5]. Available from: http://www.healthygamer.net/sites/default/files/scribd/internet_edit_18-2-57.pdf. Thai
2014-02-14; accepted 2014-05-07)

Komsan Kiatrungrit obtained a Bachelor’s degree from the Faculty of Medicine of Mahidol University and completed his residency in Child and Adolescent Psychiatry at the Department of Psychiatry of the same university in 2012. He is currently a staff member in the department responsible for the training of medical students, psychiatry residents, and Masters of Science students. His main research interests are adult attention deficit and hyperactivity disorder (ADHD) and the use of information and communication technology by children and adolescents.
泰国曼谷中学生使用电子媒体的横断面研究
Komsan KIATRUNGRIT, Sirichai HONGSANGUANSRI
社交网络,电脑游戏,互联网,青少年,泰国
Background:There is increasing concern about the negative psychological effects of excessive use of various electronic media by adolescents but the monitoring of these behaviors in low- and middle-income countries has some methodological flaws.Aim:Assess the use of all types of electronic media among secondary school students in Bangkok, Thailand.Methods:A stratified random sample of students from four schools in Bangkok completed a modified version of a questionnaire used in a major study in the United States.Results:Among the 768 participants, 443 (57.7%) were female and 325 (42.3%) were male; their mean (sd)age was 15.4 (1.5) years. Almost all respondents had easy access to multiple types of electronic media; 94%had mobile phones, 77% had a television in their bedroom, and 47% had internet access in their bedroom.Over the prior day 39% had watched television shows or movies for more than 3 hours, 28% spent more than 3 hours on social networking sites, 25% listened to music for more than 3 hours, and 18% played computer games for more than 3 hours. Overall, 27% reported using electronic devices for more than 12 hours in the previous day. Only 19% reported parental rules about the use of electronic devices in the home that were regularly enforced. Time engaged in the various activities was not related to parental education or, with the exception of time playing computer games, to students’ grade point average. Younger students and male students spent less time than older students and female students using these devices to engage in interactive social activities (e.g., talking on the phone or social networking), while male students spent much more time than female students playing games on the devices.Conclusion:Adolescents spend a substantial part of every single day using different types of electronic devices. Longitudinal studies with precise time logs of device usage and descriptions of the type of content accessed are needed to determine the extent to which these activities have negative (or positive) effects on the social and psychological development of adolescents.
[Shanghai Arch Psychiatry. 2014;26(4): 216-226.
http://dx.doi.org/10.3969/j.issn.1002-0829.2014.04.005]
Department of Psychiatry, Ramathibodi Hospital, Mahidol University, Bangkok, Thailand
*correspondence: komsan.kei@gmail.com
A full-text Chinese translation will be available at www.saponline.org on September 25, 2014.
背景:有关青少年过度使用各种电子媒体所带来的负面心理影响已经引起越来越多的关注,但是在中低收入国家对这些行为的监测是非常薄弱的。目的:评估曼谷中学生使用各种类型电子媒体的情况。方法对来自曼谷4所学校的学生分层随机抽样,由受访者完成一份问卷调查表。该问卷在美国主要研究中使用,在本次研究中经过修订。结果768名受访者中,443名(57.7%)为女性,325名(42.3%)为男性。他们平均(SD)年龄为15.4(1.5)岁。几乎所有的受访者都可以方便地接触到各种类型的电子媒体,其中94%的人有手机,77%的人卧室中有电视, 47%的人可以在自己的卧室上网。调查前一天39%的人观看电视节目或电影超过3h,28%花在社交网站的时间大于3h,25%听音乐的时间超过3h,18%的人玩电脑游戏超过3h。总体而言,27%的人报告在前一天使用电子设备超过12h。只有19%的人报告父母对在家使用电子设备是有严格规定的。参与上述各种活动的时间与父母教育程度不相关。除了玩电脑游戏的时间与学生的平均成绩有相关性外,其他的电子媒体活动时间与平均成绩均不相关。在利用这些电子设备参与社交互动方面(如通过电话或社交网络聊天),低年级学生花的时间比高年级学生少,男生比女生少,而男生在这些设备上玩游戏的时间比女生多。
结论:青少年每天在各种类型的电子设备上化了大量的时间。需要一些纵向研究,精确记录电子设备使用的时间以及描述通过电子设备访问什么内容,以确定这些活动对青少年社会发展和心理发展产生负面(或正面)影响的程度。
本文全文中文版从2014年9月25日起在www.saponline.org可供免费阅览下载
猜你喜欢
杂志排行

上海精神医学的其它文章
- Advances in neuroimaging research of schizophrenia in China
- Advances in molecular genetic studies of attention deficit hyperactivity disorder in China
- Case-control resting-state fMRI study of brain functioning among adolescents with first-episode major depressive disorder
- Comorbidity of depressive and anxiety disorders:challenges in diagnosis and assessment
- Case report of narcolepsy in a six-year-old child initially misdiagnosed as atypical epilepsy
- Structural zeroes and zero-inflated models