Effects of Acrylamide Inhibition by Asparaginase and Sugar Substitution on Cookie Dough Rheology and Baking Attributes
2011-10-27MohamedABDELSHAFIABDELSAMIEHUANGWeiningLIZhenniOkkyungKimCHUNG
Mohamed ABDEL-SHAFI ABDEL-SAMIE,HUANG Wei-ning*,LI Zhen-ni,Okkyung Kim CHUNG
(State Key Laboratory of Food Science and Technology, Jiangnan University, Wuxi 214122, China)
Effects of Acrylamide Inhibition by Asparaginase and Sugar Substitution on Cookie Dough Rheology and Baking Attributes
Mohamed ABDEL-SHAFI ABDEL-SAMIE,HUANG Wei-ning*,LI Zhen-ni,Okkyung Kim CHUNG
(State Key Laboratory of Food Science and Technology, Jiangnan University, Wuxi 214122, China)
Acrylamide inhibition through reducing the acrylamide precursors including asparagine and reducing sugars, by the use of asparaginase and/or substituting some of the added sugar using stevioside were investigated for their effects on dynamic rheology, hardness of dough, and for baking and sensory properties of the prepared cookies. Using 1000 Asparaginase Unit (ASNU) reduced the asparagine contents 67% of the asparagine content of control sample (0.045 mg/g), and that could inhibit 95% of the formed acrylamide in the control sample without affecting the cookie quality attributes. Together with substituting sugars achieved more than 96% inhibition of acrylamide formed in the control sample (160.6). Dynamic rheological results showed that asparaginase did not have effects on G', G〃or tanδ, while sugar substitution increased G' and G〃 because of the development of gluten network in the cookie dough with the sugar substitution because of the absence of 15%, 30%, 45% and 60% of sugar. Substituting sugars altered some of the cookie quality attributes such as, increased moisture contents, less color development, less spread ratio, less breaking forces which was reflected to the lower acceptance for the panelists which did not accept the 45% and 60%, but substituting 15% or 30% sugar was accepted for the panelists.
acrylamide;asparaginase;sugar substitution;antioxidant
Discovery of acrylamide “the potentially carcinogenic for human”[1], by the University of Stockholm and Swedish National Food Authority at 2002, was the start of a series of acrylamide mitigation studies in different food products withdifferent composition and different critical control points. Acrylamide precursors represented in asparagine and reducing sugars through maillard reaction in a high temperature conditions over 120 ℃ were reported to be the main factors influencing the acrylamide yield in rich carbohydrate food[2-4]. Acrylamide may be also generated from asparagine alone through decarboxylation and deamination reactions but the main product of this reaction is maleimide. While in the presence of reducing sugars asparagine was able to generate acrylamide as a main product in the addition of maleimide[5].
As previously mentioned, asparagine is a limiting factor of acrylamide formation as it was proven to deliver the backbone of the acrylamide[2-3]. Thus, many acrylamide reduction strategies were based on controlling asparagine in the raw materials. Addition of other free amino acids or a protein-rich food component strongly reduced the acrylamide content, by competing effectively with the asparagine in maillard reaction or by reacting with the nucleophilic amino group of acrylamide[6-7]. Second effective method to reduce acrylamide in the raw materials is using asparaginase, an enzyme can selectively hydrolyzes asparagine to aspartic acid and ammonia, asparaginase is considered as a very effective method of reducing acrylamide formation in food products by removing one of the essential precursors of acrylamide asparagine from the raw materials. Asparaginase was tested in many food products, including semisweet biscuits, ginger biscuits, crisp bread, French fries, and sliced potato chips and it was found that, addition of asparaginase resulted in reduction of acrylamide content in the final products by 34%-92% of the acrylamide formed without applying asparaginase in dough-based applications. Enzyme dose, dough resting time, and water content were identified as critical parameters. Asparaginase was announced as the most effective way to eliminate the presence of asparagine as well as acrylamide formation in bakery products, and it does not affect other parameters such as browning[7-9].
Type and concentration of sugars showed a strong influence on acrylamide formation in cookies, but sucrose was less efficient than glucose on the yield of acrylamide, expectedly. On the other hand, increasing the amount of sucrose from 10 to 35 g in the recipe almost doubled the amount of acrylamide formed during baking[10]. The contents of asparagine in potatoes are higher and vary far less than the variation of reducing sugars, which explains why reducing sugars contents were strongly correlated with acrylamide contents in potatoes[11-12].
Sugar is one of the key ingredients of cookies and other baked desserts. It contributes to texture, flavor, sweetness and color in cookies. The quantity, granulation and type of sugar used influence the quality of biscuits[13]. High levels of sugar in cookies affects flavor, dimensions, color, hardness and surface finish. Sugar was reported to restrict the development of gluten during dough mixing by competing for water with the flour gluten. Sucrose is the main sugar utilized in the biscuit industry. However, today such high levels of sugar are undesirable[14]. High sugar concentration of cookies made it not suitable for some special categories of consumers such as diabetes and also made cookie not a safe food because of the high acrylamide contents found in cookies with high concentrations of sugars. Food experts usually recommend the reduction of sugar in cookie recipes as a method for production of a low-calorie cookie[15]. We thought sugar substitution will help us to produce low-calorie cookie and lower acrylamide concentrations. In 2004, it was estimated that 180 million adult Americans were consumers of low calorie, sugar-free foods and beverages. This increase in consumer demands have initiated a desire to lower the amount of metabolizeable sugars in food products, promoting a shift in consumer focus towards low and reduced calorie foods products containing sugar substitutes. From the perspective of consumers, the major concerns with these products are safety, the effect of sugar substitutes on organoleptic properties such as taste and flavor perception, and similarity of the textural properties, such as firmness and mouth feel, to traditional sugar-based products[16].
Stevioside is a natural sweetener, possess up to 250 times the sweetness intensity of sucrose, extracted from leaves of Stevia rebaudiana (Bertoni) Bertoni. Stevia, the occurrence of its sweeteners, their biosynthetic pathway and toxicological aspects were discussed and concluded to be noncariogenic and safe when used as a sweetener. It is suited for both diabetics, and Phenylketonuria patients, as well as for obese persons intending to lose weight by avoiding sugar supplements in the diet. No allergic reactions to it seem to exist[17-18]. Stevioside have been used to produce various products including cookies[19].
In the present study we aimed to evaluate the effects of asparaginase and sugar substitution using stevioside (as a sugar alternative), intentionally of acrylamide inhibition on sugar cookie quality including dough properties, dough dynamic rheology, cookie quality attributes and consumer acceptability, in a high antioxidant cookie system composed of standard formula with the addition of 10% of cumin and buckwheat for each based on flour weight (best addition levels according to our previous study) to enrich the antioxidant properties and as a supporting strategy for acrylamide reduction.
1 Materials and Methods
1.1 Materials and chemicals
Low gluten wheat flour 11.2% protein (Great Value, 123 Shaoxin Flour Milling Company, Guandong Province, China); buckwheat flour 10.69% protein (Tian Xiang Ye Tian, Xiangyetian Food Co. Ltd. Chifeng City, Inner Mongolia Province, China); cumin powder (Wuxi Teweikang Seasoning Co. Ltd.) and all other cookie production materials, including sugar, shortening, salt and baking soda, were obtained from the local markets of Wuxi city, Jiangsu province, China.
Asparaginase was purchased as Acrylaway 3500 BG (Acrylaway L, with an activity of 3500 ASNU/g) was obtained from Novozymes Company (Novozymes, Switzerland AG, Neumatt, 4243 Dittingen, Switzerland). Stevioside (purity>98%) was obtained from Tianjin Meilun Natural Plant Science and Technology Co. Ltd. (Tianjin, China).
Acrylamide (purity>99%), Folin Ciocalteau reagent (2N), ABTS, DPPH and 3,5, asparagine (purity>99%) , were purchased from Sigma Aldrich Company (Germany). Other chemicals including solvents and other chimicals were all of analytical grade and were purchased from Sinopharm Chemical Reagent Co. Ltd. (SCRC; China).
1.2 Methods
1.2.1 Protein contents
Protein contents of flour was determined as described in the AACC method 46-12[20]and was found to be 11.2%.
1.2.2 Cookie preparation
Cookies were prepared according to the method[20](American Association of Cereal Chemists, AACC 10-50D, 2002) with some modifications, cookies were enriched for its antioxidant values using Cumin powder and Buckwheat flour, 10% of each based on 100 g low-gluten wheat flour (according to our previous studies) and this formula was our control formula. Another modification is that, in the original method, a dextrose solution is being added to the recipe to aid the development the brown color, but in our case, as cumin powder has a brown color, the color of cookies did not need further additives to form a brown color, so water was substituted for the dextrose solution.
0, 15%, 30%, 45% and 60% of the added sucrose of the cookie formula was substituted using stevioside as a sweetener sugar alternative . Asparaginase in the Acrylaway form was also added in five levels 0, 250, 500, 750 ASNU/kg and 1000 ASNU/kg flour (Asparaginase Unit/kg flour). Asparaginase added dough samples were incubated at 45℃ for 15 minutes then cooled to inhibit the enzyme activity. That composed 25 different cookie samples, one control cookie without neither any sugar substitution nor asparaginase treatment , and 24 sugar substituted and/or asparaginase added cookie samples as shown in Table 1.

Table 1 Sugar substitutions and asparaginase treatment of cookie samples
Base cookie formula control sample was composed of (223.7 g flour, 22.4 g of cumin powder, 22.4 g of buckwheat flower, 64 g shortening, 130 g sugar, 2.1 g sodium chloride, 2.5 g sodium bicarbonate and 50.3 g water). Prepared dough was sheeted to a thickness of 7 mm and was cut using a 54 mm diameter circular die. Cookies were baked at 205 ℃ for 11 mins.
1.2.3 Dough characteristics
1.2.3.1 Asparagine contents of cookie dough
Asparagine contents of cookie dough samples were determined according to the method reported by Huang et al.[21]. 1 g of dough was treated by the addition of 5% trichloroacetic acid solution to make volume up to 25 mL in volumetric flask. Mixture was shaken vigorously for 2 h in a water bath and filtered through doubled filtration paper. 1 mL of the filtrate was transferred to 1.5 mL centrifuge tube. The filtrate was centrifuged for 10 min at 5000×g. The supernatant (1 mL) was transferred to clean tubes for further determinations of asparagine. For the liquid chromatography, 0.5 mL of the supernatant was injected into the Agilent liquid chromatography system (Agilent, Palo Alto, CA, USA) consisting of an Agilent 1100 quaternary pump and an UV detector set at 338 nm and 262 nm. The chromatographic separation was performed on a 5 μm Hypersil ODS column (250 mm × 4.6 mm) with a gradient mixture of acetonitrile (A) and 50 mmol/L aqueous acetate buffer (B) at a flow rate of 1.0 mL/min at 25 ℃.
1.2.3.2 Dynamic rheology properties
Dynamic rheology properties of cookie dough sample prepared using different sugar substitution levels and/or different asparaginase addition levels were tested using a controlled stress direct strain and controlled rate Rheometer (TA, AR-G2 Rheometer. New Castle, DE, USA). Oscillatory dynamic rheological measurement was performed, with a frequency sweep test at 40 ℃ with two serrated plates of a 40 mm diameter to prevent slippage during testing (plate to plate Geometry). Also, the edges of cookie dough samples were covered by the machine s cover to prevent the samples dehydration through moisture loss. G', G〃, and tanδ were measured over a frequency range of 0.01-20 Hz at 1.5% strain.
1.2.3.3 Dough hardness
Dough hardness of base formulated dough and sugar substituted and/or asparaginase added dough was measured using Texture Analyzer TA-XT2i (Stable Micro Systems Ltd., Surrey, UK). Force in compression mode was used under the following test conditions, 5 kg load cell, cylindrical probe (25 mm diameter), 2.0 mm/s pre- and post-test speeds, with a 1.0 mm/s test speed. Dough pieces were precisely centered and compressed 50% and the probe was held for 10 s at maximum compression. A positive peak value was taken as a measure for dough hardness[22].
1.2.4 Evaluation of quality attributes
1.2.4.1 Physical properties of different cookie samples
Physical properties of different cookie samples (base formula, sugar substituted and/or asparaginase added cookies) including thickness, diameter and spread ratio were measured according to the AACC method[20]. After 30 mins of removing the cookies from the oven, six cookies were laid edge-to-edge and measured for diameter using a scale, cookies were rotated 90°and re-measured for diameter again, average of the two measurements was taken and divided by 6 to get the diameter of the single cookie sample. Same number of cookies (6) was put on top of another and was measured using a caliper, then rearranged again and re-measured for thickness and average of the two values were taken and divided by 6 to get the thickness of a single cookie sample.
1.2.4.2 Moisture content of prepared cookies
Moisture content of prepared cookies (base formula control sample , sugar substituted and/or asparaginase added) was determined using an air oven according to the AACC method 44-15A[20], the one stage method was used because preexperiments showed that moisture contents of prepared cookies were less than 13%.
1.2.4.3 Cookie color of different formulas
Cookie color of different formulas (base formula, sugar substituted and/or asparaginase added) was determined according to the method of Abdel-Samie et al.[23], using a Chroma Meter CR-400 (Konica Minolta-Sensing, INC, Made in Japan). Color was determined as three values, L*, a* and b*.
1.2.4.4 Texture properties determined as breaking force of cookie samples
Texture properties determined as breaking force of cookie samples (base formula, sugar substituted and/or asparaginase added) were evaluated according to our previous study[23]. Three-point bend test was carried out using a Texture Analyzer (TATX2) Stable Microsystem, Surrey, Mono Research (5 kg Load Cell), to evaluate the peak breaking force (kg) of cookies using the “force-in-compression system”. Pre and post test speed were 2 mm/s, test speed was 1 mm/s.
1.2.4.5 Sensory-evaluation test
Sensory-evaluation test were held with the help of 25 panelists of different cultures and different countries (China, Egypt, Niger, Rwanda, Saudi Arabia, Sudan and Yemen) of 22-40 age range, who were asked to evaluate the prepared cookies for color, texture, flavor and over-all acceptability on a nine-point hedonic scale, according to the following scoring system: 1- dislike extremely; 5- neither like nor dislike; and 9- like extremely. Sensory evaluation of cookies provides a practical and rapid test of quality in the absence of direct methods to measure taste and aroma. The results obtained from the sensory-evaluation test enable the evaluation of food and help to judge consumer acceptance without following detailed chemical or microbiological methods.
1.2.5 Acrylamide determination
1 g of cookie samples powders (finely grounded using a laboratory blade mill to pass through a 1.0 mm screen) were defatted twice with 20 mL of n-hexane in a 50 mL centrifuge tubes with continuous shaking for 30 minutes each time. The n-hexane was removed and evaporated. Then defatted samples were extracted using 10 mL of methanol for each sample for 2 hours under vigorously shaking and 10 minutes in an ultrasonic bath after the first hour. Then, mixtures were centrifuged at 8000 r/min for 20 minutes at room temperature, and supernatant was removed for the clean-up. For the solid phase extract (SPE) cleanup, an Oasis HLB cartridge was preconditioned with 1 mL of methanol and 1 mL of water at a rate of two drops per second using a syringe. The extract was passed through the cartridge at a rate of one drop per second using a syringe. The five ten drops were discarded to prevent sample dilution.
Acrylamide determination was carried out using gas chromatograph/mass spectrometer (GC-MS) (TRACE DSQ, Thermo Scientific, Waltham, MA, USA). 2 L of the clear supernatant was injected and measured using a splitless injector heated to 150 ℃. The GC column was PEG-20M (30 m × 0.25 mm, 0.25μm). The column was held at 60 ℃ for 1 min, ramped at 12 ℃/min to 186 ℃, held for 6 min, ramped at 50 ℃ /min to 230 ℃, and held for 5 min. Detection was in selected ion monitoring mode, monitoring ions m/z 71 and m/z 55 were used to quantify acrylamide as described by Huang et al.[21].
1.3 Statistical analysis
SPSS (version 17.0) software was used to perform the statistical analysis. One way ANOVA (analysis of variance) was performed and significant differences was considered at the level of P<0.05. Duncan s multiple-range test was used to differentiate between the mean values. Standard deviation was also calculated and presented after the mean values.
2 Results and Discussions
2.1 Dough characteristics
2.1.1 Asparagine contents of the dough samples
Asparagine contents of the dough samples of basic formula control sample and with the sugar substitutions and/or asparaginase addition of different levels were as shown in Fig.1. From the figure, it is quite clear that sugar substitutions did not change the asparagine contents significantly (P≤0.05), While asparaginase addition significantly decreased asparagine contents from 0.135 mg/g in the control sample to 0.045 mg/g in sample (A5) which present a 67% reduction of the asparagine contents found in the control dough. That could be one of the main reasons of acrylamide reduction in the asparaginase added cookie samples. Asparagine contents in the sugar substituted dough were more than those of samples without any sugar substitutions, which could be referred to the absence of the sugar weight in the total dough weight which gives the flour (the main source of asparagine) more sharing in the total dough weight. But increasing of asparagine concentrations within the sugar substituted dough samples were not significant (P≤0.05), in control dough sample asparagine contents was 0.135 mg/g and it increased to 0.138, 0.139, 0.141 mg/g and 0.142 mg/g with substituting 15%, 30%, 45% and 60% of sugar respectively. Interactions between the two factors (sugar substitutions and asparaginase treatments) were significant and minimum score was when 0% of sugar was substituted and 1000 ASNU was added to the dough.
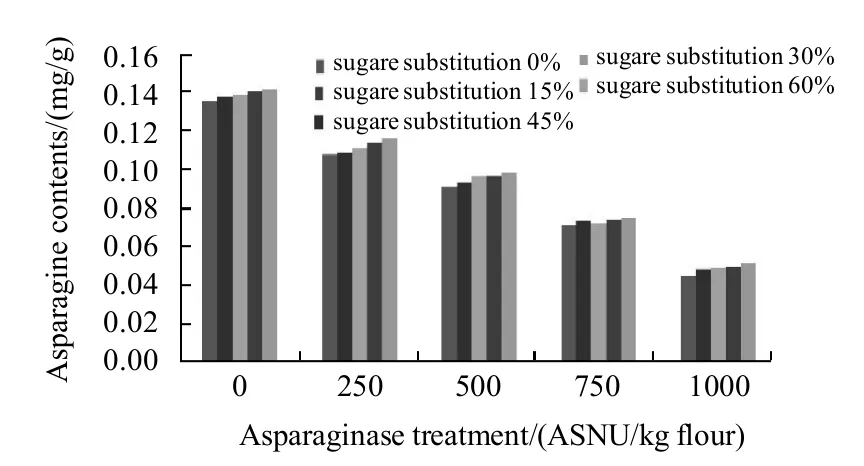
Fig.1 Effects of asparaginase additions and sugar substitutions on asparagine contents of dough
2.1.2 Dough rheological properties
The storage dynamic modulus (G') measures the energy stored in the raw material and recovered from it per cycle and represents the elastic nature of the material, while the loss modulus (G〃) is the measurement of the energy lost per cycle of sinusoidal deformation and represents the viscous nature of the material and the ratio of the energy lost to the energy stored for each cycle can be defined by tan δ which indicates the physical behavior of the system[24]. The rheological parameters including storage modulus (G'), loss modulus (G〃) and the ratio (tanδ or delta) of cookie dough samples prepared using different sugar substitution levels and enzyme additions were presented in Fig.2 A-C, all dynamic rheology experiments were performed at 40 ℃ which could clarify behavior of dough before gelatinization when subjected to a frequency ranging from 0.1 to 20 Hz, those results could be of a great importance when studying the applicability of dough on the industrial scope and let managers be able to study how much energy could be needed when formula is modified by substituting sugars and/or adding asparaginase of different levels. All samples got higher G'values comparing to G〃which indicates that they have more elastic properties than viscous properties. As could be noted in Fig.2 A–C, it is quite clear that substituting 15%, 30% of sugar using stevioside did not significantly change the G' and G〃 values, while decreasing sugar amount by substituting 45% or 60% of sugar allowed gluten to develop and use water of the formula instead of using it by sugar, gluten network developed more comparing to the control treatment. Gluten development caused a significant (P<0.05) increase in G' and G〃 which could be explained by the relatively increase of starch and protein (especially gluten) comparing to the total formula weight as a result of removing and substituting sugar using a high intense sweetener (stevioside) which was added in a very low amount which give flour and as well, starch and gluten higher relative weight comparing to the total weight of the formula. Those results were in agreement with the findings of Rogers et al.[25]who reported a decrease of both modules G' and G〃 when sugar was increased. Increased G' and G〃 is because of the relative water increase in the formula. Results also showed that tan δ showed positive dependency on frequency which indicates that, dough acts more like as a liquid under high frequencies at such temperature (40 ℃), but no significant differences of tan δ was observed with the application of sugar substitution of different levels. Asparaginase addition of different levels did not show any kind of differences on dynamic rheological properties.
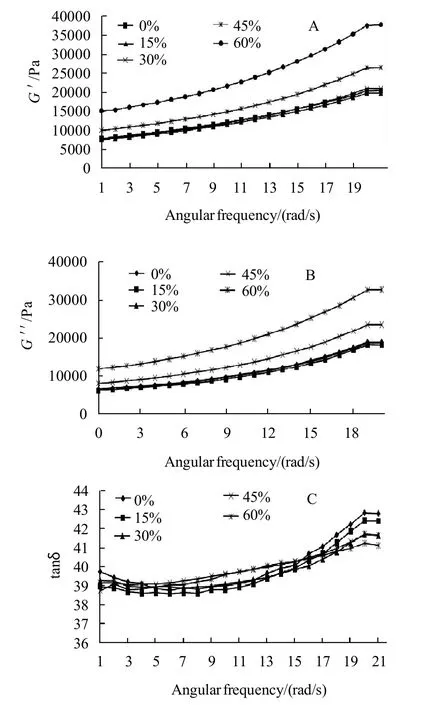
Fig.2 Dynamic rheological properties of cookie dough samples prepared using different sugar substitutions percentages
2.1.3 Dough hardness
Dough hardness values are shown in Fig.3. Decreasing sugar amount by increasing the substitution percentage from 0% to 15%, 30%, 45% and 60% increased dough hardness values significantly (P<0.05) when determined using the texture analyzer with a measure of force in compression mode. Keeping the probe on a 50% of the cookie dough piece thickness for 10 seconds, then positive peak force was taken to state the dough hardness. Dough hardness with 0% of sugars substitution was the minimal hardness among the other samples with a score of 0.95 kg, while different asparaginase addition levels did not have any significant (P<0.05) effects on the dough hardness, as it was the same score (0.95 kg) for all levels of asparaginase addition. On the other hand dough hardness values of cookies prepared using increasing substitution level of sugar were significantly (P<0.05) higher than that of control, substituting 15%, 30%, 45% and 60% of sugar with stevioside increased dough hardness to 1.13, 1.29, 1.41 kg and 1.61 kg respectively. Higher dough hardness results were with agreement with dynamic rheological properties of cookie dough samples. And reason was the same, dough hardness was increased because of the development of gluten gradually with the sugar addition decreasing with the substituting of it with stevioside, and that gave the gluten the chance to compete for the water and use it to build the gluten network more and more comparing to control treatment.
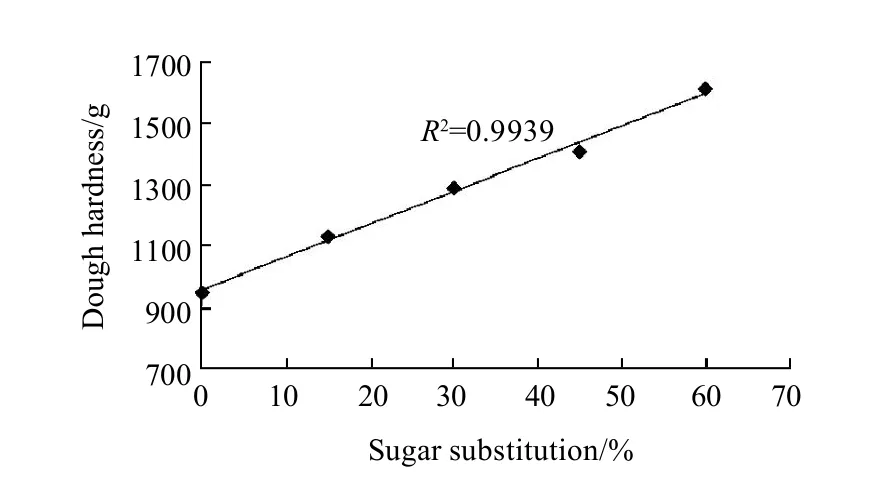
Fig.3 Linear relationship between dough hardness and sugar substitution percentages
2.2 Cookie quality attributes
2.2.1 Moisture contents of cookie samples
Moisture contents of cookie samples determined as percentages were presented in Table 2, 3. Data shows that, asparaginase treatment did not have significant effects (P<0.05) on the moisture contents of cookie samples. On the other hand, sugar substitution significantly (P<0.05) increased the moisture percentages, substitution of 60% of sugar using stevioside increased the moisture contents from 6.13% in the control treatment to 10.56%. Interaction results between the two factors (sugar substitution and asparaginase addition) also gave significant effects on the moisture results, minimum score was that of control treatment (no sugar substitution nor asparaginase treatment), without any significant differences with other asparaginase treatments of the same level of sugar substitution 0% . Highest moisture content was scored with 60% substitution of sugar with 1000 ASNU, without significant differences with other asparaginase treated cookie samples of the same sugar substitution levels. Increasing levels of moisture contents in the higher levels of sugar substitution might be referred to the lower concentration of sugars which give more chance for wheat gluten to develop and use more water and keep it in the dough and deliver it to the end product. That was with agreement of Gallagher et al.[14]who reported that, high levels of sugar in cookies was reported to restrict the development of gluten during dough mixing by competing for water with the flour gluten. Higher moisture contents of cookie samples prepared with the stevioside as a sugar alternative could also be a reason of the lower hardness of cookies. And also could be a reason for the low texture scores when sugar substituted cookies was evaluated by panelists.
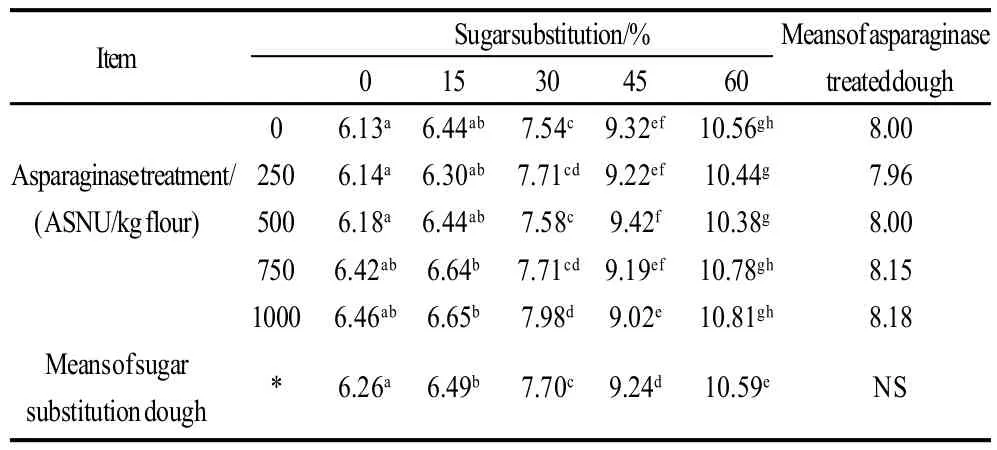
Table 2 Moisture contents of cookie samples and effects of sugar substitutions and/or asparaginase addition of different levels
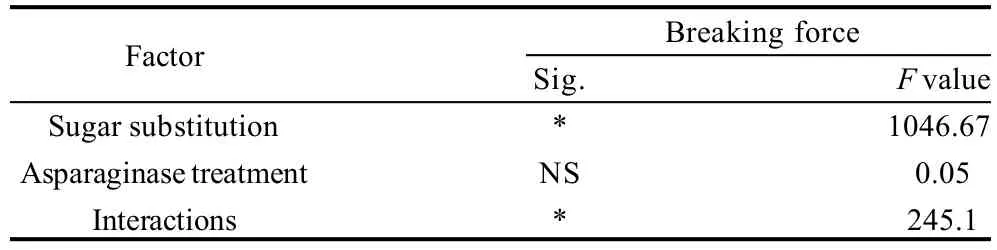
Table 3 Statistical analysis data of the effects of every factor alone and the interaction between the two factors on moisture content of cookies
2.2.2 Breaking forces of different cookie samples
Breaking forces of different cookie samples prepared with sugar substitution of different levels and or different levels of asparaginase addition were presented in Table 4, 5. Data showed correlated results with dough hardness and moisture contents of cookie samples. As a result of containing more moisture contents in the cookie samples, breaking forces decreased gradually with more moisture accompanying more sugar substitution which were also noted by the panelists who reported gradual decrease of crispiness in cookie samples with gradual decrease of sugar. Control sample breaking force was the maximal with a 5.17 kg breaking force. increasing the percentage of sugar substitution caused a gradual decrease of breaking force to reach lowest value with 45% of sugar substitution, but after this level breaking force was increased again with the 60% of sugar substituted, may be because of the development of gluten in this sample was the most comparing to other samples but still crispiness of sample was minimal comparing to other samples which was noted by most of the panelists. Asparaginase treatment was not an effective factor on breaking forces.
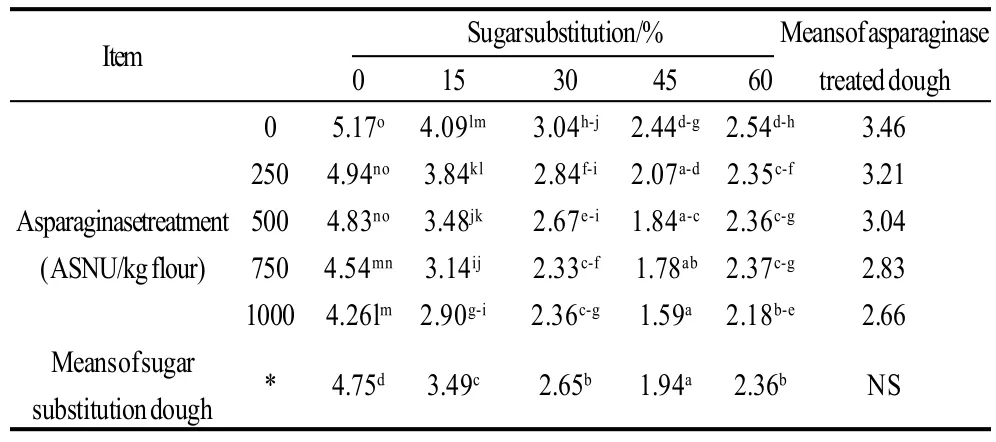
Table 4 Breaking forces of cookie samples prepared using different sugar substitutions and different asparaginase treatments

Table 5 Statistical analysis data of the effects of every factor alone and the interaction between the two factors on breaking forces of cookies
2.2.3 Cookie color
Cookie color determined as L*, a* and b* values is presented in Table 6, 7. Data presented that, asparaginase addition of different levels did not posses significant (P<0.05) effects on the color values of the prepared cookies. On the other hand, gradual increase of the sugar substitutions percentages from 0% to 15%, 30%, 45% up to 60% of the original amount of sucrose added to the cookie formula gradually increased L* values and decreased a* and b* vlaues. Cookie samples prepared by substitution 60% of sucrose had the maximal L* value and the minimal a* and b* values. Interactions between the sugar substitution and asparaginase addition color scores were significant (P<0.05), gradual increase of L* values and gradual decrease of a* and b* values were observed with significant differences (P <0.05). L* increased from 55.6 in control treatment to reach the maximal value (62.2) in cookie sample prepared by substituting 60% of sucrose with 1000 ASNU/kg addition, a* values decreased gradually from 9.25 in the control sample to reach the minimal value (4.96) in the 60% substituted sugar and an addition of 1000 ASNU/kg flour. Same trends of a* values were obtained in b* values, when control sample obtained the maximal b* score (35.6), while the 60% substituted sugar and 1000 ASNU addition sample obtained the minimal b* score (34.5). Increased L* (lightness), decreased a* (redness) and decreased b* (yellowness) values clearly indicate the absence of the brown color of cookies, which is because of the inhibition of maillard reaction caused by the absence of sugar which is the main compound of the maillard reaction. Cookies prepared with more substituted sugar than 45% had a pail color more lightness and less red less yellow while desired golden brown color of cookie samples has not been well developed because of the absence of maillard reactions main compounds (sugar) which gave the cookie non-acceptable color for the consumer.

Table 6 Physical properties (including color values (L* a* and b*) and diameter, thickness and spread ratios) of cookie samples, prepared with different sugar substitution levels and or asparaginase of different addition levels
2.2.4 Physical properties of different cookie samples
Diameter, thickness and spread ratios of prepared cookies of different sugar substitutions and/or asparagine additions are presented in Table 6. From the date presented in the Table 6, it could be noticed that, asparaginase did not significantly change the diameter, thickness and as a result it did not change spread ratios of prepared cookies significantly (P<0.05), while sugar substitution had a highly significant (P<0.05) effects on the spread properties of cookies as a results of decreased diameter and increased thickness of cookies prepared with a sugar substitution. Control cookie sample had a diameter of 7.03 cm which is the biggest diameter among all prepared cookies without significant differences (P<0.05) with those cookies prepared with the different levels of asparaginase addition within the 0% of sugar substitution, and a thickness of 1.09 cm which is the smallest thickness among all prepared cookies, without significant differences with those cookie samples prepared with different levels of asparaginase addition. Cookie samples prepared with stevioside as a sugar substitution were less in diameter more in thickness than control sample. Diameter of cookie samples prepared by substituting 15%, 30%, 45% and 60% of sugar substitution decreased to 6.78, 6.32, 6.01 cm and 5.64 cm respectively. 60% substituted sugar cookie sample diameter was 80% of the control sample cookie diameter which means that applying 60% of sugar substitution decreased 20% of the base formula cookie. On the other hand thickness as a result increased to 1.17, 1.38, 1.49 mm and 1.63 mm for those samples with 15%, 30%, 45% and 60% of sugar substitution, maximal thickness was that of samples with 60% of sugar substitution. Spread ratios of samples with sugar substitution were less than spread of control sample with minimal spread ratio scored by those samples of 60% of substituted sugar. Spread ratio of control sample was 6.44 and decreased gradually to be 5.81, 4.59, 4.03 and 3.47 in 15%, 30%, 45% and 60% sugar substituted cookie samples respectively. Reason for such trends of cookie less spread ratios were referred to the same reason of the dough hardness trends, the relatively higher gluten development of those samples with less sugar, which give the cookie samples more gluten network development to hold up the structure of the cookie and prevent spread. This reasoning and causation are supported by Gallagher et al.[14]who noted that sugar is restricting the development of gluten develop-ment by competing with it for the water of the formula. Then the absence of 15%, 30%, 45% and 60% of sugar could gradually let the gluten use the water and develop more and more comparing to the control sample which contains the maximum sugar with 0% of sugar substitution.
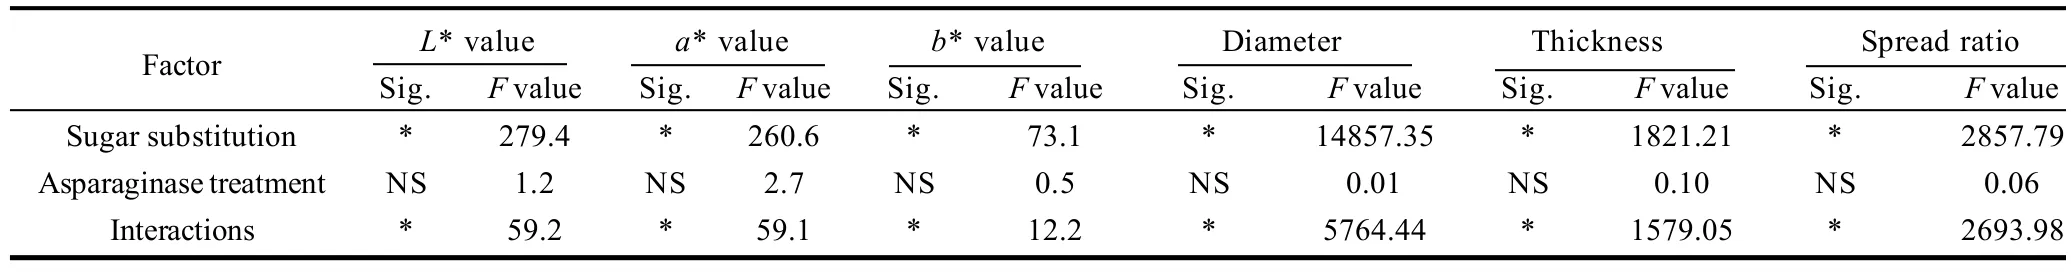
Table 7 Statistical analysis data of the effects of every factor alone and the interaction between the two factors on physical properties of cookies
2.2.5 Sensory evaluation
Sensory evaluation scores of cookie samples prepared with the sugar substitution and/or asparaginase treatment are summarized in Table 8, 9. Results of sensory evaluation test revealed that, asparaginase addition did not alter the sensory evaluation scores significantly (P<0.05) neither of color, texture, flavor nor of over-all acceptability which make asparaginase an effective way to inhibit acrylamide formation in cookies, while no significant decreasing of the consumer s acceptance were caused. On contrary, judges assigned lower scores for cookie samples prepared with the substitution of sugar using stevioside, decreased scores of sensory parameters were gradual with the gradual increase of the sugar substitution level (0% to 15%, 30%, 45% and 60%). All scores were similar for color, texture, flavor and overall acceptability. cookie samples with substituting 15% or 30% of sugar using stevioside were accepted for panelists with a score higher than 6 for all parameters, while more than 30% of sugar substitution level (45% and 60%) were not accepted for panelists, as cookie were less crispness and texture was not as good as control. Color scores of sugar substituted cookie samples could be related to color determination using Minolta hunter lab, and was noted by the panelists to be lighter and less brown (less yellow less red) than control cookie sample. Texture also was in agreement with the breaking force of cookies of the TA machine, and was noted to be less crispy and chewing were higher and easy breakable.
Cookie samples with 45% of sugar substitution were neither liked nor disliked for all parameters (color, texture, flavor and over-all acceptability), that is why we concluded that, 60% of sugar substitution could not be accepted for consumers and maximal sugar substitution level should be 45% to be accepted for consumers. As our aim of study was to give safer cookies with inhibited acrylamide, but also to maintain the cookie quality attributes and keep it accepted for consumers.
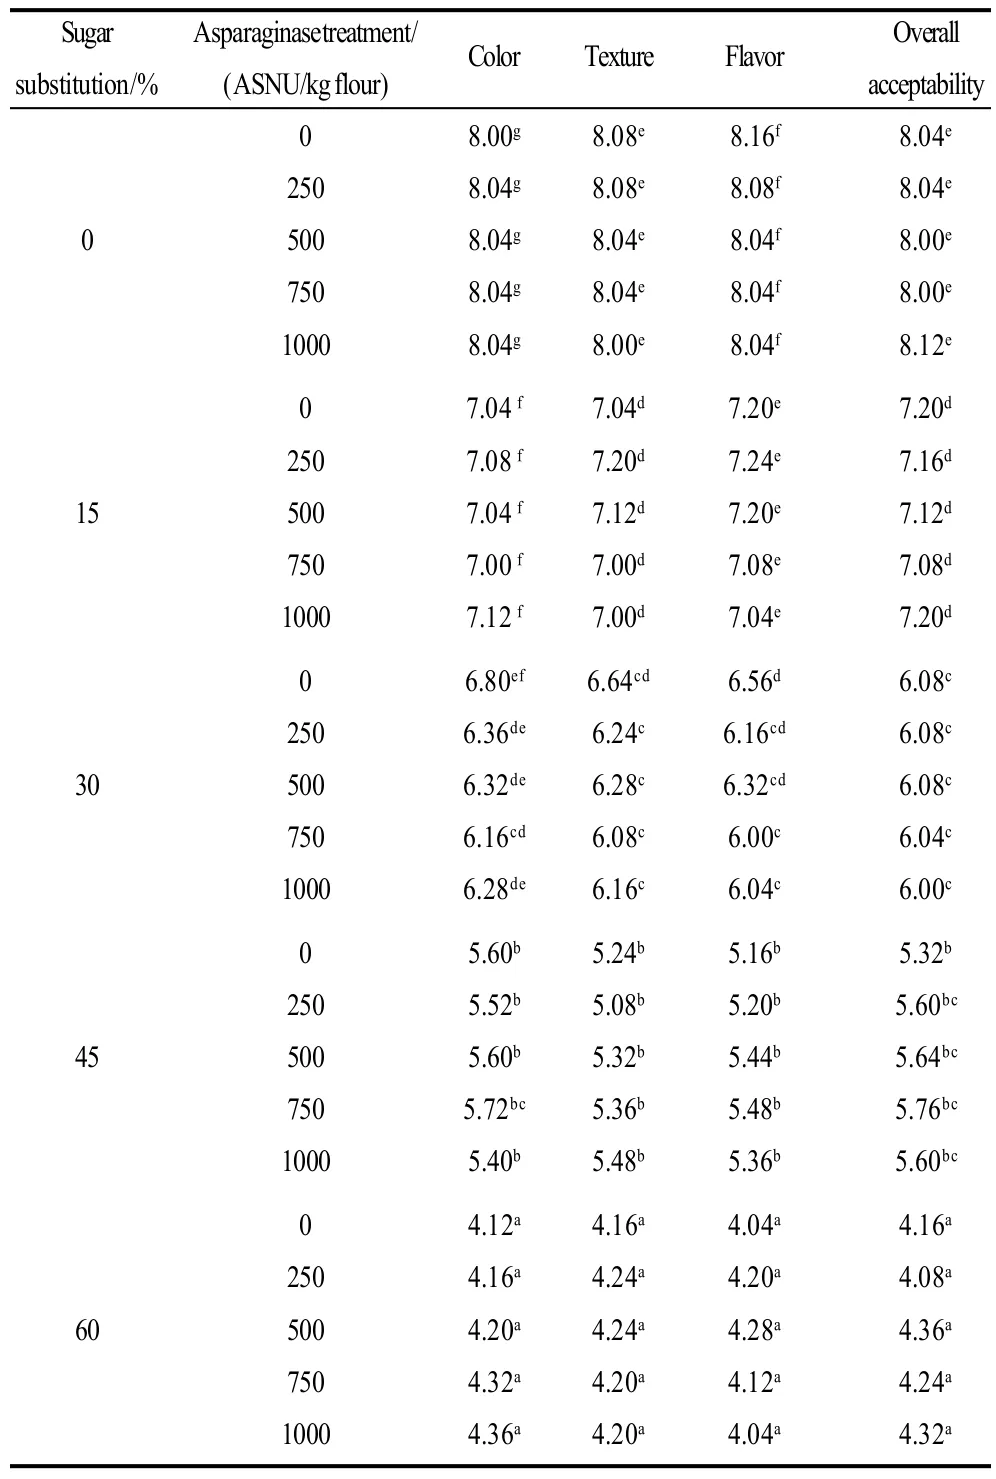
Table 8 Sensory evaluation scores of cookie samples prepared with the sugar substitution and/or asparaginase treatment
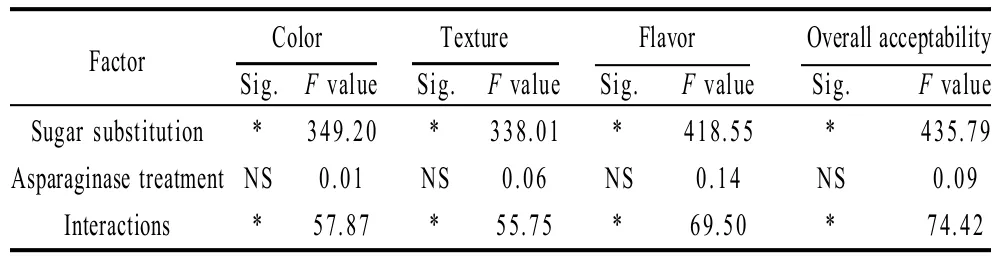
Table 9 Statistical analysis data of the effects of every factor alone and the interaction between the two factors on sensory scores of cookies
2.3 Acrylamide concentrations of cookie samples

Table 10 Acrylamide concentrations of cookie samples prepared with the sugar substitution and/or asparaginase treatment
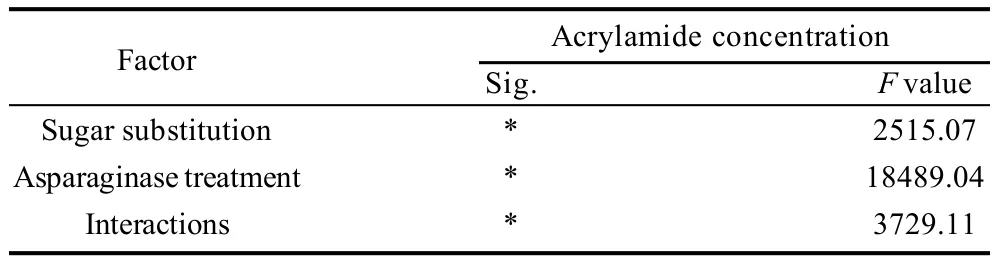
Table 11 Statistical analysis data of the effects of every factor alone and the interaction between the two factors on acrylamide content of cookies
Acrylamide concentrations of cookie samples with the different inhibition strategies including asparaginase addition and/or sugar substitution of different levels were as shown in Table 10,11. Data showed that both strategies were effective for the inhibition of acrylamide formation in the end product presented in prepared cookies. Asparaginase was the most effective strategy for the inhibition of acrylamide as 250, 500, 740 ASNU/kg and 1000 ASNU/kg reduced 56%, 75%, 83% and 94% respectively of the acrylamide formed in the control cookie sample which was 160.62 g/kg. F value presenting the relationship between acrylamide concentrations and asparaginase additions was the highest (18489.04) comparing to 2515.07 which presenting the effect strength between sugar substitution and acrylamide concentration, that could clearly indicates that asparaginase could be more effective than sugar substitution as an acrylamide inhibition strategy. But sugar substitution is still highly effective to reduce acrylamide by 22%, 33%, 49% and 56% respectively with the substitution of 15%, 30%, 45% and 60% of sugar using stevioside, which could also be considered as a good strategy for the acrylamide inhibition. Interaction between the two factors on the acrylamide concentrations showed significant differences, highest acrylamide inhibition percentages were achieved by treatments D5and E5(presenting the addition of 1000 ASNU/kg with both 45% and 60% of sugar substitution) which achieved an acrylamide inhibition percentage more than 96% as the acrylamide concentrations were rare and non-detectable for the gas chromatography equipment. 45% and 60% of sugar substitution were unpalatable for consumers presented in sensory evaluation panelists, so we recommend the samples B5and C5(the addition of 1000 combined with the substitution of 15% and 30% of sugar for stevioside) without any significant differences (P<0.05) between them. Samples B5and C5had a good appearance, texture, flavor and over-all acceptability for the panelists and achieved a high acrylamide inhibition percentage. Acrylamide inhibition was because of the removal of asparagine and reducing sugars from the cookie dough by the usage of asparaginase and substituting sugars using an alternative sweetener presented in stevioside, reducing asparagine and reducing sugars in the formula which are the main precursors of acrylamide was a successful way to reduce acrylamide significantly(P<0.05).
3 Conclusions
Asparaginase and sugar substitution were two of the successful strategies to inhibit acrylamide formation in our high antioxidant cookie system, which could be a new concept of high nutritional value safe products which is lower in acrylamide as it achieved low acrylamide contents of less than 6μg/kg which make cookie a good product for marketing as high antioxidant low acrylamide product. We stated effects of those strategies on the dynamic rheology and cookie quality attributes and also for the consumer acceptability, sugar substitutes was accepted as it does not go more than 30% of substitution, and asparaginase did not alter any of the dough or end product quality, that is why we consider it as the best strategy to inhibit acrylamide formation in cookies.
[1]TAREKE E, RYDBERG P, KARLSSON P, et al. Acrylamide: a cooking carcinogen[J]. Chemical Research in Toxicology, 2000, 13: 517-522.
[2]ZYZAK D V, SANDERS R A, STOJANOVIC M, et al. Acrylamide formation mechanism in heated foods[J]. Journal of Agricultural and Food Chemistry, 2003, 51: 4782-4787.
[3]MUSTAFA A, FINK M, KAMAL-ELDIN A, et al. Interaction effects of fermentation time and added asparagine and glycine on acrylamide content in yeast-leavened bread[J]. Food Chemistry, 2009, 112: 767-774.
[4]BECALSKI A, LAU B P Y, LEWIS D, et al. Acrylamide in foods: occurrence, sources, and modeling[J]. Journal of Agricultural and Food Chemistry, 2002, 51: 802-808.
[5]YAYLAYAN V A, WNOROWSKI A, PEREZ L C. Why asparagine needs carbohydrates to generate acrylamide[J]. Journal of Agricultural and Food Chemistry, 2003, 51: 1753-1757.
[6]RYDBERG P, ERIKSSON S, TAREKE E, et al. Investigations of factors that influence the acrylamide content of heated foodstuffs[J]. Journal of Agricultural and Food Chemistry, 2003, 51: 7012-7018.
[7]CAPUANO E, FERRIGNO A, ACAMPA I, et al. Effect of flour type on Maillard reaction and acrylamide formation during toasting of bread crisp model systems and mitigation strategies[J]. Food Research International, 2009, 42: 1295-1302.
[8]HENDRIKSEN H V, KORNBRUST B A, STERGAARD P R, et al. Evaluating the potential for enzymatic acrylamide mitigation in a range of food products using an asparaginase from aspergillus oryzae[J]. Journal of Agricultural and Food Chemistry, 2009, 57: 4168-4176.
[9]ANESE M, QUARTA B, FRIAS J. Modelling the effect of asparaginase in reducing acrylamide formation in biscuits[J]. Food Chemistry, 2011, 126: 435-440.
[11]AMREIN T M, BACHMANN S, NOTI A, et al. Potential of acrylamide formation, sugars, and free asparagine in potatoes: a comparison of cultivars and farming systems[J]. Journal of Agricultural and Food Chemistry, 2003, 51: 5556-5560.
[12]AMREIN T M, SCHNB B, ROHNER F, et al. Potential for acrylamide formation in potatoes: data from the 2003 harvest[J]. European Food Research and Technology, 2004, 219: 572-578.
[13]SMITH W H. Biscuits, crackers and cookies[M]. London, UK: Applied Science, 1972: 80-81.
[14]GALLAGHER E, O'BRIEN C M, SCANNELL A G M, et al. Evaluation of sugar replacers in short dough biscuit production[J]. Journal of Food Engineering, 2003, 56: 261-263.
[15]DREWNOWSKI A, NORDENSTEN K, DWYER J. Replacing sugar and fat in cookies: impact on product quality and preference[J]. Food Quality and Preference, 1998, 9: 13-20.
[16]KROGER M, MEISTER K, KAVA R. Low-calorie sweeteners and other sugar substitutes: a review of the safety issues[J]. Comprehensive Reviews in Food Science and Food Safety, 2006, 5: 35-47.
[17]GEUNS J M C. Stevioside[J]. Phytochemistry, 2003, 64: 913-921.
[18]GARDANA C, SIMONETTI P, CANZI E, et al. Metabolism of stevioside and rebaudioside a from Stevia rebaudiana extracts by human microflora [J]. Journal of Agricultural and Food Chemistry, 2003, 51: 6618-6622.
[19]GOYAL S K, SAMSHER, GOYAL R K. Stevia (Stevia rebaudiana) a bio-sweetener: a review[J]. International Journal of Food Sciences and Nutrition, 2009, 61: 1-10.
[20]AACC. Approved Methods of Snalysis, Methods 10-50D, 44-15 and 46-12[S]. St Paul, MN, 2002.
[21]HUANG Weining, YU Shengdi, ZOU Qibo, et al. Effects of frying conditions and yeast fermentation on the acrylamide content in you-tiao, a traditional Chinese, fried, twisted dough-roll[J]. Food Research International, 2008, 41: 918-923.
[22]PAREYT B, WILDERJANS E, GOESAERT H, et al. The role of gluten in a sugar-snap cookie system: A model approach based on glutenstarch blends[J]. Journal of Cereal Science, 2008, 48: 863-869.
[23]ABDEL-SAMIE M A S, WAN J J, HUANG W N, et al. effects of cumin and ginger as antioxidants on dough mixing properties and cookie quality[J]. Cereal Chemistry, 2010, 87: 454-460.
[24]SINGH J, SINGH N, SHARMA T R, et al. Physicochemical, rheological and cookie making properties of corn and potato flours[J]. Food Chemistry, 2003, 83: 387-393.
[25]ROGERS M A, ROOS Y H, GOOF H D. Structural heterogeneity and its effect on the glass transition in sucrose solutions containing protein and polysaccharide[J]. Food Hydrocolloids, 2006, 20: 774-779.
丙烯酰胺抑制剂对曲奇面团流变学和烘焙特性的影响
Mohamed ABDEL-SHAFI ABDEL-SAMIE,黄卫宁*,李珍妮,Okkyung Kim CHUNG
(江南大学 食品科学与技术国家重点实验室,江苏 无锡 214122)
通过引入天冬酰胺酶和/或甜菊苷到曲奇配方中替代部分糖以抑制其生产过程中丙烯酰胺的生成,分析单独或同时添加这两种配料时曲奇面团的动态流变学特性、硬度和曲奇饼干的烘焙感官特性。结果表明:当单独添加天冬酰胺酶(1000 ASNU)时可降低曲奇样品中天冬酰胺含量(0.045mg/g)的67%,从而抑制95%丙烯酰胺的生成,且不会影响曲奇产品的烘焙特性。而天冬酰胺酶和甜菊苷同时添加时可抑制样品中96%丙烯酰胺的生成。动态流变学结果表明:引入天冬酰胺酶不会影响曲奇面团的流变学性质,而甜菊苷的加入会增加面团的弹性模量G'和黏性模量G〃,这是因为甜菊苷替代面团中糖成分后促进曲奇面团面筋网络的形成。但是,部分糖被取代后会改变曲奇的一些烘焙特性,如:水分含量增加,曲奇饼干颜色变淡,延展率和破碎力降低。感官分析结果表明:感官评定者不能接受45%和60%糖取代量的曲奇,但可以接受15%或30%糖取代量的曲奇。
丙烯酰胺;天冬酰胺酶;取代糖;抗氧化剂
TS213.2
A
1002-6630(2011)05-0157-11
2010-12-20
美国农业部国际合作项目[A-(86269)];加拿大农业部国际交流与合作项目(CCSIC-Food-00107);国家“863”计划项目(2007AA100401);国家自然科学基金项目(20576046)
Mohamed Abdel-Shafi Abdel-Samie(1982—),男,博士研究生,研究方向为烘焙科学、功能配料和食品添加剂。E-mail:mampowered@yahoo.com
*通信作者:黄卫宁(1963—),男,教授,博士,研究方向为食品烘焙与发酵技术、谷物食品化学。E-mail:wnhuang@jiangnan.edu.cn
