Cryptic diversity and rampant hybridization in annual gentians on the Qinghai-Tibet Plateau revealed by population genomic analysis
2024-04-12PengChengFuQioQioGuoDiChngQingBoGoShnShnSun
Peng-Cheng Fu ,Qio-Qio Guo ,Di Chng ,Qing-Bo Go ,Shn-Shn Sun
a School of Life Science,Luoyang Normal University,Luoyang 471934,PR China
b Key Laboratory of Adaptation and Evolution of Plateau Biota,Northwest Institute of Plateau Biology,Chinese Academy of Sciences,Xining 810001,PR China
Keywords: Gentiana aristata Hybrid zone Qinghai-Tibet Plateau Plastome Nuclear SNPs
ABSTRACT Understanding the evolutionary and ecological processes involved in population differentiation and speciation provides critical insights into biodiversity formation.In this study,we employed 29,865 single nucleotide polymorphisms (SNPs) and complete plastomes to examine genomic divergence and hybridization in Gentiana aristata,which is endemic to the Qinghai-Tibet Plateau (QTP) region.Genetic clustering revealed that G.aristata is characterized by geographic genetic structures with five clusters(West,East,Central,South and North).The West cluster has a specific morphological character(i.e.,blue corolla) and higher values of FST compared to the remaining clusters,likely the result of the geological barrier formed by the Yangtze River.The West cluster diverged from the other clusters in the Early Pliocene;these remaining clusters diverged from one another in the Early Quaternary.Phylogenetic reconstructions based on SNPs and plastid data revealed substantial cyto-nuclear conflicts.Genetic clustering and D-statistics demonstrated rampant hybridization between the Central and North clusters,along the Bayankala Mountains,which form the geological barrier between the Central and North clusters.Species distribution modeling demonstrated the range of G.aristata expanded since the Last Interglacial period.Our findings provide genetic and morphological evidence of cryptic diversity in G.aristata,and identified rampant hybridization between genetic clusters along a geological barrier.These findings suggest that geological barriers and climatic fluctuations have an important role in triggering diversification as well as hybridization,indicating that cryptic diversity and hybridization are essential factors in biodiversity formation within the QTP region.
1.Introduction
The major mountain systems of the world are remarkably rich in species diversity (Antonelli et al.,2018),with alpine species being especially noteworthy.Alpine floras have been profoundly impacted by recurrent cycles of historical climatic change (Ding et al.,2020) and continue to be affected by current climate warming trends (Elsen and Tingley,2015;Liang et al.,2018).These climatic oscillations have potentially caused isolation and reconnection between adjacent populations,with the resultant range fragmentation,range shifts,secondary contacts,and hybridization accelerating speciation events (Muellner-Riehl et al.,2019;Kirschner et al.,2020).Frequent geographical isolation and increased levels of environmental heterogeneity may accelerate the diversity of cryptic species,which might either be a consequence ofin situspeciation or colonization by lowland taxa followed by allopatric divergence (Struck et al.,2018).Although relevant to all mountain systems of the world,research has been principally focused on a few mountainous model regions,such as the Qinghai-Tibet Plateau(QTP) region.
The QTP region,including the Tibetan Plateau,Hengduan Mountains (HM),and the Himalayas (according to the geological definition by Liu et al.(2022)),comprises two global hotspots of biodiversity(Myers et al.,2000;Marchese,2015).It is an ideal area for evaluating the spatial-temporal evolution of alpine communities as well as the factors that contribute to diversification and speciation.This region harbors a rich flora with a high proportion of endemic species and is characterized by a high rate ofin situspeciation(Xing and Ree,2017;Ding et al.,2020).For instance,the HM hosts particularly rich alpine flora comprising a diverse mosaic of floristic elements(Li et al.,2021).The QTP region,particularly the HM,is characterized by distinct geographic barriers and frequent climatic fluctuations (Favre et al.,2015;Sun et al.,2017),which subdivides distribution ranges and generates fine-scale environmental heterogeneity,therefore,stimulating divergence and speciation (Sun et al.,2017;Muellner-Riehl,2019).
Besides geological barriers and climatic changes,biological processes,such as hybridization,have been essential in driving species formation and biodiversity assembly (Abbott et al.,2013;van Wyk et al.,2017).Hybrid speciation has been detected in substantial plant lineages around the world (Mallet,2007;Rieseberg and Willis,2007;Schumer et al.,2014),and dynamic hybrid zones are frequently observed in various lineages worldwide (Abbott et al.,2017).The major impact of global climate change on the dynamics and distribution of biodiversity presents an unprecedented opportunity to study hybridization,enabling us to peer into the birth and death of evolutionary lineages (Vallejo-Marín and Hiscock,2016).In the QTP region,natural hybrids have been documented in almost all species-rich plant genera,and gene flow has been widely detected during the speciation processes of all taxonomic groups examined(Wu et al.,2022).This region has been suggested to be a site of dynamic flora as numerous species are presently becoming reproductively isolated (Wu et al.,2022).For example,hybridization and young speciation are frequently observed among not only speciose alpine herbs or shrubs,includingGentiana(Fu et al.,2020,2022a),Saxifraga(Ebersbach et al.,2020)andRhododendron(Zheng et al.,2021;Ma et al.,2022),but also woody species such asPterocarya(Wang et al.,2023),Populus(Li et al.,2023) andBetula(Nocchi et al.,2023).
Gentiana(Gentianaceae)is an alpine genus with a global range.The QTP region serves as both the center of biodiversity for approximately 360Gentianaspecies (Ho and Liu,2001) and the primary source for colonization of other regions(Favre et al.,2016).As observed in the majority of plant lineages,abiotic factors,including geological processes,geographical isolation,and climatic changes,are correlated with diversification and speciation in several lineages ofGentiana(Zhang et al.,2009;Favre et al.,2016;Fu et al.,2018,2020,2022b;Sun et al.,2022).In addition,according to growing evidence from phylogenetic and population genetic studies,hybridization is frequently observed inGentiana,both in the QTP region (Chen et al.,2021;Fu et al.,2021a,2022a) and Europe (Favre et al.,2021).InGentiana,sectionChondrophyllaeBunge sensu lato(s.l.)is the only section that is globally distributed,which has 182 species and accounts for 51.7%of allGentianaspecies(Ho and Liu,2001;Favre et al.,2020).This section has experienced rapid evolution (Yuan and Küpfer,1997) and presented extremely long branches in the phylogenetic trees (Favre et al.,2020;Chen et al.,2021;Fu et al.,2021b,2022c).However,the reasons underlying the rich diversity in this section are yet unclear.Additionally,sectionChondrophyllaes.l.is a well-supported monophyletic group,but the intra-sectional relationship is ambiguous as a result of rich cyto-nuclear conflicts(Chen et al.,2021;Fu et al.,2022c).Therefore,hybridization is assumed to be rampant in this section and has been essential in the assembly of biodiversity,although there is little direct evidence.
In this study,we focused on an annual gentian speciesGentiana aristataMaxim.inG.sectionChondrophyllas.l.G.aristatais endemic to the eastern QTP and occurs over a large range from the Qilian Mountains to the Hengduan Mountains (Ho and Pringle,1995).It varies in morphological characteristics,for example,having purplish red or blue in the corolla (Ho and Liu,2001).It possesses 12-15 mm corolla,with pollinators including bumblebees,flies and ants(personal observation).We used genomic data to examine the fine-scale phylogeographic structures and evolutionary history of the species.Specifically,we asked(i)whether geographical features in the QTP region have acted as barriers to gene flow,leading to discrete genetic structures and the potential presence of cryptic lineages;and (ii) whether modifications of distribution ranges during climate oscillations have resulted in hybridization and possible hybrid zone.
2.Materials and methods
2.1.Sampling,library construction,and sequencing
A total of 133 individuals ofGentiana aristatafrom 23 different locations across its range were sampled(Table 1 and Fig.1).Because the plant is tiny,the entire plant of each individual was collected and dried in silica gel.Our field work determined that the corolla ofG.aristatais blue (Type B) in two locations (YS and LWQ) and purplish (Type A) in all others (Fig.1).Voucher specimens were deposited in the herbarium of Luoyang Normal University.
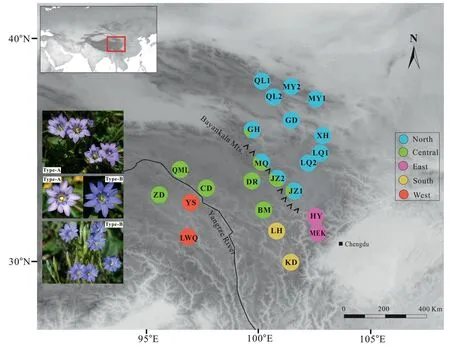
Fig.1.Genetic structure of Gentiana aristata in the Qinghai-Tibet Plateau region.Pie charts illustrate the frequency of color-coded groups based on 29,865 SNPs in FastStructure.The five colors represent the five genetic clusters in Fig.2.The photos reveal the color variation in the corolla.Type A has a purplish corolla and occurs in all G.aristata populations except YS and LWQ.Type B has a blue corolla and occurs in populations YS and LWQ.Photographs: Peng-Cheng Fu.

Table 1 Genetic statistics for Gentiana aristata.No.,sample size;Ar,allelic richness;HS,mean observed gene diversities within population;Ho,mean observed heterozygosities within population; FIS,mean inbreeding coefficient.Abbreviation after localities indicates provinces as follows: QH,Qinghai;GS,Gansu;SC,Sichuan;XZ,Xizang.
Total genomic DNA was extracted from dried leaves with a Dzup plant genomic DNA extraction kit (Sangon,Shanghai,China).DNA concentrations were quantified using Qubit 2.0 fluorometer (Life Technologies).For Genotyping-By-Sequencing (GBS) library construction,a GBS pre-design experiment was performed to elevate the enzymes and sizes of restriction fragments.We imposed three criteria:(i)the number of tags must be larger than 0.3 million;(ii)the enzymatic tags must be evenly distributed across the sequences to be examined;and (iii) repeated tags must be avoided.To maintain the homogeneity of sequence depth across different fragments,a small length range was selected (about 50 bp).Each sample was digested with restriction enzymeMseI(New England Biolabs,NEB),and thereafter withNlaIII(NEB)andEcoRI(NEB).The ligation products were subsequently purified and amplified with PCR.Fragments between 350 and 400 bp were isolated using a Gel Extraction Kit (Qiagen) and purified using Agencourt AMPure XP(Beckman).Libraries were multiplexed and sequenced using a 2 × 150 bp run on two lanes of Illumina NovaSeq 6000 (Tianjin,China).
To obtain plastome sequences,23 samples representing all locations were selected to perform genome-skimming sequencing.For each sample,a 500-bp DNA Illumina NovaSeq sequencing library was constructed using approximately 4.0 ng of sonicated DNA as input.The libraries were multiplexed and sequenced using a 2 × 150 bp run on one lane of Illumina NovaSeq 6000 (Tianjin,China).
2.2.Processing of illumina data
Raw reads were filtered and trimmed using Trimmomatic 0.32(Bolger et al.,2014) with default parameters to eliminate adaptor sequences and low-quality reads and sites.For GBS sequencing,the clean reads against the chromosome-level genome ofGentiana dahuricawere mapped (PRJNA 799480;Li et al.,2022);the closest available genome was mapped with bwa-mem v.2.2.1 (Li and Durbin,2009),and the sequence alignment/map format files were produced employing SAMtools v.1.9 (Li et al.,2009).PCR duplications were identified using sambamba v.0.8.1 (Tarasov et al.,2015),and variations were assessed with freebayes v.0.9.21(Garrison and Marth,2012).Only SNPs were maintained in vcftools v.0.1.13(Danecek et al.,2011)for downstream analysis.SNPs having a minor allele frequency (MAF) of less than 5% and missing frequency of more than 0.8 among individuals were filtered using vcftools v.0.1.13(Danecek et al.,2011).Linkage-disequilibrium(LD)SNP pruning was performed in vcftools to eliminate variants fromeach pair that were closer than 100 bp.The final VCF file was converted into different formats using PGDSpider v.2.1.1.5 (Lischer and Excoffier,2012) to perform further analyses.
Clean reads were assembled for genome-skimming sequencing using the GetOrganelle pipeline (Jin et al.,2020) with default parameters.The published plastome ofGentiana aristata(MN234139,Fu et al.,2021b) was used as the reference.Each plastid genome was annotated with Plastid Genome Annotator (PGA) (Qu et al.,2019) using the default parameters.
2.3.Genetic differentiation and population genetic structure
Allelic richness (Ar) was computed,and heterozygosity (HO),gene diversity (HS),and Wright’s inbreeding coefficient (FIS) were measured using the R package HierFstat (Goudet,2005).To examine the degree of genetic differentiation between populations,pairwiseFSTwas estimated by the Weir and Cockerham method(Weir and Cockerham,1984) using the HierFstat package (Goudet,2005).Range-wide isolation by distance (IBD) (Wright,1943) was determined with a Mantel test using the geographic distance and pairwise genetic distance.FST/(1-FST) against pairwise geographic distances was plotted employing R v.4.0.1 (R Core Team,2020).
To identify genetic clusters ofGentiana aristata,a Bayesian clustering method implemented in FastSTRUCTURE (Raj et al.,2014) was employed based on nuclear SNPs,with assumed clusters (K) from 1 to 18.ThechooseK.pyscript was used to assess the model complexity for the data.Graphical representation of individual cluster assignments was performed using DISTRUCT v.1.1(Rosenberg,2004).Based on the same data set,a principal component analysis (PCA) was performed with ten principal components (PCs) extracted in PLINK v.1.90 (Purcell et al.,2007),and visualized using R.
2.4.Phylogenetic inference and divergence time estimation
First,a nuclear phylogenetic tree based on SNPs was generated using maximum likelihood (ML) in IQ-TREE v.1.6.8 (Nguyen et al.,2015) with 1000 ultrafast bootstraps (Hoang et al.,2018).The Python script ‘vcf2phylip’ (https://github.com/edgardomortiz/vcf2phylip) was used to transfer the SNP data for tree construction.Gentiana crassuloides(specimen no.Fu2019013) was used as an outgroup.
Subsequently,the assembled plastome sequences were used to construct an ML tree.Following the exclusion of one inverted repeat (IR) region,the plastome sequences were aligned using MAFFT (Katoh et al.,2002).The most rapidly evolving sites were eliminated using Gblocks (Talavera and Castresana,2007) with default settings.The substitution model was selected using ModelFinder (Kalyaanamoorthy et al.,2017).Phylogenetic analyses were performed using IQ-TREE (Nguyen et al.,2015) based on the ML and with 5000 ultrafast bootstrap replicates (Hoang et al.,2018).
The divergence times of the main lineages ofGentiana aristatawere estimated based on the plastome (removed one IR) matrix using the Bayesian method implemented in BEAST 2.4(Drummond et al.,2012;Bouckaert et al.,2014).The analyses were performed using the HKY substitution,the Yule,and the strict clock model.Because noG.aristatafossils have been discovered,the dating was calibrated in two ways to increase its accuracy.First,the stem node ofG.sectionCruciatawas constrained with a section of aCruciatafossil from the early Miocene(Mai,2000).Lognormal priors with an offset at 16.0 million years ago (Ma),a mean of 1,and a standard deviation of 1.0 were used.As a result of very limited fossil evidence for gentians,the crown age ofGentianawas also constrained after including primary lineages of this genus.Uniform priors (Schenk and Axel,2016) with a lower age of 21 Ma and an upper age of 38 Ma were used to integrate the entire 95% Highest Posterior Density (HPD) from Janssens et al.(2020).An analysis of priors solely(without sequence data)was performed to determine if there was prior interaction (Warnock et al.,2015).Three independent Monte Carlo Markov chains (MCMC) with 10 million generations,sampling every 1000th generation,were run with the initial 20%discarded as burn-in.Effective Sample Size (ESS) values (>200)were utilized to determine whether the convergence was appropriate,and TreeAnnotator 1.7.5 was used to summarize the tree(Drummond et al.,2012).Information on outgroup sequences is presented in Table S1.
2.5.Hybridization analysis
Patterson’sD-statistics (Durand et al.,2011) were employed to assess introgression withinGentiana aristata.TheD-statistics use asymmetry in gene tree topologies to quantify introgression between either of two lineages that share a common ancestor(P1 and P2)and one additional lineage(P3)that diverged from the common ancestor of P1 and P2 earlier.Patterson’sD-statistics andf4-ratio for all possible population trios were determined using theDtriosfunction of Dsuite v.0.5.r44 (Malinsky et al.,2021) with default parameters.G.crassuloideswas fixed as the outgroup.The significance of each test was evaluated using 100 jackknife resampling runs.Results fromDtrioswere further processed using thef-branch program(Malinsky et al.,2021)and its associated plotting utilities for thef-branch statistics (Malinsky et al.,2018).
2.6.Species distribution modeling
Current distribution data forGentiana aristatawere obtained through our fieldwork records and the Global Biodiversity Information Facility (GBIF.org (03 March 2023) GBIF Occurrence Download https://doi.org/10.15468/dL.x39qqb).Records occurring less than 10 km from each other were eliminated in ArcGIS 10.2 to prevent multicollinearity.The 19 bioclimatic variables utilized at present,Last Glacial Maximum(LGM,~22 kya),and Last Interglacial(LIG,~120-140 kya) were obtained from the WorldClim2 data set(Fick and Hijmans,2017)with a spatial resolution of 2.5 arc-min(30 arc-sec for LIG).Highly correlated variables were eliminated according to Pearson’s correlation coefficient,which was significantly higher than 0.9(p-value<0.05).Using MaxEnt 3.4.1(Phillips et al.,2017),the potential distribution area was predicted.Approximately 75%of the location data was used for training,while the remaining 25% was used to test the predictive ability of the model.The effectiveness of the model was assessed using the receiver operating characteristic (ROC) and the area under the ROC curve(AUC) >0.9.
3.Results
3.1.Genetic diversity and divergence
Illumina sequencing of GBS libraries generated an average of 3,324,959 clean reads and 355,828 tags per sample.A total of 1,218,202 SNPs were identified from all samples against the genome,and 29,865 unlinked SNPs were left for downstream analysis following filtering for MAF,LD,and missing data.InGentiana aristata,the meanAr,Ho,andFISwere 1.199,0.125,and 0.417,respectively.Genomic SNPs revealed that two western populations(YS and LWQ)had a slightly lower genetic diversity(e.g.,Ar,Ho)in comparison to the remaining populations (Table 1).The populations YS and LWQ also had higher values of pairwiseFST(0.436-0.529) in comparison to the remaining populations(0.040-0.429) (Fig.2B and Table S2).The plot ofFST/(1-FST) versus geographic distances among populations revealed a significant positive correlation (r2=0.312,p<2.2e-16),indicating strong signals of IBD (Fig.2C).
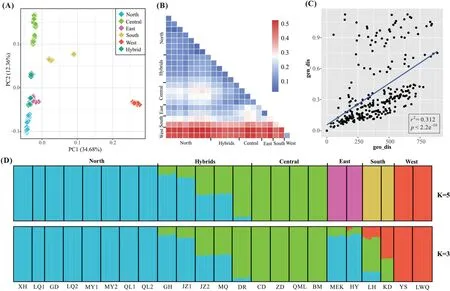
Fig.2.Genetic clustering and differentiation in Gentiana aristata.(A)Results of principal coordinate analysis.Each square represents an individual.(B)A heatmap of the weighted Weir and Cockerham’s FST.(C) Genetic distance (FST/(1-FST)) versus geographical distance (km) between populations.(D) Bar plots indicating probabilities of ancestral clusters of each sample at K=5 and 3 in FastStructure.
3.2.Population genetic structure and hybridization
The marginal likelihood scores from FastSTRUCTURE analyses peaked at K=5(Fig.S1),indicating the populations can be divided into five genetic groups(the West,East,Central,South and North).In general,the inferred genetic groups corresponded with known geographic barriers present between populations.The North cluster(comprising populations QL1,QL2,MY1,MY2,GD,XH,LQ1,and LQ2)stretches from the Qilian Mountains to Min Mountains(Figs.1 and 2D).The Central cluster (ZD,QML,CD,and BM) is mainly situated between the Bayankala Mountains and the Yangtze River,while the West cluster is located to the west of the Yangtze River.The exception is the population ZD,which was grouped into the Central cluster but is located to the west of the Yangtze River(Figs.1 and 2D).The East and South clusters are both located in the Hengduan Mountains.Five populations (GH,MQ,JZ2,JZ1,and DR)situated along the Bayankala Mountains were named Hybrids as a result of their combination of North and Central clusters.The proportion of the North cluster in populations GH,JZ1,MQ,JZ2 and DR,was 0.85,0.79,0.49,0.48,and 0.08,respectively.The marginal likelihood scores from FastSTRUCTURE did not sharply increase since K=3(Fig.S1).Genetic grouping at K=3 showed that the East and South were mixed by a North,Central or West cluster(Fig.2D).The PCA plot identified six clusters,corresponding to the North,Central,West,East,South and Hybrids (Fig.2A).The first two principal components,PC1 and PC2,explained 34.68% and 12.36%of the total variation,respectively.PC3 explained 8.05% of total variation and differentiated the East and Hybrid clusters (Fig.S2).
Thef-branch statistics revealed considerable gene flow from the Central cluster to Hybrids and the Hybrids to the North,as well as the West cluster to the base of the other four clusters.At the population level,strong gene flow was detected from CD,BM and DR to MQ and JZ2,and evident gene flow from JZ2 to JZ1 (Fig.3).Evident gene flow was observed between almost all clusters except West and South to DR,which was located in the center of the range(Fig.3).
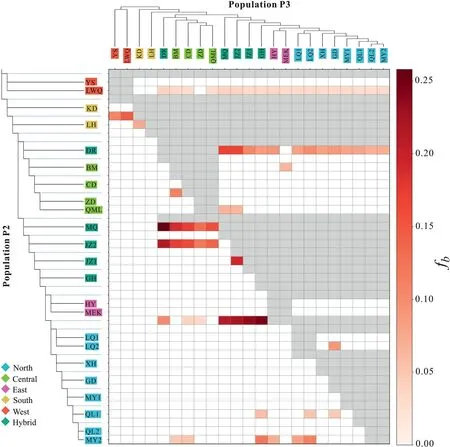
Fig.3.Gene flow detected in Gentiana aristata.A heatmap summarizing the f-branch (fb) statistics from Dsuite.The population tree based on nuclear SNPs is displayed along the sides.The values in the matrix refer to excess allele sharing between the branch b identified on the extended tree on the y-axis and the population P3 identified on the x-axis.The color of each square denotes the f-branch statistics estimate.The colors in the population names represent the genetic clusters in Fig.2.
3.3.Phylogenetic inference and estimation of divergence time
The genomic SNPs generated a well-supported ML tree in which all nodes were fully supported (100%) except for three nodes with support values ranging from 89% to 99% (Fig.4).Individuals from the same population were clustered into one subclade,except for those of HY and MEK,which were mixed in one subclade.Populations from the West (YS and LWQ) were located at the base of the tree,and were sister groups with the remaining populations.Populations from the Hybrids group were located between the Central and the North,the latter of which were assigned to a clade at the tip of the tree(Fig.4).

Fig.4.Maximum likelihood trees of Gentiana aristata based on nuclear SNPs and plastome sequences.Phylogenetic support values are shown above branches only when they deviate from 100% bootstrap support,which is shown as an asterisk (*).Codes in the tips indicate the population names.Each population included in the phylogenetic trees is connected with a line.The colors represent the genetic clusters in Fig.2.
Using the genome-skimming data,23 plastomes were assembled with lengths ranging between 127,562 bp and 128,190 bp.After one IR was eliminated,the plastome matrix with sequence lengths from 105,342 bp to 105,853 bp was used for downstream analysis.The plastome matrix generated a robust backbone in the ML tree (Fig.4).The West as well as populations CD and ZD from the Central cluster were located at the base of the tree.The trees based on SNP and plastome data revealed differences in the placement of most populations,indicating substantial cyto-nuclear conflicts.For example,population LH from the South clustered together with populations BM and QML from the Central in the plastome tree.Populations belonging to Hybrids were assigned to distinct clades in the plastome tree(Fig.4).
Our divergence time analyses based on the plastome matrix indicated that the population YS and the remaining populations diverged in the Early Pliocene,approximately 4.24 Ma (95% HPD:3.95-4.52 Ma).The remaining three clades diverged during the Early Quaternary,approximately between 1.10 and 1.46 Ma(Fig.5).The detailed results,including for the outgroup,are illustrated in Fig.S3.
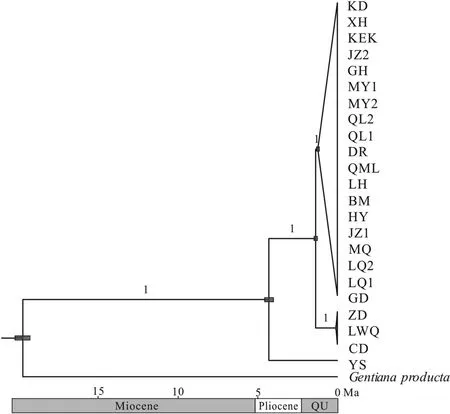
Fig.5.Divergence time estimation in Gentiana aristata.The gray bars indicate the 95% highest posterior density on the age estimates.The posterior probabilities of nodes are displayed above branches.Ma,million years ago;QU,the Quaternary.
3.4.Palaeo-distributional reconstruction
A total of 61 filtered occurrences were used for species distribution modeling analysis.Following Pearson’s correlation analysis,ten bioclimatic variables (bio2-bio5,bio7,bio9,bio13-bio15,and bio18) were used for distributional reconstruction.The palaeodistributional reconstruction showed that two small disjunctive areas in the Hengduan Mountains served as the potential habitat ofGentiana aristataduring the LIG (Fig.6).The potential habitat ofG.aristataincreased northward in its eastern range during the LGM,and then further expanded northward until present(Fig.6).
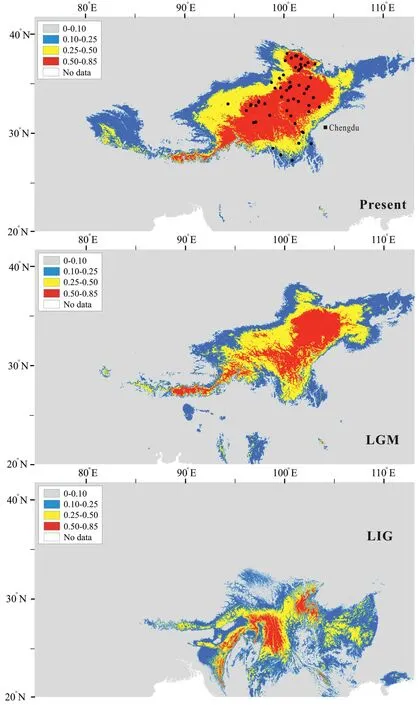
Fig.6.Estimated climatic niches for distribution of Gentiana aristata in the Qinghai-Tibet Plateau region.Maps are shown at present,LGM (~22 kya) and LIG (~120-140 kya).The value of predicted habitat suitability is indicated by the bars in each panel.Current distribution records are represented in the present map by black dots.
4.Discussion
As a region with dynamic diversification,secondary contact and speciation,the QTP region offers an excellent opportunity to analyze the evolutionary history of diversification and how it has been influenced by geological or climatic modifications.Focusing on an annual species in the most speciose lineage ofGentiana,we observed deep genetic divergence corresponding to geological barriers in the QTP region and recovered cryptic diversity based on genetic and morphological evidence.In populations along the Bayankala Mountains,hybridization was rampant.Here,we discuss our results in relation to the biogeographic history of this significant hotspot and contemplate the implications for future studies.
4.1.Strong genetic differentiation and cryptic diversity in Gentiana aristata
The QTP region is renowned for its extraordinary diversity and high rate ofin situalpine speciation(Sun et al.,2017;Xing and Ree,2017;Ding et al.,2020).However,the way that genetic subdivision of populations and biodiversity assemble in speciose lineages within this region has yet to be characterized with precision.Our study addresses this issue by using genomic data and fine-scale population to reveal deep genetic differentiation inGentiana aristata.Our genetic clustering disentangled five distinct clusters inG.aristata,and observed great genetic differentiation between the West and the remaining clusters (averageFST=0.491).Indeed,differentiations within species having wide HM ranges are commonly significant,e.g.,Paraquilegiamicrophylla(FST=0.919-0.926;Luo et al.,2016),Meconopsis integrifolia(FST=0.726-0.905,Yang et al.,2012),Circaeaster agrestis(FST=0.128-0.891;Zhang et al.,2020),andGentiana szechenyii(FST=0.762-0.763;Sun et al.,2022).The extreme ruggedness and geographical barriers in the QTP region,in particular in the HM,are significant factors for the considerable differentiation in diverse species in this area.We also observed a high level of average inbreeding coefficient inG.aristata(FIS=0.417),which could limit gene flow and increase differentiation among populations.The character of herkogamy inG.aristataindicates that selfing in this species shall be rare,but tiny pollinators such as ants could indeed cause selfing,as for example inG.lawrencei(Hou et al.,2009).
Geographical features,such as mountains and rivers,could act as barriers to gene flow,leading to genetic differentiation and even speciation (Seregin et al.,2015;Pertierra et al.,2020;White et al.,2020).The five distinct clusters occur in five areas (Fig.1) that are geographically separated by physical barriers,such as Bayankala Mountains and the Yangtze River.The Bayankala Mountains,often referred to as Bayan Har Mountains,are a spur of the Kunlun Mountains in China and serve as the watershed for the headwaters of the Yellow River and Yangtze River.Although the Bayankala Mountains are not characterized by high ruggedness as the HM,their average elevation of approximately 5000 m makes them sufficient to serve as barriers throughout glacial cycles for species likeGentiana aristatawith short-distance dispersal pollinators.Recently,a set of studies on plants from the QTP region,includingPinus armandii(Liu et al.,2019),Rheum palmatum(Feng et al.,2020),andGentiana hexaphylla(Fu et al.,2022b),identified a distinct genetic pattern in this topographically complicated environment.These geographical characteristics also had an important impact on species assembly across the HM and the greater QTP region(Li et al.,2021).
Climate changes associated with glacial cycles may also significantly alter the distribution of species.Specifically,climate changes may fragment or shift the ranges of species,accelerating diversification or secondary contact within montane species (Muellner-Riehl,2019),includingGentiana(Fu et al.,2022a).The divergence time withinG.aristataprimarily occurred in the Early Quaternary when the QTP region underwent cycles of glaciations and plant species experienced recurrent range changes to track favorable habitats (Hewitt,2000;Zheng et al.,2002).Studies ofAnisodus tanguticus(Wan et al.,2016),Medicago(Guo et al.,2023),andOstryopsis intermedia(Liu et al.,2014),as well as those on birds(Lei et al.,2014),also suggest lineage diversification during the Early Quaternary in this region.Therefore,the existing genetic pattern inG.aristatamay have been fostered by both geographical features and climate oscillations.
In areas comprising rich and dynamic flora like the QTP region,morphological variation is frequently observed within species of diverse lineages,includingGentiana(Ho and Pringle,1995;Ho and Liu,2001).The flora describedG.aristataas having blue to pale purple corollas (Ho and Pringle,1995),which is consistent with our observations that the corollas are blue in populations YS and LWQ or pale purple in the remaining populations (Fig.1).Although corolla color has revealed phenotypic plasticity in a number of species(Clegg and Durbin,2000;Muchhala et al.,2014;Liang et al.,2023),populations with blue corollas in this study exhibited deep genetic differentiation from those with pale purple corollas,as indicated by the highFSTvalues(0.436-0.529),distinct genetic clustering (Fig.2A and D),and sister placement in the phylogenetic trees (Fig.4).Additionally,populations in the West cluster (YS and LWQ) are geologically separated from the remaining clusters by the Tongtian River,which is the upper reaches of the Yangtze River.The divergence period between population YS and the remaining populations occurred in the Early Pliocene,when the Tongtian River already existed (Chen et al.,2020;Zhang et al.,2021).Meanwhile,the divergence time between population YS and the remaining populations occurred as early as approximately 4.15 Ma,a time range ensuring divergence occurred between morphologically distinct species in gentian (Fig.S3;Favre et al.,2016).Interestingly,populations in the West cluster revealed slightly lower genetic diversity in comparison to the remaining populations,considering highFISvalues inG.aristata,together exhibiting poor gene flow between the West and the remaining populations,which was supported byD-statistics(Fig.3).Taken together,these findings suggest that the cryptic diversity in populations YS and LWQ were caused by geological isolation.Population ZD,located west of the Yangtze River,was grouped into the Central cluster rather than the West.This clustering might be explained by weak geological isolation near the origin of the Yangtze River.Genetic data,especially genomic data,have provided growing evidence of cryptic species in both animals and plants (Struck et al.,2018),for example,in butterflies (Hebert et al.,2004),bumblebees (Christmas et al.,2021),yew (Liu et al.,2013),andSarracenia(Carstens and Satler,2013).Thus,we propose that the cryptic diversity in dynamic flora likely in the QTP region might be vastly underestimated,and genomic data should be widely employed to evaluate the biodiversity of the region.
4.2.Rampant hybridization along Bayankala Mountains
The QTP region offers an excellent opportunity to gather evidence on the role of hybridization and introgression for adaptation and diversification because of the remarkable number of radiations in the QTP region,of which many closely related species are sympatric.Our genomic SNPs not only disentangled distinct clusters in allopatry inGentiana aristatabut also identified a very clear intraspecies hybrid region around the Bayankala Mountains (Fig.1).Regarding the structure of the hybrid region,the proportion of the North cluster,for example,in the five sampled populations ranged from 0.08 to 0.85,indicating that it consisted of offspring of recent hybrids or backcrosses.Interestingly,phylogenetic analyses based on plastid data demonstrated that the five populations are clustered into various lineages(Fig.4),indicating the different maternal origins of the hybrids and bi-directional gene flow in this hybrid region.Moreover,genetic grouping at K=3 and PCA plots both indicated that the East and South clusters are mixed with the North,Central or West clusters (Fig.2A and D),indicating they are likely introgressed rather than divergent lineages,as for example in white birch(Nocchi et al.,2023),although more evidence is needed.In the East and South clusters located in the HM,which is characterized by deeply dissected landscapes and has created complex genetic structure,geological isolation and hybridization are likely the main factors that have shaped genetic differentiation.In fact,hybridization has been widely observed to drive species formation and biodiversity assembly in the QTP region (Wu et al.,2022),from herbs (e.g.,Saxifraga,Ebersbach et al.,2020) and shrubs (e.g.,Rhododendron,Ma et al.,2022) to woody species (e.g.,Pterocarya,Wang et al.,2023;Populus,Li et al.,2023).
Because the Bayankala Mountains separate populations into two genetic clusters,any observed hybridization here would likely be caused by secondary contact following range changes induced by climate oscillations.Climate oscillations cause variable connectivity across sky-islands in mountain systems as demonstrated,for example,in the HM(Deng et al.,2020)and Flickering Connectivity System(Andes;Flantua et al.,2019;Dantas-Queiroz et al.,2023).In a number of cases,connectivity in the QTP region has been shown to facilitate hybridization across different genetic groups at intraand inter-species levels(Liu et al.,2014;Wu et al.,2022).Although the Bayankala Mountains served as one of the major geological barriers to populations ofGentiana aristata,vertical displacement as a result of temperature changes have offered chances for clusters on opposite sides of the mountain to come into contact in some areas.Our species distribution modeling revealed range expansion since LIG inG.aristata(Fig.6),as expected.In particular,the potential range size of most alpine plants expanded,rather than contracted,during the warming in the QTP region (Liang et al.,2018),providing additional opportunities for contact in this region in the context of climate warming.
Natural hybrids can be identified in almost all species-rich genera in the QTP region (Yang et al.,2019;Wu et al.,2022).Growing evidence from both population genetics and phylogenetics suggests that hybridization might be more pervasive than previously believed in this species-rich genusGentiana,which has received increased attention.Hybridization was observed in nearly every taxon examined,for example,ancient hybridization in the sectionsCiminalis(Christe et al.,2014),Cruciata(Fu et al.,2021a),andChondrophyllae(Chen et al.,2021;Fu et al.,2022c),and recent hybridization in the sectionsCruciata(Hu et al.,2016),Kudoa(Fu et al.,2020,2022a),andIsomeria(Sun et al.,2022).Compared with rapidly growing cases of hybridization within the genus,reports of ancient hybridization among genera or lineages are scarce.Recent studies of phylotranscriptomics in the subtribe Swertiinae (Gentianaceae) demonstrate that a large clade comprising 10 genera has an ancient hybrid origin (Chen et al.,2023),suggesting hybridization might be more frequent than previously assumed and could be technically identified in the genomic era.The role of hybridization in rapid diversification events and biodiversity assembly in dynamic flora,such as in the QTP region and Andean p′aramos,are still relatively understudied despite growing evidence (Schley et al.,2022) and increasing genomic resources that could help shed light on the evolutionary effects of hybridization.
5.Conclusions
In this study,we used genomic data to reveal deep differentiation ofGentianaaristatain the QTP region,and rampant hybridization resulting in post-F1 hybrids along a geographical feature.We identified cryptic diversity inG.aristatawith evidence obtained from both genetic and morphological characteristics.The differentiation and cryptic diversity were promoted by climatic fluctuations and geological barriers.These findings suggest that cryptic diversity and hybridization are crucial for biodiversity assembly in the QTP region.
Author contributions
P.C.F.designed the experiments,collected the samples,analyzed the data and wrote the main manuscript;Q.Q.G.and D.C.analyzed the data and prepared figures;Q.B.G.collected the samples;S.S.S.analyzed the data and revised the manuscript.All the authors have read and approved the final manuscript.
Data availability statement
The data set supporting the conclusions of this article is available in the Figshare (https://doi.org/10.6084/m9.figshare.22698871).
Declaration of competing interest
The authors have no conflict of interest.
Acknowledgements
We thank Yi-Lin Fan of Zhengzhou Customs Technology Center for the support in sample collecting.We are grateful to financial support provided by the Foundation of Henan Educational Committee (22A180024) and Natural Science Foundation of Henan Province (232300420212).
Appendix A.Supplementary data
Supplementary data to this article can be found online at https://doi.org/10.1016/j.pld.2023.10.004.
杂志排行

植物多样性的其它文章
- Global patterns and ecological drivers of taxonomic and phylogenetic endemism in angiosperm genera
- Patterns and drivers of plant sexual systems in the dry-hot valley region of southwestern China
- Cryptic divergences and repeated hybridizations within the endangered “living fossil” dove tree (Davidia involucrata) revealed by whole genome resequencing
- Enhanced and asymmetric signatures of hybridization at climatic margins: Evidence from closely related dioecious fig species
- Circumscription of the East Asia clade(Apiaceae subfamily Apioideae)and the taxonomic placements of several problematic genera
- Historical biogeography and evolutionary diversification of Lilium(Liliaceae): New insights from plastome phylogenomics