Predictive visual field outcomes after optic chiasm decompressive surgery by retinal vessels parameters using optical coherence tomography angiography
2024-02-23WenJuanYuJinXiaoGuangXinWangChangJiangWeiZhaRongFengLiao
Wen-Juan Yu, Jin Xiao, Guang-Xin Wang, Chang Jiang, Wei Zha, Rong-Feng Liao
1Department of Ophthalmology, the First Affiliated Hospital of Anhui Medical University, Hefei 230022, Anhui Province,China
2Department of Neurosurgery, the First Affiliated Hospital of Anhui Medical University, Hefei 230022, Anhui Province,China
3Department of Ophthalmology, the First People’s Hospital of Hefei, Hefei 230061, Anhui Province, China
Abstract
● KEYWORDS: sellar region mass; retinal vessels; optic chiasm; optical coherence tomography angiography; visual field; decompressive surgery
INTRODUCTION
The optic chiasm is highly susceptible to compression by masses in the sellar region due to its unique anatomical location[1].Visual impairment is one of the most common symptoms in patients with chiasmal compression[2], presenting as reduced visual acuity and visual field defects.The assessment of the patient’s visual function can help determine the extent of the disease, assist in clinical decision-making(e.g., planning the timing of surgery), and predict visual function recovery after surgery[3].Therefore, the preoperative assessment of visual dysfunction is very important for proper patient management.
Among the modern tools available to assess the visual functions, ganglion cell complex (GCC) and peripapillary retinal nerve fiber layer (pRNFL) thicknesses measured by optical coherence tomography (OCT) can quantitatively assess the extent of the retinal ganglion cells (RGCs) loss caused by the retrograde degeneration[4-5]and can serve as objective indicators of the severity of visual impairment[6-8].In addition,the inner retinal capillary network provides nutrition to the RGCs, and the RGCs are, therefore, sensitive to changes in hemodynamics.Optical coherence tomography angiography(OCTA), a new rapid tool for retinal vascular segmentation,can be used to observe the retinal microcirculation in patients with chiasmal compression, showing that the vessel density(VD) of their superficial retinal capillary plexus (SRCP)and radial peripapillary capillary (RPC) was significantly reduced[9-11].Therefore, chiasmal compression not only leads to the loss of RGCs but also alters retinal microcirculation.
Nevertheless, the exact sequence of the retinal microstructure and microcirculation changes and their interrelationship has not been clarified.Various hypotheses have been suggested.1)The loss of RGCs due to retrograde degeneration can reduce the metabolic activity and nutritional demand and supply to the retina, subsequently affecting the retinal microcirculation[9].2) The direct compression of the internal carotid artery by the compressing mass leads to a decrease in blood supply to the retina from the ophthalmic artery, resulting in changes in retinal microcirculation and subsequently affecting the retinal structure and function[10].Unfortunately, these two studies[9-10]were cross-sectional and could not explore causality.Only three studies examined retinal VD before and after decompression surgery, showing that retinal VD was increased 48h postoperatively[12], was decreased 4-6mo postoperatively[13], and was increased 1y postoperatively,respectively[14].Therefore, these three studies present somewhat discrepant results and widely different postoperative time points.
Predicting visual recovery after decompression surgery in patients with sellar region mass remains challenging[3].Many studies have shown the predictive value of age[15], symptom duration[16], tumor size[17], morphological parameters of the optic chiasm[18]and preoperative visual function[19].However,the relationship between age and prognosis is controversial,and the duration of symptoms is difficult to define accurately.A growing number of studies confirm the predictive value of OCT for postoperative vision recovery, and several studies have evaluated the predictive ability of pRNFL and GCC separately[19-20]and compared pRNFL with GCC[8,21].Leeet al[22]have evaluated the predictive potential of OCTA for postoperative visual field recovery and suggested that RPC and SRCP might serve as sensitive predictors.However,no previous studies have evaluated the predictive ability of RPC and SRCP and directly compared the predictive ability of retinal layer thickness (GCC and pRNFL) and retinal VD(SRCP and RPC).
Therefore, this study aims to assess the changes in retinal microstructure and retinal microcirculation before and after decompression surgery and also to evaluate and compare the predictive ability of retinal layer thickness (GCC and pRNFL)and retinal VD (SRCP and RPC) for visual field recovery after decompression.
SUBJECTS AND METHODS
Ethical ApprovalThis study was performed in accordance with the World Medical Association Declaration of Helsinki.This study protocol was reviewed and approved by the Ethics Committee of the First Affiliated Hospital of Anhui Medical University (approval number PJ2022-13-11).All participants signed the informed consent form.
Study Design and ParticipantsThis prospective longitudinal study involved patients with chiasmal compression and healthy controls at the Department of Neurosurgery of the First Affiliated Hospital of Anhui Medical University between October 2020 and February 2022.
Patients older than 18y with chiasmal compression due to sellar region mass confirmed by magnetic resonance imaging (MRI)and scheduled for decompressive surgery were enrolled in this study.The healthy controls were staffmembers who worked at the First Affiliated Hospital of Anhui Medical University and healthy volunteers.The healthy controls were matched by age,sex, and spherical equivalent (SE) to the patients.
The exclusion criteria (all participants) were 1) history of intracranial or ocular surgery, 2) optic disc edema, 3)comorbidities that affect the retinal structures or blood vessels,such as hypertension and diabetes, 4) other ophthalmic diseases such as glaucoma, retinal disease, uveitis, or optic neuropathy, 5) significant refractive opacity that affects the scan quality index (SQI) of OCTA, 6) SEs greater than +6.0 diopters or smaller than -6.0 diopters, astigmatism greater than 3 diopters.
Surgery and Follow-upAll patients underwent preoperative ophthalmic examinations, including slit-lamp microscopic examination of the fundus, measurement of best-corrected visual acuity (BCVA), intraocular pressure, static automated perimetry, and OCTA.BCVA was converted to the logarithm of minimal angle of resolution (logMAR).All patients underwent decompression surgery.Outpatient follow-up was performed 1 and 4-6mo after surgery, and the specific examinations were the same as before surgery.
Visual Field TestingAll patients and healthy controls were examined using automated perimetry (Octopus 900, Haag-Streit Inc, Switzerland) and 32 standard procedures for central 30° visual field testing.The refractive errors were corrected by the near lens before testing.The 32 program uses a dynamic strategy to determine the sensitivity thresholds for different regions of the visual field.The mean defect (MD)is the arithmetic mean of the sensitivity loss shown in the comparison chart and represents the average visual field defect at each detection site.MD was used to evaluate the severity of the visual field defect.MD was greater in patients with greater visual field defects.The reliability criterion was based on a reliability factor <15%.Visual field recovery was defined as the absence of clusters of three or more points withP<5% on the corrected probabilities diagram in the temporal hemifield at the last followup visit[11].
OCTA ScanningAll participants underwent OCTA scanning.Retinal microstructure and microvasculature were analyzed by Angiovue RTVue XR Avanti (Optovue, Inc, CA, USA).The angio retina mode (3 mm×3 mm scan centered on the macular fovea), the angio disc mode (4.5 mm×4.5 mm scan centered on the optic disc), and the GCC mode (6 mm×6 mm scan centered on 1 mm temporal to the macular fovea) were performed on all participants.Only images with an SQI≥6/10 and no large motion artifacts and vessel discontinuities were analyzed.AngioAnalytics software (version 2017.1.0.151) was used to determine the different layers and sectors, and the blood vessels were analyzed and quantified.Based on the Garway Heath method, the angio disc scans were classified into eight subsectors [nasal-superior (NS), nasal-inferior (NI), inferiornasal (IN), inferior-temporal (IT), tempo-inferior (TI), temposuperior (TS), superior-temporal (ST), and superior-nasal(SN)].Based on the fovea-centered Early Treatment Diabetic Retinopathy Study grid, the angio retina scans were classified into four quadrants (superior, temporal, inferior, and nasal).GCC scans were divided into superior and inferior sectors.The VD was calculated as the percentage of the vascular area to the total area in the selected region.
Statistical AnalysisSPSS 25 and RStudio 4.4.3 was used for statistical analysis.The Shapiro-Wilk test was used to examine the normality of the continuous data.All continuous variables were expressed as means±standard deviation and median(interquartile range) and analyzed using the independent samplet-test (normal distribution) and the Mann-WhitneyUtest (skewed distribution).The generalized estimating equation(GEE) was performed to compare the thickness of pRNFL and GCC and VD of RPC and SRCP between patients and healthy controls after adjusting for age, sex, SE, and SQI (to consider intraindividual correlations between eyes within an individual).The GEE that can handle missing data is used, along with the Bonferroni method to compare eye parameters at different time points.Logistic regression models were used to assess the association between preoperative OCT parameters and visual field recovery.One OCT parameter was used as a predictive factor at a time with visual field recovery as the outcome variable, generating a total of 26 models.The area under the receiver operating characteristic curve (AUC) was used to evaluate the discrimination of the model and models with larger AUCs were considered to be those with better predictive performance.The best predictive GCC, pRNFL, SRCP,and RPC models were compared using AUC, sensitivity,specificity, Youden’s index, and Youden-optimal cut-off.The integrated discriminant improvement index (IDI) was used to compare the predictive value among the best predictive GCC, pRNFL, SRCP, and RPC models.P-values <0.05 were considered statistically significant.
RESULTS
Characteristics of the ParticipantsA total of 43 eyes of 24 patients with chiasmal compression and 48 eyes of 24 healthy controls were enrolled in this study.The patients presented with pituitary adenomas (n=20, 83.3%), meningioma (n=2,8.3%), and Rathke’s cleft cyst (n=2, 8.3%).Twenty-three patients underwent transsphenoidal surgery, and one patient underwent transcranial surgery.Preoperative BCVA was significantly different between the two groups (P<0.001; Table 1).Age, sex, and SE were comparable between the two groups.
Retinal Layer Thickness and Vessel DensityThe comparisons of retinal microstructure thickness and VD were performed in the peripapillary and macular areas (Table 2).All GCC indicators were significantly lower in the patient group (allP<0.05) compared with the control group.The pRNFL thickness was significantly thinner in all sectors in patients compared with healthy controls (allP<0.05).SRCP VD in all quadrants was significantly lower in the patient group compared with the control group (allP<0.05).Preoperative VD of RPC was lower in the NS, NI, TI, TS, and SN of the patients compared with the control group (allP<0.05).
Visual Function, Retinal Layer Thickness, and Vessel Density Before and After SurgeryWhen the preoperative and postoperative ophthalmic parameters were compared(Figures 1 and 2), visual field defects (P<0.001) and visual acuity (P=0.001) significantly recovered after decompression surgery.GCC thickness was reduced in all sectors after surgery(allP<0.05).pRNFL thickness also reduced significantly after surgery in the NI, IN, IT, TI, TS, and ST sectors (allP<0.05).The RPC VD was reduced after surgery, and the decrement of RPC VD was significant in the NS, NI, TI, TS, ST, and SN sectors (allP<0.05) except for the IN and IN sectors after surgery.The SRCP VD also tended to decline after surgery,the decrement was non-significant in the inferior quadrant and significant in the temporal, superior, and nasal quadrants (allP<0.05).
Predictive Factors of Retinal Layer Thickness and Vessel Density for Postoperative Visual Field OutcomeAge and gender were not associated with visual field recovery so they were not included in the logistic regression analysis (allP>0.05).Twenty-six univariate logistic regression models were generated and compared based on each OCT parameter and visual field recovery results.Logistic regression odds ratios, significance levels, and AUCs for each model are shown in Table 3.The 77.8% (7/9) of the pRNFL, 100.0% (3/3) ofthe GCC models, 66.7% (6/9) of the RPC, and 60.0% (3/5) of SRCP were significantly predictive of visual field recovery (allP<0.05).

Table 1 Demographic and clinical information of the participants

Table 2 Comparison of the retinal layer thickness and VD between patients and healthy controls

Table 3 Univariate logistic regression model of the retinal layer thickness and vessel density for visual field recovery

Figure 1 Comparison of superficial retinal capillary plexus (SRCP), radial peripapillary capillary (RPC), ganglion cell complex (GCC),peripapillary retinal nerve fiber layer (pRNFL), and visual field (VF) between patients with chiasmal compression at different periods and healthy controls.
The AUCs of all GCC models (range from 0.828 to 0.866)were greater than the AUCs of the pRNFL models (range from 0.591 to 0.825) and the RPC models (range from 0.616 to 0.824).As shown in Figure 3, the best predictive GCC and pRNFL models were based on the superior GCC (AUC=0.866)and the tempo-inferior pRNFL (AUC=0.824), and the best predictive SRCP and RPC models were based on the nasal SRCP (AUC=0.718) and tempo-inferior pRNFL (AUC=0.825).Increased superior GCC thickness was associated with higher odds ratio (OR) of visual field recovery (OR=1.17, 95%CI,1.06-1.30,P=0.002).Increased thickness of the tempoinferior pRNFL was associated with higher odds of visual field recovery (OR=1.12, 95%CI, 1.04-1.20,P=0.003).Increased nasal SRCP VD was associated with higher odds of visual field recovery (OR=1.22, 95%CI, 1.04-1.44,P=0.016).Increased tempo-inferior RPC VD was associated with higher odds of visual field recovery (OR=1.27, 95%CI, 1.08-1.48,P=0.003).The Youden-optimal cut-offvalues for the superior GCC, tempo-inferior pRNFL, nasal SRCP, and tempo-inferior RPC prediction models were 92.5 μm, 57.5 μm, 43.8%,and 48.9%, respectively.There was no statistical difference in the predictive value of the best predictive GCC model and the best predictive pRNFL model (IDI, 0.08; 95%CI,-0.29, 0.12,P=0.420), the best predictive GCC model and the best predictive RPC model (IDI, -0.04, 95%CI, -1.07,0.08,P=0.380), the best predictive pRNFL model and the best predictive RPC model (IDI, 0.05, 95%CI, -0.06, 0.15,P=0.380).The above three models were more predictive than the best predictive SRCP model (allP<0.05).
DISCUSSION
This study showed that OCT structural parameters (pRNFL and GCC thickness) and OCTA vascular parameters (RPC and SRCP VD) were significantly decreased in patients with chiasmal compression due to sellar region mass and continued to decrease even after decompression surgery.This study assessed the predictive ability of RPC and SRCP for visual field recovery and compared them directly with pRNFL and GCC.This study showed that the predictive power of GCC parameters was slightly higher than that of pRNFL and RPC parameters, but the difference was not significant.The predictive power of SRCP parameters was significantly lower than that of GCC, pRNFL, and RPC parameters.

Figure 2 Changes in radial peripapillary capillary (RPC) vessel density, superficial retinal capillary plexus (SRCP) vessel density, and visual function after decompression surgery Values are presented as amean or bmedian.cP<0.05, dP<0.01, eP<0.001, tested by generalized estimating equation mode (preop.vs 1mo postop.; preop.vs 4-6mo postop.).
The patients with chiasmal compression had reduced GCC and pRNFL thicknesses in all sectors.The reduction in pRNFL and GCC thickness can be attributed to RGC apoptosis due to retrograde degeneration caused by chiasmal compression[4].The crossed fibers originating from nasal hemiretina join the optic disc directly from the nasal and temporal (papillomacular bundle) side, while the uncrossed fibers which originate from temporal hemiretinas encircle the papillomacular bundle and join the optic disc from above and below.Since the crossed fibers were first affected, the pallor appears mainly on the nasal and temporal sides of the optic disc, constituting a horizontal pallor known as band atrophy.This pattern would cause significant thinning of the nasal and temporal RNFL around the optic disc.However, this study showed extensive defects of ganglion cells in the macula and peripapillary areas, as supported by Leeet al[9].This may be attributed to the heavy compression affecting not only the crossed fibers but also the non-crossed fibers, or the crossed fibers may also originate from above and below the optic disc.The VD of RPC was reduced in patients with chiasmal compression, which is supported by previous studies[10,23].This could be attributed to a secondary reduction in perfusion due to reduced nutritional demand caused by ganglion cell loss and axonal injury or a primary vascular dysfunction caused by compression[9-10].The VD of RPC was significantly reduced in the horizontal region, while the difference was not significant in the vertical region, which is consistent with the pattern of band atrophy.The results show that the VD of SRCP was reduced in patients with chiasmal compression and was most variable in the nasal quadrant, which is supported by Leeet al[9].
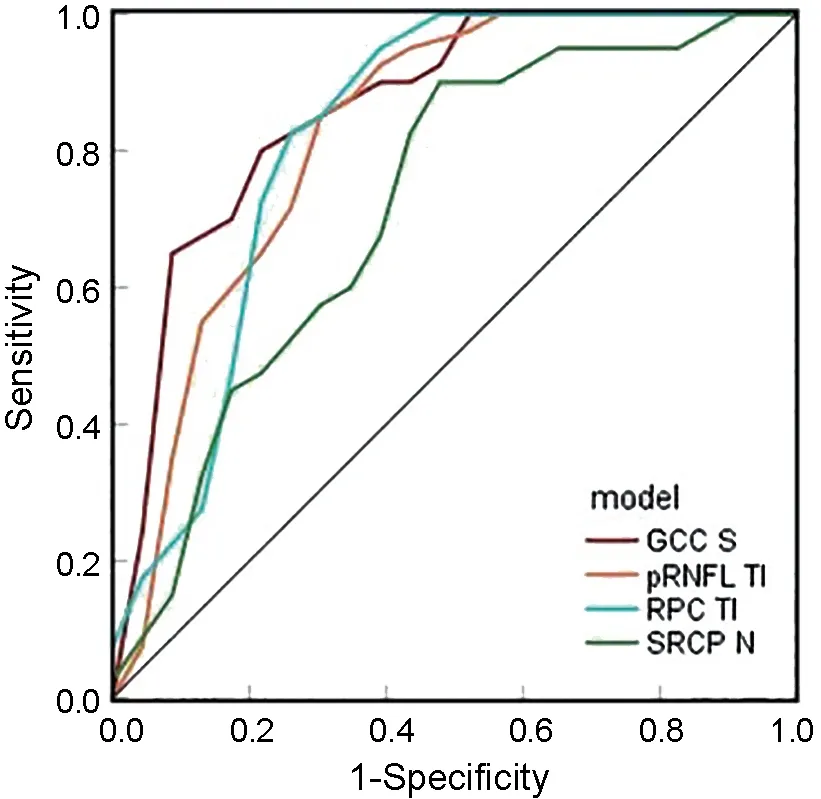
Figure 3 Receiver operating characteristic curve of best pRNFL model, best GCC model, best RPC model, and best SRCP model GCC S: Superior macular ganglion cell complex layer; pRNFL TI: Tempoinferior peripapillary retinal nerve fiber layer; RPC TI: Tempo-inferior radial peripapillary capillary; SRCP N: Nasal superficial retinal capillary plexus.
In this study, both visual field and acuity showed significant improvement postoperatively.The possible mechanisms for the recovery of visual function after decompression are as follows: When the chiasm is compressed by a tumor,conduction block and interruption of axoplasmic flow occur first[3], followed by demyelination of nerve fibers[24], resulting in visual dysfunction.However, these damages are reversible before retrograde degeneration occurs.After decompression surgery, the conduction block is rapidly reversed, leading to partial recovery of visual function, which is the first stage of recovery[25].In the second stage, improvement of axoplasmic flow and remyelination lead to further recovery of visual function[26].
This study showed that the thicknesses of GCC and pRNFL continue to thin progressively within 6mo after decompression surgery, which is similar to the results of Leeet al[19].Leeet al[27]found that the thicknesses of RNFL, ganglion cell layer, and inner plexiform layer in patients with chiasmal compression continued to progress 1y after decompression surgery.In a cohort study by Moonet al[28], RNFL thickness was lower at 3mo postoperatively compared to preoperatively,while RNFL thickness increased at 6mo postoperatively compared to 3mo.Danesh-Meyeret al[29]found that the average RNFL thickness decreased by 4.1% between preoperative and first postoperative visit (6-10wk), then increased by 4.4% between the first and second postoperative visits (9-15mo), supporting Moonet al’s[28]research results.
The thicknesses of pRNFL and GCC reflect the status of RGCs.The number of apoptotic ganglion cells will not change postoperatively, and unaffected cells remain stable.Only the fate of dysfunctional ganglion cells is unknown (recovery or death), and they are key factors affecting retinal structural thickness.Animal experiments have shown that retrograde degeneration spreads from axons to cell bodies over 1-3mo,resulting in delayed characteristics.Even after decompression,ganglion cells continue to undergo apoptosis[30], which may be the reason for the decrease in pRNFL and GCC thickness after surgery.Morgan[31]observed axonal shrinkage during the initial stage of reversible damage in a glaucoma model.Similar axonal compression may also exist in chiasmal compression lesions and recover after decompression surgery, which may be the reason for the increase in pRNFL and GCC thickness after surgery.Therefore, this study believes that changes in pRNFL and GCC thickness after decompression may depend on the degree of delayed apoptosis and axonal compression recovery.In all cited studies above, RNFL thickness thinned early postoperatively, which may be because delayed apoptosis occurs earlier than axonal compression recovery.In Moonet al’s[28]and Danesh-Meyeret al’s[29]studies, RNFL thickness showed a trend of decreasing first and then increasing,indirectly supporting this hypothesis.In summary, changes in RGCs after surgery are very complex, and changes in pRNFL and GCC thickness after surgery may be related to age,duration of symptoms, and severity of chiasmal compression.The results of this study show that SRCP and RPC VD also decreased further within half a year after surgery, which is supported by Leeet al’s[19]study.This result overturns the hypothesis that tumor direct compression leads to reduced retinal blood perfusion because if this hypothesis holds true, retinal blood perfusion should increase rather than decrease after decompression.Therefore, this study believes that the decrease in retinal VD in patients with chiasmal compression is secondary to apoptosis of ganglion cells and shows a downward trend with pRNFL and GCC in the early postoperative period.Cennamoet al[14]found that SRCP and RPC VD increased significantly 1y postoperatively, but this study had only 8 cases.Further large sample long-term longitudinal studies are needed to verify changes in retinal vascular perfusion in patients with chiasmal compression in the long-term postoperative period.
Most of the patients had varying levels of visual field improvement after decompression.In this study, the mean visual field defect improved from 12.85 dB preoperatively to 6.72 dB postoperatively.However, postoperative visual field outcomes varied widely (from 0.5 dB to 11.7dB).Predicting the postoperative visual field outcomes requires an understanding of the number of irreversibly damaged neurons in the optic nerve.The pRNFL thickness represents the number of surviving RGCs axons and was first used to predict postoperative visual function recovery.Danesh-Meyeret al[29]found an increased propensity for visual recovery in patients with normal pRNFL thickness compared to patients with thin pRNFL thickness, suggesting that preoperative pRNFL can predict visual recovery after decompression.GCC includes the cell body, axons, and dendrites of the RGCs and can reflect the integrity of the entire ganglion cells.Tiegeret al[8]showed that GCC may be more sensitive than pRNFL in detecting chiasmal compression.Several studies have explored the predictive value of macular thickness parameters for postoperative visual outcomes.Meyeret al[21]directly compared pRNFL and macular ganglion cell layer (mGCL) in predicting longterm postoperative visual recovery and showed that mGCL performed better in predicting visual field recovery.Leeet al[9]found that VD of RPC and SRCP correlated with pRNFL and GCC thickness, they then questioned whether retinal VD has predictive potential for visual field improvement after decompression and found a correlation between preoperative retinal microvascular changes and postoperative visual field outcomes, suggesting that VD in the macula and peripapillary area might serve as a sensitive predictor.
This study was the first to compare retinal layer thickness (GCC and pRNFL) and retinal VD (SRCP and RPC) in predicting post-operative visual field outcomes in patients with chiasmal compression.This study extends the work of Leeet al[9]to show that GCC parameters had slightly better predictive value than the pRNFL and RPC parameters, while the SRCP parameters had lower predictive power than the GCC,pRNFL, and RPC parameters.Compared with previously predictive models based on mGCL and pRNFL in the work of Meyeret al[21]the model in this study showed higher pRNFL discriminatory capacity (AUC 0.83vs0.58), and lower GCC discriminatory capacity (AUC 0.87vs0.90) perhaps because the VF MD was greater in this study (12.8 dBvs5.9 dB) and used GCC rather than mGCL thicknesses as a prognostic factor.Further studies will combine MRI parameters (such as suprasellar extension and MRI compression grade, age,duration of symptoms, and OCT parameters to construct a better postoperative visual prediction model[15-18].
This study has certain limitations that should be considered.1) The sample size was small and the follow-up period was short; 2) Only inpatients were included as study participants,which may lead to selection bias; 3) Due to the small sample size, it was difficult to analyze the relationship between the types of sellar tumor and retinal microcirculation; 4) Patients with functional pituitary adenomas were included, which may lead to potential effects of abnormal hormone secretion on retinal microcirculation; 5) Ideally, clinical prediction models should be validated using external datasets.This study has no validation set due to the small sample size and therefore cannot validate the performance of the model in the external real environment.
In conclusion, GCC and pRNFL thicknesses and SRCP and RPC VD were reduced in patients with sellar region mass compared with healthy controls and decreased further after surgery.GCC parameters were the most accurate predictors of postoperative visual field recovery, RPC parameters are similar to pRNFL parameters with good predictive value, and SRCP parameters showed low predictive value.
ACKNOWLEDGEMENTS
Authors’ contributions:Liao RF: Conceptualization,methodology.Yu WJ: Data curation, writing-original draft preparation.Xiao J: Formal analysis, investigation, resources.Wang GX: Data curation, software.Jiang C: Visualization.Zha W: Writing-reviewing and editing.Yu WJ and Xiao J contributed equally to this work.
Conflicts of Interest:Yu WJ,None;Xiao J,None;Wang GX,None;Jiang C,None;Zha W,None;Liao RF,None.
杂志排行

International Journal of Ophthalmology的其它文章
- Using choroidal thickness to detect myopic macular degeneration
- lmpact of multifocal gas-permeable lens designs on short-term choroidal response, axial length, and retinal defocus profile
- Baerveldt glaucoma implant with Supramid© ripcord stent in neovascular glaucoma: a case series
- Efficacy and safety of Usights UC100 illuminated microcatheter in microcatheter-assisted trabeculotomy
- Quantifying peripapillary vessel density and retinal nerve fibre layer in type 1 diabetic children without clinically detectable retinopathy using OCTA
- Nomogram to predict severe retinopathy of prematurity in Southeast China