Preparation of macroalgae biochar and its application in removal of phenanthrene from aqueous solution
2024-02-03WANGYueSUNMengyanZHUFeixiaYANGJingLIUJiaoLOUYongjiangLIYongyong
WANG Yue,SUN Mengyan,ZHU Feixia,YANG Jing,LIU Jiao,LOU Yongjiang,LI Yongyong
(College of Food Science and Engineering,Ningbo University,Ningbo 315832,China)
Abstract: To investigate the removal of phenanthrene (Phe) from aqueous solutions,four macroalgae(Enteromorpha prolifera,Eucheuma,Gracilariopsis lemaneiformis,Laminaria japonica) were selected to prepare biochar at different temperatures (300,500 and 700 ℃).Structural characterization,including elemental analysis,Brunauer-Emmett-Teller (BET),Thermogravimetry (TG),Scanning Electron Microscopy (SEM),and Fourier Transform Infrared Spectroscopy (FTIR) analyses,were carried out to compare the differences among the four biochars.Eucheuma biochar (EBC500) had the highest specific surface area (271.51 m2·g–1) and the highest Phe removal rate (96.36%).Kinetic model fitting showed that the adsorption of EBC500 was determined by a combination of chemical and physical adsorption and intraparticle diffusion.EBC500 was fitted,using the Langmuir and Freundlich equations.The fitted R2 values were greater than 0.93.EBC500 exhibited both monolayer and multilayer adsorptions.Regeneration experiments showed that the removal rate of Phe was higher than 98%.
Key words: macroalgae biochar;structural characterization;phenanthrene;adsorption mechanism
1 Introduction
Polycyclic Aromatic Hydrocarbons (PAHs) are aromatic hydrocarbons and contain two or more benzene rings[1].They have been identified as major organic pollutants that affect human health because of their toxicity,heredity,mutagenicity,and carcinogenicity[2-3].PAHs are mainly caused by the incomplete combustion of fuels,which combines with rainwater to form aqueous solutions and eventually contaminate foods through soil irrigation and other means,causing irreversible damage to the human body[4-5].The concentration of PAHs in aquatic environments is low owing to its low solubility.Compared to high-ring PAHs with 4-6 rings,low-ring PAHs with 2-3 rings are more hydrophilic.Many studies have shown that PAHs in aqueous solutions are dominated by tricyclic phenanthrene (Phe)[6-7].In addition,PAHs are non-polar compounds and most are enriched in the soil,and previous studies have mostly focused on atmospheric and soil environments[5].In recent years,a large amount of industrial wastewater containing PAHs such as naphthalene,Phe,and pyrene has been discharged into water environments,and they do not only cause serious environmental pollution,but also pose a great danger to human health.Therefore,an efficient,green,and safe method of removing PAHs from aquatic environments is urgently needed.
At present,the main methods for removing PAHs from aqueous solutions are chemical,physical,and biological methods[8-10].The removing of PAHs using chemical methods involves the use of chemical reagents,but large amounts of chemical reagents can cause secondary pollution[11].Biological methods mainly use the metabolism of microorganisms,algae,and plants to convert PAHs into harmless substances or degrade them directly,but they have certain limitations owing to the restricted requirements of the growth environment of microorganisms.Physical adsorption has been widely studied owing to its low preparation price,easy availability of raw materials,and good removal effect.The most common adsorbents are activated carbon and biochar.Compared with activated carbon,biochar has the advantages of low cost,simple preparation,high recyclability,and environmental protection[12-13].In addition,biochar has a large specific surface area,porous and rich functional groups,and other structures with strong adsorption capacity for pollutants[14-15].So biochar is often used as an effective adsorbent.
The adsorption of PAHs by biochar is mainly influenced by the type of raw materials,pyrolysis temperature,and physicochemical properties such as specific surface area,pore size structure,and functional groups[16-17].Wood,rice husk,manure,algae,and other raw materials can be used to prepare biochar for the adsorption of PAHs[18].Recent studies have also shown that algae biochar is effective in the removal of PAHs from aqueous solutions,and most of these studies have focused on the removal effect of certain raw material biochar on PAHs[14,19].However,there is no comprehensive comparison of different algae biochars and their adsorption mechanism on PAHs.
In this study,to investigate the removal of phenanthrene (Phe) from aqueous solution,four macroalgae (green algaeEnteromorpha prolifera,red algaeEucheuma,Gracilariopsis lemaneiformis,and brown algaeLaminaria japonica) were selected to prepare biochar at 300,500,and 700 ℃.Structural characterization,including elemental analysis,Brunauer-Emmett-Teller (BET),Thermogravimetry (TG),Scanning Electron Microscopy (SEM),and Fourier Transform Infrared Spectroscopy (FTIR) analyses,were conducted to compare the differences between the four biochars.The adsorption mechanism of Phe by algae biochar was also investigated using adsorption kinetics and adsorption isotherms.This study provides a new approach for the removal of PAHs from aqueous solutions and provides a basis for the preparation of algae biochar.
2 Materials and methods
2.1 Materials and chemicals
Laminaria japonica,Enteromorpha prolifera,Eucheuma,Gracilariopsis lemaneiformiswere purchased from the Ningbo Lulin Market.All the chemicals were of analytical grade.Phe standard solutions (1 000 mg·L–1in methanol) were purchased from Tanmo Quality Inspection Standard Material Center.
2.2 Preparation of algae biochar
Four macroalgae were washed and dried (60 ℃,24 h).Biochar was prepared using an oxygen-limited slow-cracking method in a tube furnace (SGL-1200).The four types of air-dried algae were ground and sieved through 80 mesh sieve,respectively.The sieved algae were weighed to 9 g,packed into a quartz tube,and then blown in N2for 5-10 min to remove excess air in the furnace.The pyrolysis temperatures used were 300,500,and 700 ℃,and the heating rate was at 5 ℃·min–1.The maximum temperature attained was maintained for 2 h.The tube furnace was filled with N2throughout the process until the temperature decreased to ambient temperature.After the pyrolysis process,the biochars were ground and sieved.Afterward,they were soaked in a distilled aqueous solution for 12 h and washed with NaOH and HCl to remove more ash.Finally,Eucheuma,Gracilariopsis lemaneiformis,Laminaria japonica,andEnteromorpha proliferabiochars were obtained under pyrolysis conditions at 300,500,and 700 ℃,and labeled as EBC300,EBC500,EBC700;GLBC300,GLBC500,GLBC700;LJBC300,LJBC500,LJBC700;EPBC300,EPBC500,EPBC700,respectively.
2.3 Characterization of macroalgae biochar
The biochar yield was calculated using Eq.(1).
whereYis the yield;mis the mass of biochar;m0is the mass of the biomass (g).The pH was measured using a pH probe (SL1000,Hach,USA) at a biochar-deionized water ratio of 1 g vs 20 mL after shaking for 4 h and standing for 5 min[20].The surface morphology of the biochar was analyzed using SEM (MIRA3,TESCAN).The functional groups were analyzed using a FTIR(Tensor27,Bruker Company,Germany) at 400-4 000–1cm at resolution of 4 cm–1[21].A Vario elemental analyzer (Elementar Company,Germany) was used to analyze the elemental composition.Analysis of the pore structure of biochar was performed using a fully automated specific surface area and micropore pore analyzer (HD88) (ASAP2020HD88,Atlanta,GA,USA).TG analysis was performed using a high-temperature simultaneous thermal analyzer (SEIKO,Shanghai,China) to check the stability of the biochar samples.
2.4 Sorption experiments
A mixed background solution of 0.01 mol·L–1CaCl2and 200 mg·L–1NaN3was prepared to reduce microbial activity.A 0.2 g·L–1Phe standard application solution was also prepared.A certain volume of the application solution was dissolved in the background solution to prepare a 300 μg·L–1solution to be adsorbed.The ratio of methanol to the aqueous solution did not exceed 1:100 to avoid co-solvent effect.Each adsorption test was performed in a 200 mL glass conical flask by adding 0.03 g of biochar and to 100 mL of the Phe solution to be adsorbed.The solution was initially adjusted to pH 7,sealed,shaken for 18 h at 25 ℃,and then passed through a 0.45 μm aqueous filter membrane.The filtrate was subjected to solid-phase extraction to determine the Phe concentration,and three parallel experiments and one blank control experiment were set up.
2.4.1 Sorption kinetics
Biochar of 0.03 g was added to 100 mL of Phe solution at mass concentration of 300 μg·L–1.The initial pH of the solution was adjusted to 7 and shaken at 25 ℃for 2,3,4,6,10,14,and 18 h,and then passed through a 0.45 μm aqueous filter membrane.The filtrate was subjected to solid-phase extraction to detect its Phe concentration,three sets of parallel experiments and one set of a blank control experiment were set up.
2.4.2 Adsorption isotherms
Biochar of 0.03 g was added to 100 mL of Phe solution at mass concentrations of 10,50,100,200,300,400,and 500 μg·L–1,respectively,and the initial pH of the solution was adjusted to 7.After shaking at 25 ℃for 24 h,they were subjected to the process described above in the adsorption kinetics experiments.
2.4.3 Initial pH of solution and biochar dosage experiments
The initial pH values were adjusted to 3,5,7,9,and 11 to determine the effect of the pH of the initial solution.Biochar (0.03 g) was added to Phe solution(100 mL) at mass concentrations of 300 μg·L–1.The solution was shaken at 25 ℃ for 24 h,filtered,and subjected to the process described in the above adsorption kinetics experiments.
The effect of injection amount on adsorption was investigated.The dosage was set to 0.01,0.02,0.03,0.04,and 0.05 g.Thereafter,100 mL of Phe solution with mass concentration of 300 μg·L–1was added,and the initial pH of the solution was adjusted to 7.The solution was shaken at 25 ℃ for 24 h,and subjected to the process described above for the adsorption kinetics.
2.5 Recovery of biochar
To improve the utilization of biochar,a regeneration experiment was performed.The adsorbed biochar was collected and dried,and a number of dry 100 mL conical flasks were prepared.Biochar and organic reagents (dichloromethane and n-hexane) were added into these conical flasks at a solid-liquid ratio of 1 g vs 40 mL,respectively.They were then sealed and placed on a shaker at 25 ℃ for 24 h,dried,and set aside.The adsorption conditions were 0.03 g of biochar,initial pH 7 of the solution,18 h of adsorption time.
2.6 GC-MS analysis of Phe
The concentration of Phe in the solution was determined using gas-phase dual-mass spectrometry.Chromatographic conditions were as followed: DB-5MS capillary column (30 m×0.25 mm×0.25 μm),non-split mode injection,injection volume 1.0 μL,high-purity He(purity >99.999%) as carrier gas,flow rate 1.0 mL⋅min-1,inlet temperature 280 ℃.The mass spectrometry conditions were as followed: electron bombardment ion source (EI) 70 eV,ion source temperature 280 ℃,transmission line temperature 280 ℃,quadrupole temperature 150 ℃,solvent delay time 4 min,multiple reaction monitoring mode (MRM),qualitative ion pair and collision energy 178.1>176.1 and 40 eV,and quantitative ion pair and collision energy 178.1>152.1 and 20 eV.
The removal rate of biochar was calculated using Eq.(2).
whereC0is the initial mass concentration of the Phe solution,mg·L–1;Ceis the equilibrium mass concentration of the Phe solution,mg·L–1.
Biochar adsorption was calculated using Eq.(3).
whereqeis the equilibrium adsorption amount of Phe,mg⋅g–1;mis the mass of biochar,g;C0andCeare as represented above;andVis the volume of the Phe solution,L.The isotherms of Phe adsorption on biochar were analyzed using the Langmuir and Freundlich models.The Langmuir model is mainly used to describe the adsorption of a homogeneous single-molecule layer on the adsorbent surface,in which the adsorbent molecules do not affect each other.The Freundlich model is used to describe the adsorption process of heterogeneous multimolecular layers.
The Langmuir model is described using Eq.(4).
whereqeis the equilibrium adsorption amount,mg⋅g–1;Qmis the maximum adsorption amount,mg⋅g–1;andKLis the Langmuir constant,which represents the adsorption intensity.
The Freundlich model is described using Eq.(5).
whereKFis the Freundlich constant,which represents the adsorption capacity,andNis the adsorption strength.
3 Results and discussion
3.1 Biochar characteristics
3.1.1 Biochar yield and pH
The product yields are shown in Table 1,and the four macroalgae biochar yields ranged from 31.31%-39.24%.There was a little difference in the yield of pyrolysis biochar from the different algae species.These results are consistent with the findings of Roberts[22].The highest biochar yield of 39.24% was obtained from EPBC500,and the second was 34.68% from EBC500.This may be related to the lignocellulose content because a higher lignocellulose content results in higher biochar yield[12,23-24].
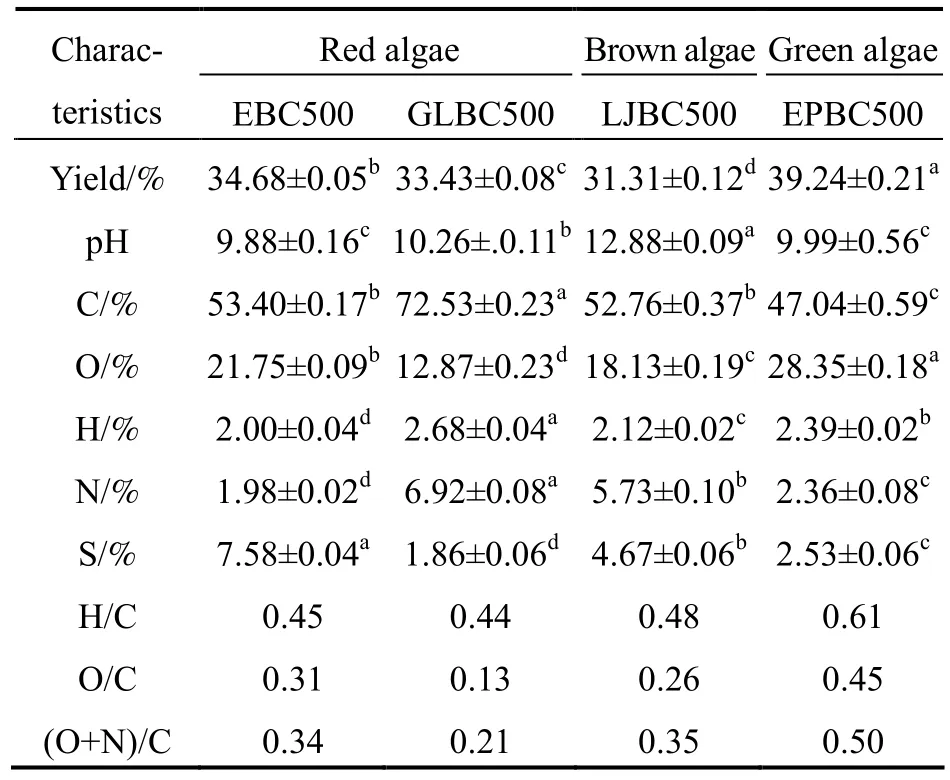
Table 1 Yield,pH and elemental analysis of algal biochar
Because there is a certain amount of alkaline substances in biochar,it is generally alkaline[25].The pH values of biochar produced from different algae are shown in Table 1,ranging from 9.88 to 12.88.The biochar produced from brown algae had a higher pH than those produced from red algae[22].Among them,EBC500 had the lowest alkalinity,with pH reaching 9.88.
3.1.2 Biochar elemental analysis
Biochar from the pyrolysis of different macroalgae had different elemental compositions,probably owing to the different levels of elemental loss during the pyrolysis process.The C content in red algae biochar was higher than that in brown algae biochar[22].GLBC500 had the highest C,H,and N contents,reaching 72.53%,2.68%,and 6.92%,respectively.The lowest C content was found in EPBC500.The H/C value was generally used to determine the aromaticity of biochar.The smaller the H/C value,the more aromatic it is.O/C and (O+N)/C were used to indicate the polarity of biochar,and the larger the ratio,the more polar it is[19].The highest values of H/C,O/C,and (O+N)/C were observed in EPBC500,reaching 0.61,0.45,and 0.50,respectively.The lowest H/C and O/C were observed in GLBC500,indicating that GLBC500 had the highest loss of carboxylic acids and hydroxyl groups during the pyrolysis process[25].In addition,EBC500,GLBC500,and LJBC500 had low aromaticity,whereas red algae EBC500 and GLBC500 had lower polarity and higher aromaticity than other two biochar.
3.1.3 SEM analysis of biochar
SEM was used to visualize the pore structure of biochar.The surface morphologies of different algae biochars at different temperatures are shown in Fig.1.It can be seen that macroalgae biochar had obvious pore structures,probably owing to the ash removed from the biochar via soaking in water,washing with acid,and alkali to increase the specific surface area of the pores.However,there was a significant difference in pore size among the different biochars.This may be related to the different contents of cellulose,hemicellulose,and lignin in the different algae.However,the overflow of water and volatile fraction during the pyrolysis process may have caused the formation of porous structures with different sizes and quantities[26-29].

Fig.1 Pyrolysis temperature and SEM of biochar
The pore structure of the biochar prepared at different pyrolysis temperatures differed significantly.With the increase in temperature,the biochar surface formed a large pore size.There was no obvious pore structure on the surface of EBC300,and this may be related to the incomplete charring of hemicellulose and lignin in the biomass[30].In contrast,EBC700 formed microporous structures (<2 nm) on the surface owing to full charring.
3.1.4 BET analysis of biochar
N2adsorption-desorption isotherm curve is shown in Fig.2.All the isotherms of the four biochars had hysteresis loops.The adsorption isotherms of all the algae biochars were type IV.At relatively low pressure,EBC500 adsorbed more liquid nitrogen,indicating that it has a good adsorption capacity and may contain micropores.According to IUPAC classification,hysteresis loops of EBC type were H3,and those of GLBC500,LJBC500,EPBC500 were H4.Hysteresis loops of types H3and H4corresponded to wedge-shaped and narrow fissure pores,respectively,and there was no obvious saturation adsorption plateau in the hysteresis isotherm,indicating the pore structure was very irregular.
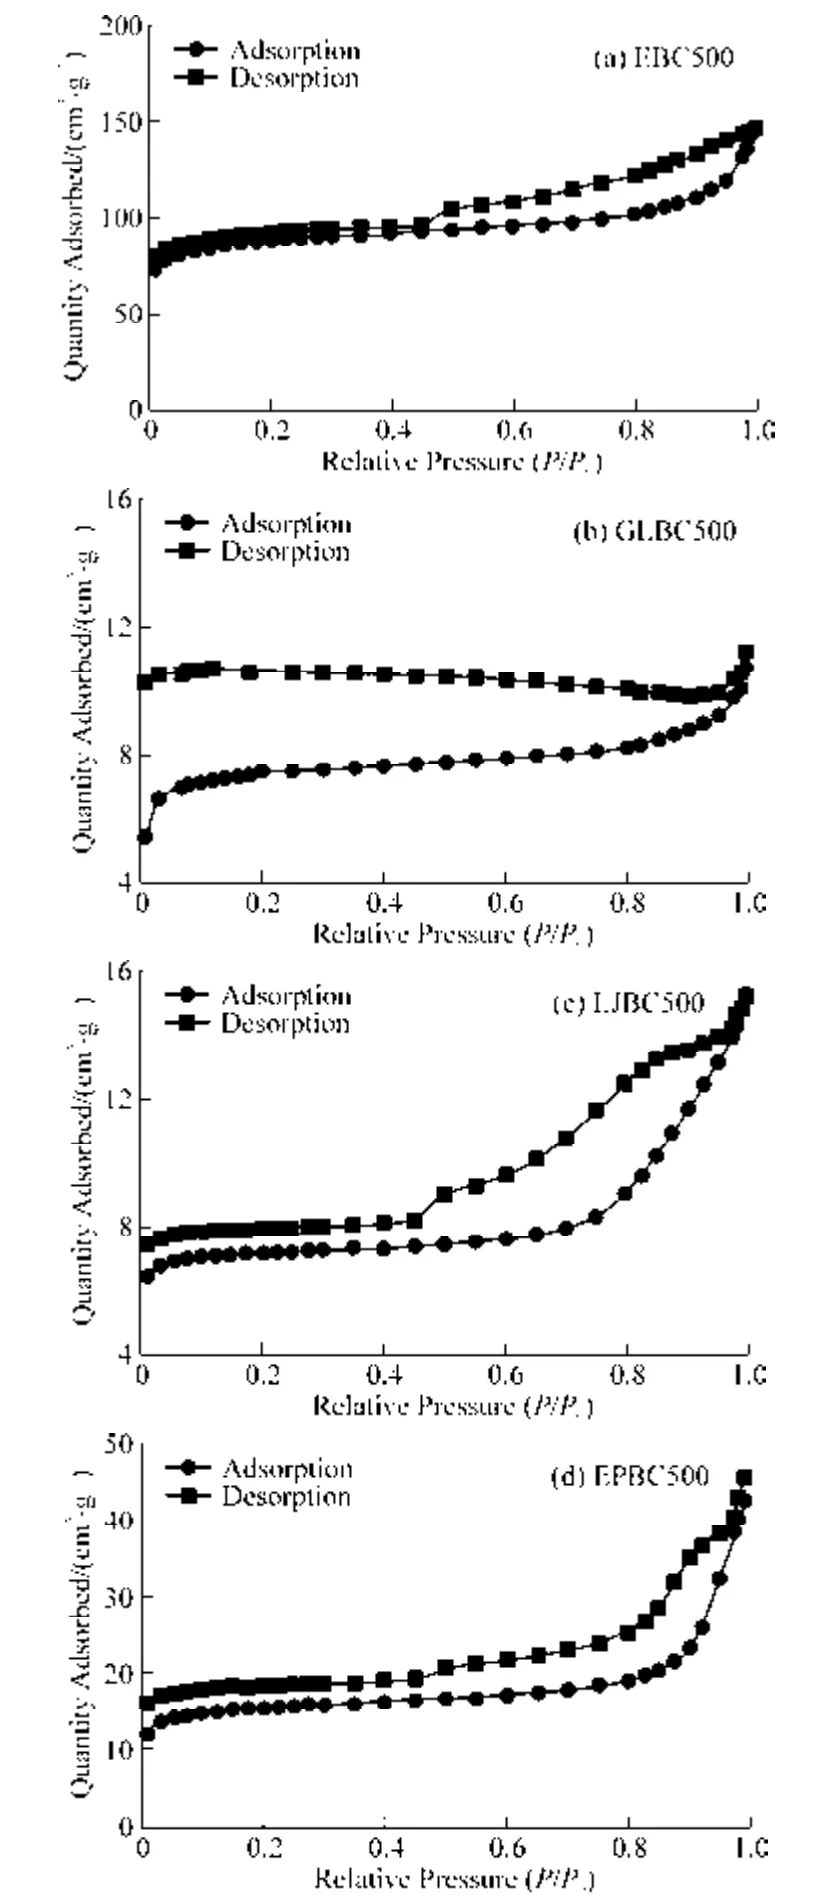
Fig.2 N2 adsorption-desorption isotherm curves of macroalgae biochar
The results of BET analysis are shown in Table 2.It can be seen that four macroalgae biochar have a large specific surface area.This was because the acid-base washing of the biochar removed more ash and increased the specific surface area of the biochar.However,the specific surface area and pore volume of biochar were greatly influenced by the raw material.The specific surface area and pore volume of EBC500 were 271.51 m2·g–1and 0.225 2 cm³·g–1,respectively,while the specific surface area of GLBC500,EPBC500,and LJBC 500 were 22.67,48.31,and 16.30 m2·g–1,respectively.It can be seen that the specific surface area of EBC500 was 6-16 times larger than that of the other biochar.This result is consistent with the SEM results above.As shown in Table 2 and Fig.3,the pore structures of the four macroalgae biochars are in the mesoporous range(<2 nm).
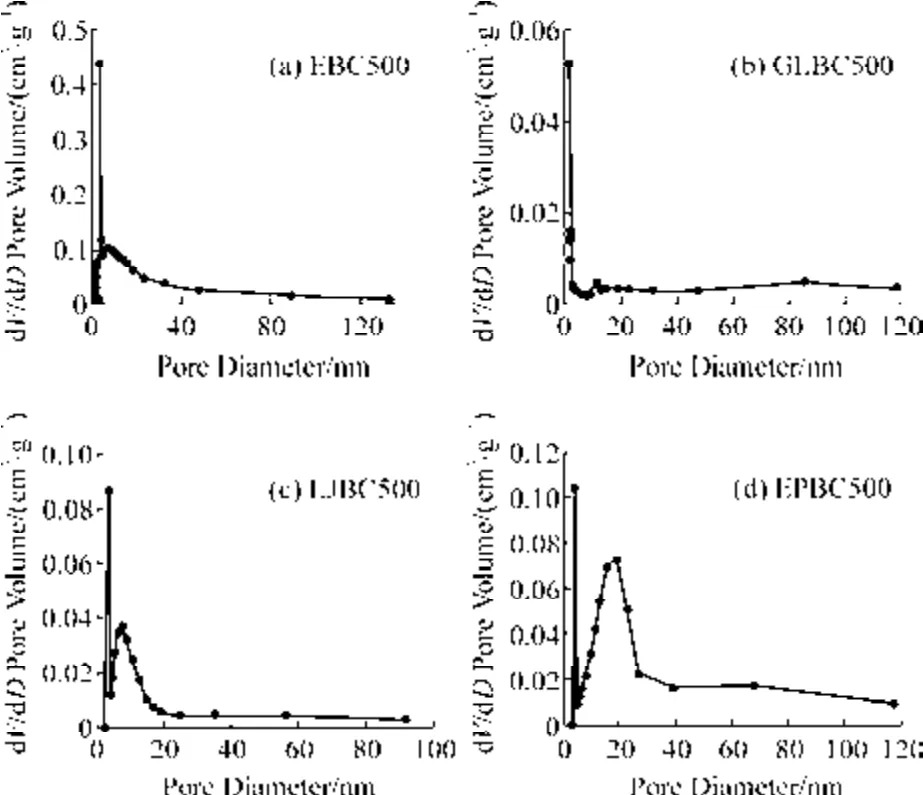
Fig.3 Pore size distribution of macroalgae biochar
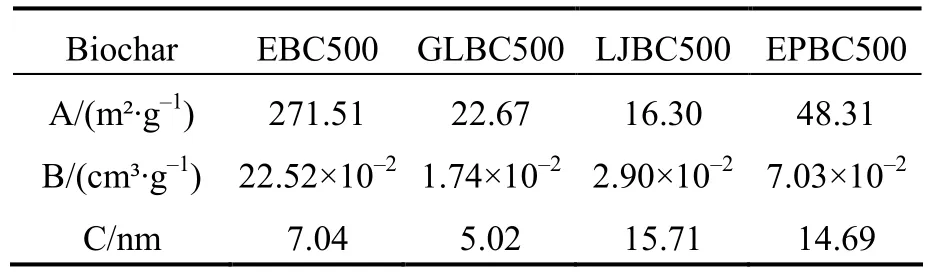
Table 2 Specific surface area and pore size structure of algal biochar
3.1.5 FTIR analysis
The differences in the functional groups of biochar can be used to determine the adsorption mechanism of organic pollutants[28].The FTIR spectra of the four types of biochar are shown in Fig.4.The band at 3 750-3 000 cm–1represents the stretching vibration of O—H and N—H in the carboxyl group[31].Carboxyl and alkyl groups are the main functional groups for the adsorption of PAHs[32].As shown in Fig.4,EBC500 and EPBC500 had peaks in the same band,indicating that both of them contain carboxyl groups,triple bond,and cumulative double bond regions (2 400-2 100 cm–1).EBC500 and EPBC500 had a weak O=C=O absorption near the 2 373 cm–1band.The peaks at 1 506 cm–1and 1 613 cm–1may be attributed to the C=C double bond stretching vibrations of the aromatic rings[33].The 1 453,1 240,and 1 112 cm–1peaks correspond to the X—H in-plane bending vibration and X—Y stretching vibration,respectively.The aliphatic O=C=O and —OH groups(1 160-1 030 cm–1) represent the oxygen-containing functional groups of cellulose[34].EBC500 had a clear peak at the 1 112 cm–1band,indicating the presence of aromatic compounds and oxygen-containing functional groups.The contamination of organic compounds is related to oxygen-containing functional groups[19].
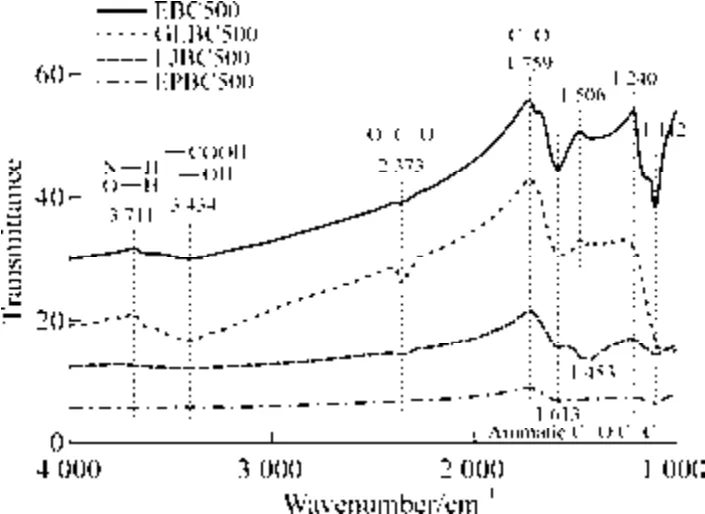
Fig.4 FTIR spectrum of algal biochar
3.1.6 TG analysis of biochar
TG and DTG analyses reflect the mass decomposition of feedstock when subjected to heat.Fig.5 shows the thermogravimetric analysis of the four biochars,and the four biochars were divided into three pyrolysis stages as shown.The first stage was mainly related to the evaporation of water.In the first stage,the loss rate of EPBC500 was the highest with a removal rate of 8.38%,indicating that the water content of EPBC500 was relatively high.The second pyrolysis stage was mainly related to the decomposition of cellulose and hemicellulose[35].The loss rates of EBC500,GLBC500,LJBC500,and EPBC500 in the second stage (160-495 ℃,75-515 ℃,165-535 ℃,and 250-650 ℃) were 43.86%,75.77%,37.87%,and 45.96%,respectively.In contrast,GLBC500 had the highest loss rate,whereas LJBC500 had the lowest loss rate in the second stage.The final stage was the lignin decomposition stage.Lignin has a high aromatic structure,and its content is related to biochar yield[36].Lignin has a wide range of pyrolysis temperature and is relatively difficult to degrade[37].The weight loss rates of red algae EBC500 and GLBC500 at approximately 600 ℃,and LJBC500 at approximately 700 ℃ tended to level off rapidly;however,the weight loss rate of EPBC500 was still in a steady decreasing trend,probably owing to the different components of raw materials.
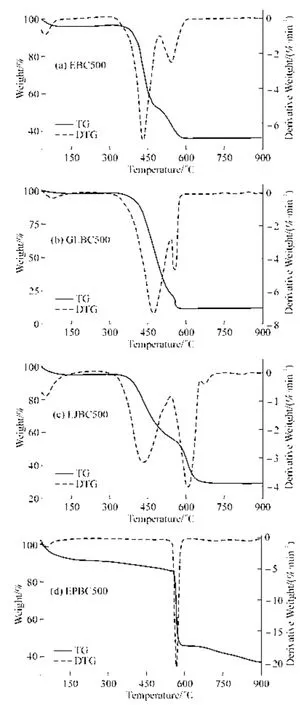
Fig.5 TG analysis of macroalgae biochar
3.2 Screening of raw materials
The adsorption capacity of biochar for organic pollutants is mainly influenced by the type of feedstock[25,38].Fig.6(a) shows the removal of Phe by different macroalgae biochars.The removal ability of Phe by biochars prepared from different raw materials differed significantly.GLBC500 had the lowest removal ability of Phe,that is,a removal rate of 12.45%.In contrast,the removal rate of EBC500 (94.69%) was 7.8 times higher than that of GLBC500,and the adsorption capacity was 45.55 mg·g–1.In addition,the removal rates of EPBC500 and LJBC500 were 67.02% and 66.37%,respectively.This may be closely related to the composition of the raw algae materials[39-40].Owing to the different contents of cellulose,hemicellulose,and lignin in the raw algae materials,the volatile fraction and ash content produced after pyrolysis varied greatly,thus affecting the adsorption ability of biochar[41].A relationship was also observed between the adsorption capacity and specific surface area of biochar.The large specific surface area of biochar possesses more pore sizes,thus allowing the target material to be trapped in the pores for removal[30].These results are consistent with the BET results.Therefore,EBC500 was selected as the raw material with the best adsorption capacity.

Fig.6 Adsorption of four macroalgae biochar (a),Effect of pyrolysis temperature on the adsorption of EBC (b),Adsorption kinetics of EBC500 on Phe (c),Adsorption isotherm of EBC500 on Phe (d),Effect of variables on the adsorption of Phe by EBC500: pH effect (e),dosage effect (f)
3.3 Effect of pyrolysis temperature
Pyrolysis temperature is an important factor that can affect the basic structure of biochar.Fig.6(b) shows the removal of Phe by EBC500 at different pyrolysis temperatures.EBC300 had the lowest Phe removal rate.This could be attributed to incomplete charring of the biomass at low temperature,thus failing to produce a porous structure,which resulted in a poor adsorption capacity.As the pyrolysis temperature increases,the volatile fraction of the biomass decomposed and formed rich porous structures on the surface of the biochar.It may also be that the destruction of aliphatic alkyl and ester groups during biochar formation resulted in the formation of micropores on the biochar surface[42].EBC500 and EBC700 had the same removal effect(P<0.05) on Phe in the aqueous solution,and the removal rate was more than 95%.Considering economic feasibility,EBC500 was selected for a follow-up study.
3.4 Adsorption kinetics of EBC500
The kinetic curves of the adsorption of Phe by EBC500 are shown in Fig.6(c).The adsorption was in two stages.The first stage had rapid adsorption,and the rapid increase in adsorption was mainly concentrated during the first 10 h,this might be due to the high number of adsorption sites on the adsorbent.The second stage had slow adsorption,which continued before reaching the adsorption equilibrium stage.As the adsorption time increased,the adsorption amount showed small fluctuations until the adsorption equilibrium was attained.This was mainly because the adsorption sites of the adsorbent were continuously occupied by the adsorbent mass,and the adsorption sites were reduced,thus reducing the adsorption capacity of the biochar.The equilibrium adsorption amount was 24.01 mg·g–1at 10 h,and the removal rate of Phe from the aqueous solution was 92.51%.In addition,a maximum removal rate of 94.93% was attained at an adsorption time of 18 h,and the maximum adsorption amount was 24.27 mg·g–1,but was not significantly different from 10 h (P>0.05).This indicated that the adsorption of Phe in the aqueous solution by EBC500 reached an adsorption equilibrium at 10 h and had a good removal capacity.
Pseudo first order and pseudo second order kinetic models and internal diffusion model were fitted,and the fitted results are shown in Table 3.The fittedR2results of the pseudo-primary and pseudo-secondary kinetic models were 0.936 and 0.968,respectively,theR2values were greater than 0.930,and their theoretical and measured values were consistent.This indicates that the adsorption of Phe in the aqueous solution by EBC500 was based on both chemisorption and physical adsorption[43-44].TheR2value of the fitted internal diffusion model was 0.971,which may be as a result of the combined effect of adsorption sites on the surface of the biochar and intraparticle diffusion.

Table 3 Kinetic and isothermal model fitting parameters of EBC500 on Phe adsorption
3.5 Adsorption isotherm
Fig.6(d) shows the isothermal adsorption curve of Phe by EBC500.As the adsorption concentration increased,the adsorption amount increased,but the removal rate decreased.The removal rate decreased rapidly at concentrations of 50-100 μg·L–1and then tended to decrease gently.This may be due to the decrease in the adsorption sites of the biochar when the concentration increased,followed by increasing in contact area caused by the increase in adsorbent concentration.
The results of the adsorption experiments were fitted using the Langmuir and Freundlich equations,and the fitted parameters are shown in Table 3.As shown in table,theR2values of the two models are 0.934 and 0.974,respectively,indicating that the adsorption of Phe by EBC500 was not only a monolayer adsorption but also a multilayer adsorption,and the Freundlich model was better fitted.It is generally considered that a 1/nvalue corresponds to the ease of adsorption,and a 1/nvalue between 0.1-0.5 indicates that the adsorbent is easily adsorbed[45].The maximum adsorption capacity fitted by the Langmuir equation was 58.976 mg·g–1and was different from the model fitting result of adsorption kinetics.This suggests that EBC500 may have better removal ability at high Phe solution concentrations.
3.6 Effect of biochar dosage and initial pH
Fig.6(e) shows the effect of solution pH on the adsorption of Phe by EBC500.As shown in the Figure,the adsorption properties of biochar were influenced by the lower pH of the solution than that of the feedstock type.The solution with pH 3 reached a maximum removal rate of 96.36% for Phe.With increasing in pH,the removal rate fluctuated,and even when the removal rate reached its lowest at pH 11,it was not less than 94.58%.This indicates that an acidic environment is more favorable for the adsorption of Phe in an aqueous solution by EBC500,and this is consistent with the findings of Nallasivam[46],because the initial pH of the solution may have affected the positive charge on the surface of the biochar,and affected the electrostatic interaction with the target[47].
The amount of biochar had a significant effect on adsorption.The effect of biochar dosage on the Phe removal rate is shown in Fig.6(f).The removal rate of Phe gradually increased with increase in dosage,but the adsorption amount gradually decreased.The maximum removal rate was 99.74% at 0.05 g of biochar,with an adsorption amount of 15.61 mg·g–1.The highest adsorption amount was 63.84 mg·g–1at 0.01 g of biochar;however,the removal rate was 81.57%,which was probably due to the decrease in biochar utilization rate as the amount of biochar increased.Conversely,adsorption and removal rates increased with an increase in the amount of biochar.
3.7 Recycled biochar
Organic solvent-modified biochar can prevent the clogging of pores caused by organic compounds[41].The experimental results showed that the removal rate of Phe from aqueous solution was as high as 98.49% for EBC500 after washing with hexane.This may be due to the increase in the number of carbonyl groups on the surface of the biochar after the elution of organic reagents,which enhanced the hydrophobicity of the surface of biochar and was more conducive to the removal of organic substances in aqueous solutions[48].In addition,the EBC500 washed with dichloromethane reached 96.46%.This indicates that organic reagent can effectively remove the Phe trapped in the pore size of biochar and achieve the purpose of biochar regeneration.
4 Conclusion
The basic structure and adsorption performance of biochar were mainly influenced by the raw material and carbonized temperature.Red algae biochar had the highest C content and was relatively less polar and more aromatic.The opposite was true for the green algae.Red algae EBC500 is characterized by oxygen and carboxyl functional groups,large aromaticity,low polarity,large specific surface area (271.51 m2·g–1) and rich pore structure,thus it has good adsorption capacity for Phe.Kinetic fitting results showed that the adsorption of EBC500 was determined by a combination of physical,chemical,and intraparticle diffusion.The Langmuir and Freundlich model were used to fit the EBC500 and the results showed that the EBC500 has both monolayer and multilayer adsorption.The most economical and favorable adsorption conditions of EBC500 were achieved when the initial pH of the solution was 3 and the biochar dosage was 0.3 g,the removal rate was as high as 96.36%.The recycled biochar still has good adsorption properties.Therefore,EBC500 can be applied to the treatment of Phe in aqueous solution.The resource-rich macroalgae were used as raw material,and four kinds of macroalgae biochar were compared and provided a theoretical basis for the adsorption on phe in water bodies.In addition,the adsorption of regenerated biochar on Phe was investigated.After the study,it was found that the prepared biochar has high adsorption capacity for phenanthrene,so it can be applied in the treatment of daily drinking water.
Acknowledgments
We are grateful to Mr.Zhang Weilai of State Key Laboratory of Heavy Oil Processing,China University of Petroleum (Beijing) for his kind help.We also want to thank the editor and anonymous reviewers for their valuable comments and suggestions to this paper.
