Development of an improved three-dimensional rough discrete fracture network model: Method and application
2024-01-07PeitaoWangChiMaBoZhangQiGouWenhuiTanMeifengCai
Peitao Wang*,Chi Ma*,Bo ZhangQi GouWenhui TanMeifeng Cai
a Key Laboratory of Ministry of Education for Efficient Mining and Safety of Metal Mine,University of Science and Technology Beijing,Beijing 100083,China
b State Key Laboratory of Water Resource Protection and Utilization in Coal Mining,CHN Energy Shendong Coal Group Co.,Ltd.,Beijing 102201,China
c School of Civil and Resources Engineering,University of Science and Technology Beijing,Beijing 100083,China
Keywords:
ABSTRACT Structure plane is one of the important factors affecting the stability and failure mode of rock mass engineering.Rock mass structure characterization is the basic work of rock mechanics research and the important content of numerical simulation.A new 3-dimensional rough discrete fracture network(RDFN3D) model and its modeling method based on the Weierstrass-Mandelbrot (W-M) function were presented in this paper.The RDFN3D model,which improves and unifies the modelling methods for the complex structural planes,has been realized.The influence of fractal dimension,amplitude,and surface precision on the modeling parameters of RDFN3D was discussed.The reasonable W-M parameters suitable for the roughness coefficient of JRC were proposed,and the relationship between the mathematical model and the joint characterization was established.The RDFN3D together with the smooth 3-dimensional discrete fracture network (DFN3D) models were successfully exported to the drawing exchange format,which will provide a wide application in numerous numerical simulation codes including both the continuous and discontinuous methods.The numerical models were discussed using the COMSOL Multiphysics code and the 3-dimensional particle flow code,respectively.The reliability of the RDFN3D model was preliminarily discussed and analyzed.The roughness and spatial connectivity of the fracture networks have a dominant effect on the fluid flow patterns.The research results can provide a new geological model and analysis model for numerical simulation and engineering analysis of jointed rock mass.
1.Introduction
Natural rock masses consist of a large number of structural planes at many different scales,making this geological body inhomogeneous and anisotropic.The presence of structural planes weakens its mechanical properties and controls its failure mode.The structure-induced deformation and failure modes of the surrounding rocks of fractured rock masses are complex under the excavation disturbance.Some field observations,such as Mont Terri [1],Mine-by [2],AECL underground laboratory [3],Jinping Hydropower Station [4],and Baihetan Hydropower Station [5],all show complex deformation and asymmetric damage modes of surrounding rocks at different depths.Due to the influence of discontinuities as well as in-situ stresses,the deformation and damage patterns of the surrounding rocks in the mining area are often asymmetrically distributed under the influence of mining disturbances [6-8].
The damage patterns of rock masses with different fracture distributions vary significantly under different mining conditions.In open pit or shallow underground mining,the damage pattern of rock masses is significantly controlled by structural planes.The damage patterns of surrounding rocks [9] or slopes with different orientations[10]show significant anisotropic characteristics.With the excavation disturbance,the strength and damage modes of the surrounding rock affected by the structure planes are more complicated,showing the characteristics of asymmetric damage[11]and zonal rupture [12].The structural planes play a controlling role in the deformation or damage pattern of the surrounding rock[13-15].Therefore,the geometric and mechanical properties of structural planes in rock masses are important for studying the deformation and damage patterns.Many scholars have done work on the influence of joint distribution on the mechanical properties of rock masses.Xu et al.[16] studied the damage pattern of the surrounding rock in a laminated tunnel excavation and found that there was a significant relationship between the damage pattern and the orientation of the structural planes,and the tunnel damage zone was mainly concentrated in two extension directions under isotropic stress conditions.Cho et al.[17] obtained the influence law of the geometric distribution on the overall deformation and strength of the fractured rock mass by conducting a study on the anisotropic mechanical characteristics of different types of laminated rocks.There are generally several groups of randomly distributed discontinuities in rock masses.Zhang et al.[18]evaluated the influence of the creation of intrinsic microfractures on the rock strength and concluded that the friction angle decreases when the macroscope fracture become established.Marschall et al.[19] and Blümling et al.[20] found significant asymmetric distribution characteristics of rock damage in one layered rock circular tunnel in the Swiss Jura Mountains and one soft soil layer.Wu et al.[21]discussed the evolution of flow and transport processes in the fracture network and pointed out the importance of the fracture traces identified from wellbores during the process of hydraulic stimulation.Although some scholars point out that the deformation characteristics will gradually become stress-induced failure as the rock pressure increases,the excavation opening provides a space-free surface for rock deformation and fracture.The structural planes still control the mechanical response of the jointed rock masses.Therefore,the existence of discontinuities within the rock mass is still one of the main factors influencing the mechanical properties and controlling the damage mode of fractured rock masses.
The natural rock mass has undergone complex tectonic movement,weathering,erosion,and other geological effects.Numerous joints and fractures of different sizes and directions have been created.These discontinuities cross each other to form a complex three-dimensional fracture network,which not only greatly changes the mechanical properties of the rock,but also seriously affects the seepage characteristics of the rock body.Accurately characterizing the geometric properties of complex 3D fracture networks is of great importance in the construction of many projects,such as dams,nuclear waste storage,underground CO2storage,and underground oil extraction.The morphology of the complex fracture structure within the fracture network,especially the roughness characteristics of the joints,is an important factor controlling the mechanical properties of the rock mass [22].The equivalent rock mass (ERM) characterization is a typical method for the numerical modeling,which constructs an equivalent rock mass model including the geometric and mechanical effects of the structural surface by establishing a discrete fracture network(DFN) model (Fig.1a).The DFN model is a stochastic modeling of fracture networks that originated from the fluid percolation in natural fractures[23]and has been widely applied in rock engineering since the 1980s.Accurate characterization of the spatial rock structure is a prerequisite for more accurate analysis of the mechanical properties of the jointed rock mass.Robinson [24] proposed a method for rock fracture seepage studies using a stochastic simulation of a fracture network,which provided a good approach for the study of hydraulic properties.Wang et al.[25] conducted a numerical experimental study on the failure characteristics of fractured rock masses based on a DFN model and found that there is a significant size effect on the damage mode of joints rock.Zhou et al.[26]modeled the effects of rock joints on rock mass behavior based on the ERM technique.The suitability of the ERM technique was validated by the triaxial compression test.Li et al.[27]obtained the dominating fracture sets by discussing the range of fracture intersection lengths and mean intersection length when studying the connectivity parameters in naturally fractured reservoirs in the Upper Triassic Yanchang Formations in Ordos Basin based on the DFN model.To determine the scale size of representative elementary volume of a fractured rock mass,Li et al.[28]used the connectivity parameters and obtained a reasonable geometrical REV size.Their results clarified the importance of the intersection parameters of rough surfaces for the mechanical behavior of rock masses.DFN model is also widely used in the application of fluid flow behavior.Zhang et al.[29]proposed a flow model based on the DFN model to simulate the fluid flow process.Zheng et al.[30] pointed out the limitations of the DFN model based on the circular disc model and established elliptical disc model.The proposed model couples the orientation and rotation angle of long axis based on three coordinate transformations,which largely improves the DFN models for the rock mass representation.Numerical simulation based on the DFN models is an important method to study the mechanical properties and seepage characteristics of rock masses,which has been approved by many scholars.However,the spatial geometry of most 3D DFN models is often assumed to be planar or smooth planes(Fig.1a),the profile of which are usually straight (or smooth) traces (Fig.1b and c).The natural structural surfaces are not planar or smooth as assumed,but have certain roughness characteristics.A large number of engineering investigations found that the structural faces morphologically from large scale structural faces(folds or bedding planes,Fig.1d and e) [31],to small scale (cracks,fractures or joints,Fig.1f)[32]show certain roughness undulations,which will have a significant influence on the mechanical properties of rock masses.
Rough discontinuity planes present in natural rock masses have a great influence on the mechanical behavior,and more and more research has been focused on these aspects [22,33-35].The joint roughness coefficient (JRC) defined by Barton and Choubey [36]has been widely used to characterize the roughness pattern of joints.The JRC relies on the subjective judgment of the JRC on the roughness of structural surfaces,which is highly subjective and empirical.Many scientists have done a lot of research to characterize the geometric parameters of rocks in a quantitative way.The geometry developed by Mandelbrot to describe the roughness has been recognized by many scholars [37-39].Odling [40] discussed the relationship between JRC and fractal dimension and found that most of them approximately correspond to fractal curves.Then Odling measured the standard JRC with fractal dimensionDand height amplitudeG.The results show that JRC has a significant correlation withGandD.The coarsest joints (highest JRC)have a fractal dimension close to 1,while smooth joints (lowest JRC) have dimensions up to 1.5.The height amplitudeGincreases with increasing JRC,indicating that the roughness (size isgreater than 1 mm) becomes larger as the JRC increases.Nayak et al.[41] used fractal methods to analyze fractured rock masses and showed that natural discontinuities have self-similarity and selfsimulations.Majumdar et al.[42] simulated the rough surfaces using the Weierstrass-Mandelbrot (W-M) function.The generated rough surfaces were statistically similar to the real rock masses.Ju et al.[43] used a three-dimensional W-M function to simulate rough fracture surfaces and derived a modified local cubic law to calculate permeability.Xue et al.[44]developed a novel numerical method to evaluate fluid flow in the fracture network incorporating heterogeneous fracture apertures in 3D DFN models.The novel DFN model could provide a great improvement for the characterization of discrete discontinuities of jointed rock masses.Considering the roughness of a single fracture in the discrete fracture network,Wang et al.[45] proposed a two-dimensional rough discrete fracture network (RDFN2D) model which fully considers the rough characteristics of the fracture trace.The RDFN2D model was established including the sinusoidal traces,triangular traces,stepped traces,and fractal-based traces,which provides a new model to simulate the spatial distribution and rough geometric characteristics.The effect of the rough fracture network on the fracture mechanism of the jointed rock mass was investigated.The dominance of the joint roughness on the compressive and shear fractures was verified.They also suggested that the influence of joint roughness should not be neglected in the stability analysis of rock engineering.However,it should be noted that although the DFN modeling method can efficiently represent the rock structure,the full potential of the DFN model to capture stochastic variations can only be realized if the generated DFN geometry is statistically the same or similar to the real fracture network.It should be especially noted that although researchers have paid attention to the rough properties of 3D discontinuities,they have not conducted studies for rough 3D structural surface networks,but still for smooth types.The main reasons are:(1)The 3D surface characterization is relatively complex,and it is difficult to establish the connection with the actual structural surface.(2) The 3D smooth structural surface network is relatively easy to model by the 3D modeling software,but the 3D rough structural surface network modeling mechanism is complex and difficult to model.(3)In engineering,not enough attention is paid to the influence of rough structural surface network models.
Here,we developed a new 3-dimensional RDFN model that takes into account the roughness and waviness of the structure planes,which improves the characterization methods of discrete discontinuities.The single 3D structure was characterized based on the W-M fractal surface.The influence of the dominant parameters on the surface waviness was systematically discussed.Then,the 3-dimensional rough discrete fracture network model was established considering the orientation of different sets of discontinuities.The differences between the RDFN3D and DFN3D models generated by the same approach were compared and discussed.The export of the RDFN3D model to the commercial codes,e.g.,COMSOL Multiphysics,AutoCAD,and the PFC3D code,was realized,which will broaden the applicability in the stability analysis in rock engineering.
2.Characterization of rough surfaces
2.1.W-M Geometry in 3-dimension
The W-M function is a mathematical function used to describe fractal patterns and self-similarity.It was originally proposed by Weierstrass in 1872 to address the problem of continuous but non-differentiable functions.It was later extended by Mandelbrot in 1977 as a tool for describing fractal geometry.When using the W-M function for modeling,it is typically assumed that the object being modeled has fractal properties,i.e.,it exhibits self-similarity and scale invariance.This implies that the local parts of the object have similar structures to the whole and exhibit similar statistical properties at different scales.In addition,it is often assumed that the surface or structure of the modeled object has statistical regularities that can be described by fractal dimensions and other indicators.The W-M function is also used to describe surfaces or structures with roughness and waviness.It captures these features and provides a mathematical representation.These background descriptions and basic assumptions provide a theoretical foundation for the use of the W-M function in modeling.Yan and Komvopoulos [46] proposed a modified Weierstrass-Mandelbrot (W-M)function as expressed by Eqs.(1) and (2)
wherezis the height of the asperity of the rough surface;xandythe surface coordinates;Lthe sample length;Gthe fractal roughness of the surface(G>0);Dthe fractal dimension(2<D<3);γ the parameter of frequency distribution(γ>1).γ takes the value of 1.5 according to Komvopoulos and Ye [47];Mthe number of superimposed rough peaks on the surface of the rough structure and takes the value of 10;nthe frequency;nmaxthe upper limit,which is given by Eq.(2);Lsthe cutoff length that limits the highest roughness frequency up to 1/Ls;and φm,na random quadrant distributed within [0,2π].
The 3D W-M surfaces were built based on the MATLAB code.Given a certain size in thex-andy-plane,a point cloud grid could be obtained,and theZ-directional position is obtained according to the W-M function.To efficiently build the 3D surfaces,we introduce another parameter,the surface precision (Pr) of the 3D surface,which represents the precision of the mesh grid.In the twodimensional W-M function,Pris defined as the number of line segments formed by connecting curve points with points.In the threedimensional W-M function,for thex-andy-plane,given the step size,the point cloud mesh is obtained,and thePris defined as the sample surface size/step.For the mesh grid with size of 50×50,the value ofPris 50.Similarly,the value ofPris 4 when the mesh grid size is 4×4.The fractal dimension (D) could affect the frequency of the roughness of the surface.A higher fractal dimension will decrease the waviness of the rough surface.The fractal roughness (G) could affect the amplitude of the rough surfaces.The maximum value of the rough surface will increase when increasing the value ofG.The surface precision(Pr)determines the number of grids which determines the complexity of the rough surfaces.A smooth plane will be obtained when the value ofPris zero.The more surface precision,the more complex the rough surface will behave.In the 3D W-M function,the fractal dimension ofD,the height magnitude ofG,and the accuracyPrplay a dominant role in defining the function surface.To illustrate the effect of the three parameters on the surface,some typical W-M surfaces were generated to demonstrate the role of fractal dimension(D),height amplitude (G),and precision (Pr).To discuss the influence of the three parameters,the sample surface size was set to 10 cm×10 cm.The minimum resolution of the simulated sample was 0.1 cm,i.e.,L=10 cm,Ls=0.1 cm,andnmax=11.As shown in Fig.2,at a fixed height amplitudeG=10-5andPr=50,the absolute height of the function surface decreases sharply by increasing the size of the fractal dimensionD.The larger the value ofD,the smoother the surface.
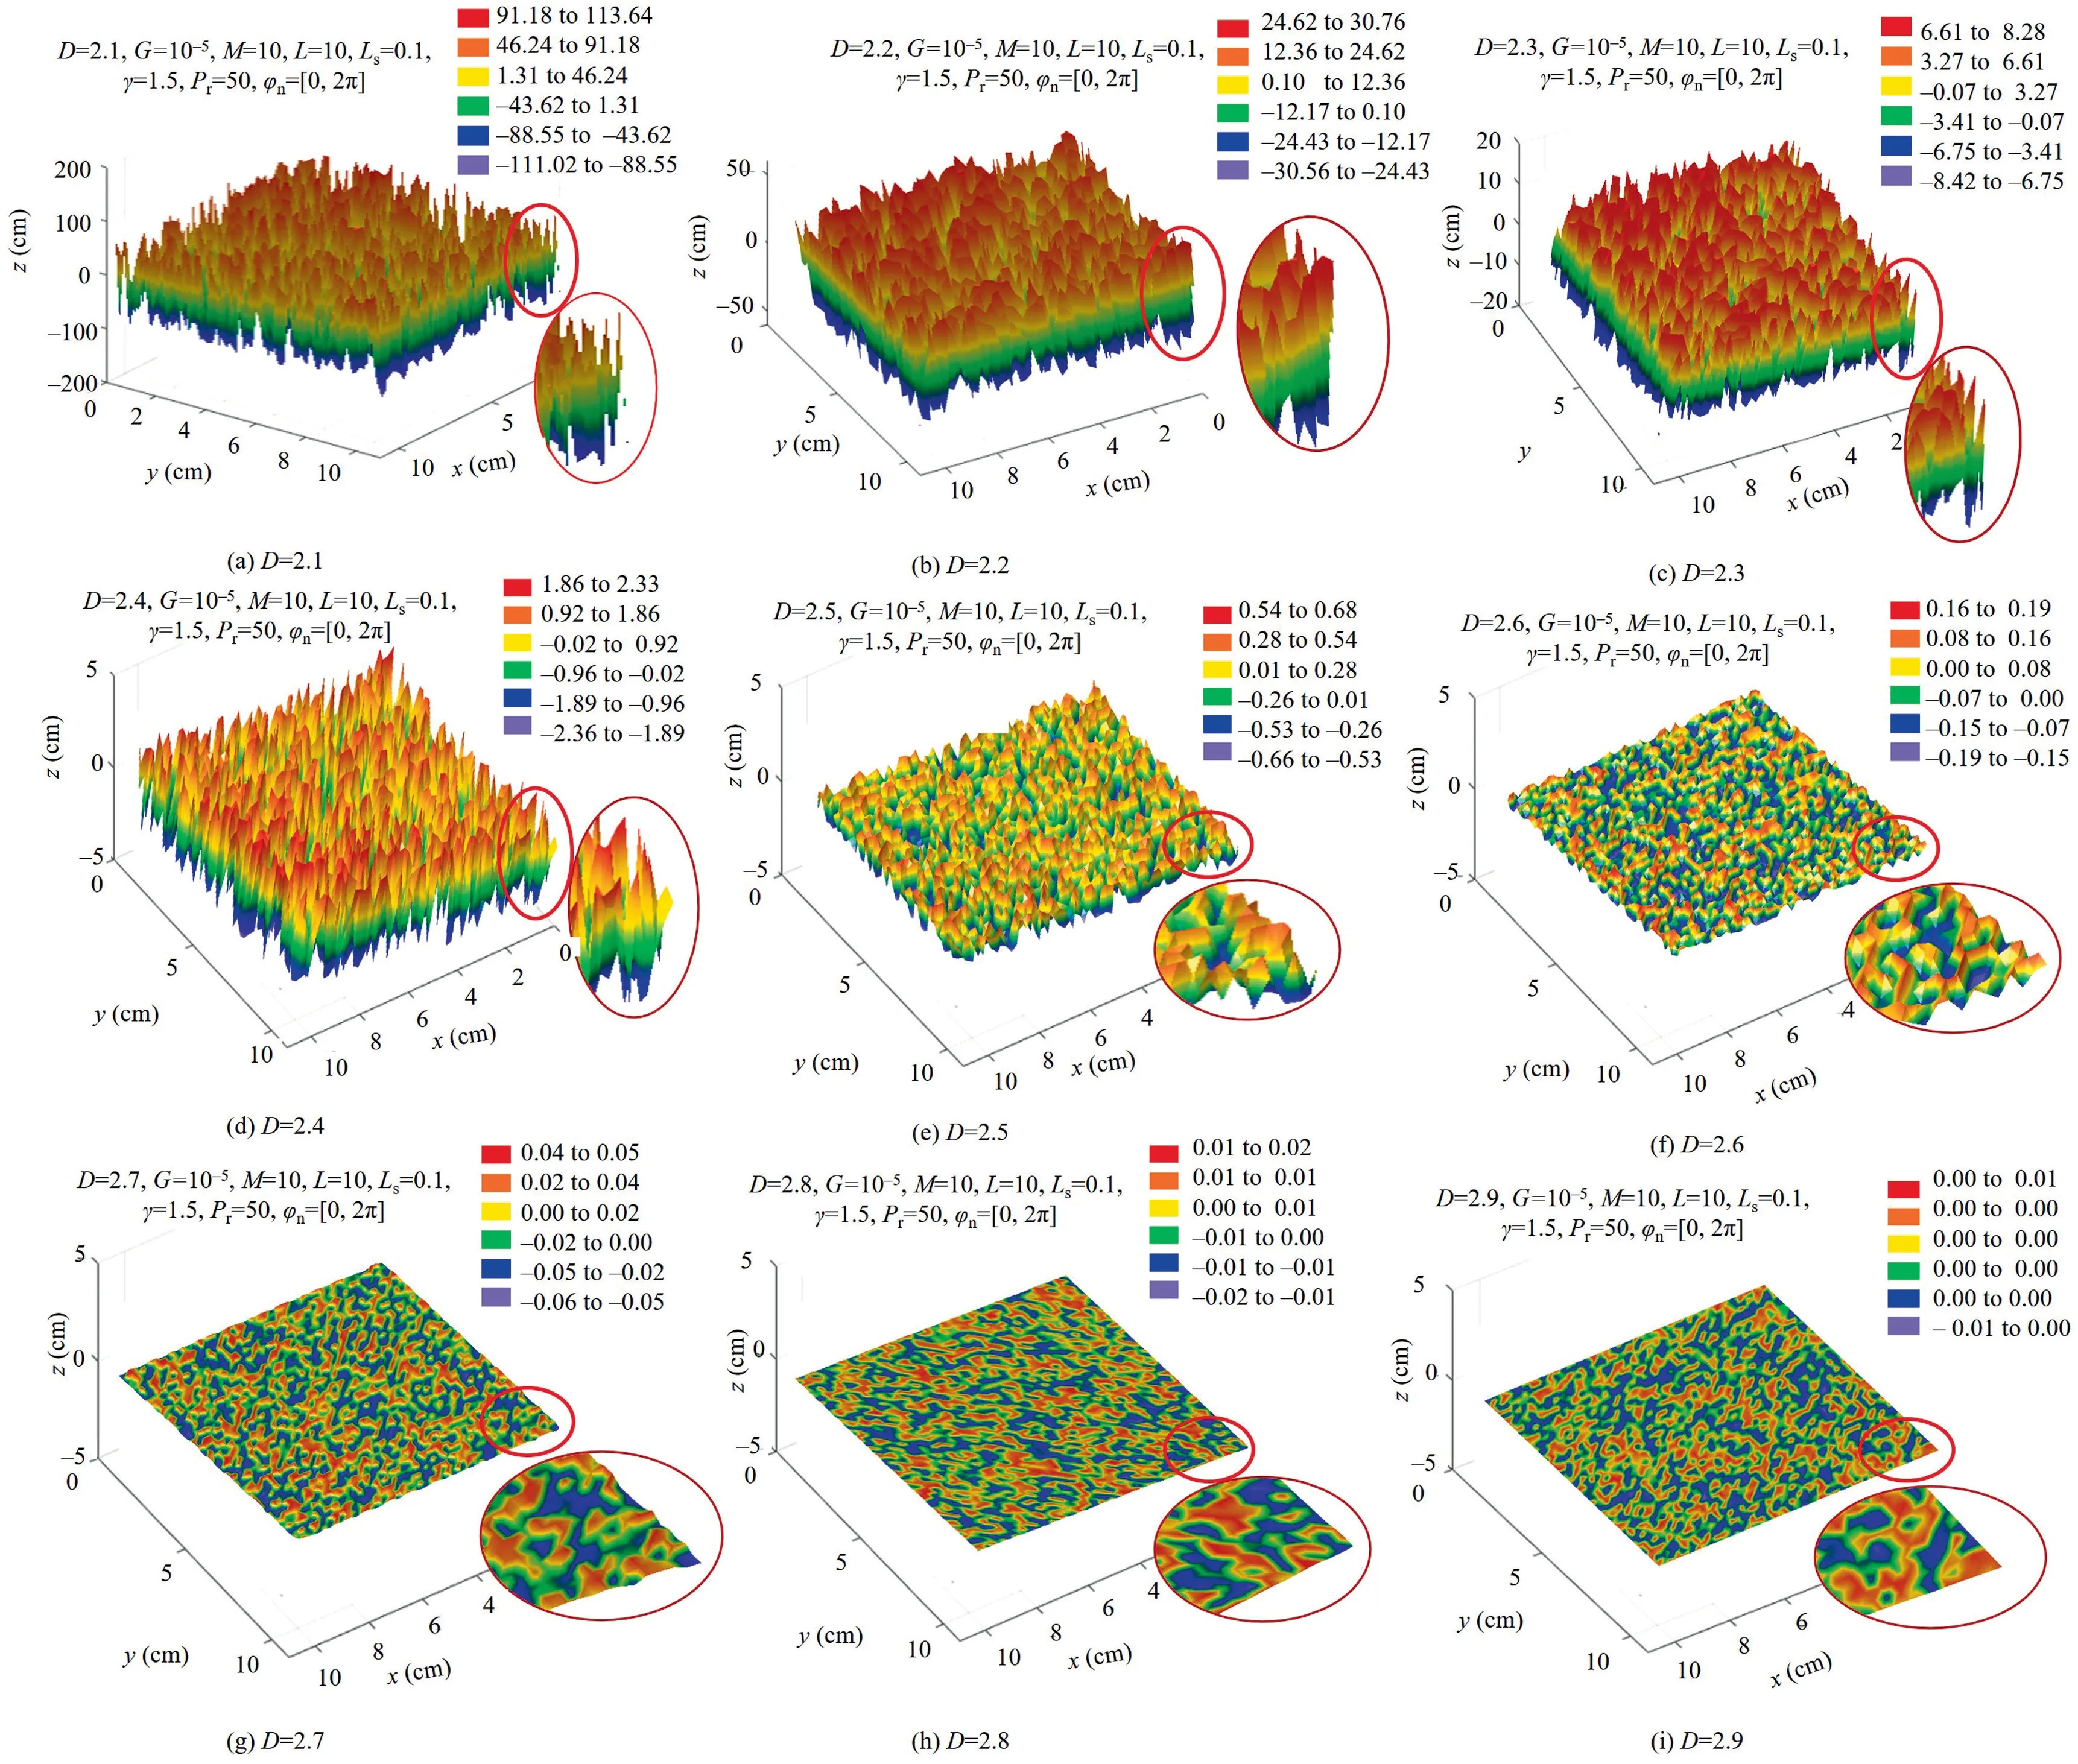
Fig.2.The 3D W-M surfaces of varied values of the parameter of D.
As shown in Fig.3,at a fixed fractal dimension ofD=2.5 andPr=50,the absolute height of the function surface gradually increases by increasing the value ofG.The number of peaks distributed in the rough surface is not affected by changing the value ofG.The larger the value ofG,the rougher the surface will be.

Fig.3.The 3D W-M surfaces of varied values of the parameter of G.
As shown in Fig.4,the influence of the precision ofPris compared.At a fixed height amplitude ofGand fractal dimension ofD,the number of the peaks spread in the rough surface decreases as the value ofPrdecreases.According to the 2D profile from each 3D surface,the waviness and roughness are affected by the precision.ChangingPrdoes not change the height of the rough surface;however,the number of peaks decreases as the precision of the surface decreases.Note that the 3D W-M surface becomes a smooth plane whenPris equal to 1.This could allow the generation of both rough surfaces and smooth surfaces.
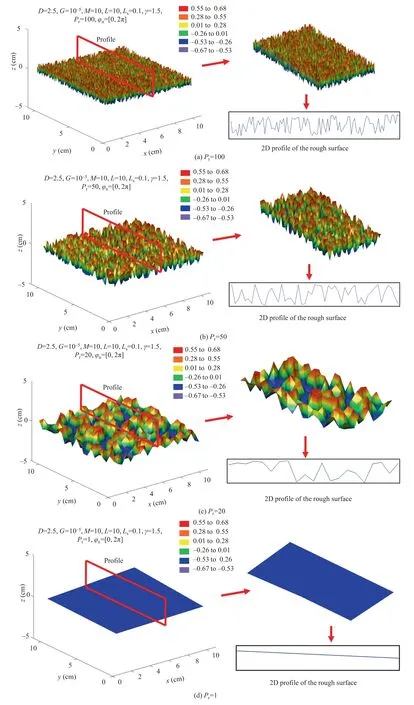
Fig.4.The 3D W-M surfaces of varied values of the parameter of Pr.
2.2.Relationship of the 3D rough surfaces with the JRC curves
It is important to establish the relationship of the W-M surface with the natural discontinuities.Once the relationship is obtained,the mathematical W-M surface could have its physical meaning in the application of rock engineering.We discussed the relationship of the 3D rough surfaces with the JRC curves by Barton and Choubey [36].Table 1 lists the comparison of the proposed 3D meshes with JRC curves.Two key parameters (GandD) are modified to match the 2D JRC curves when other parameters are set:Pr=20,M=10,L=100,Ls=0.1,γ=1.5,φn=[0,2π].The combination ofGandDcould affect the shape and roughness of the surfaces.The JRC value of the profile cut from the 3D rough surface is calculated according to Eq.(3) by Tatone and Grasselli [48].
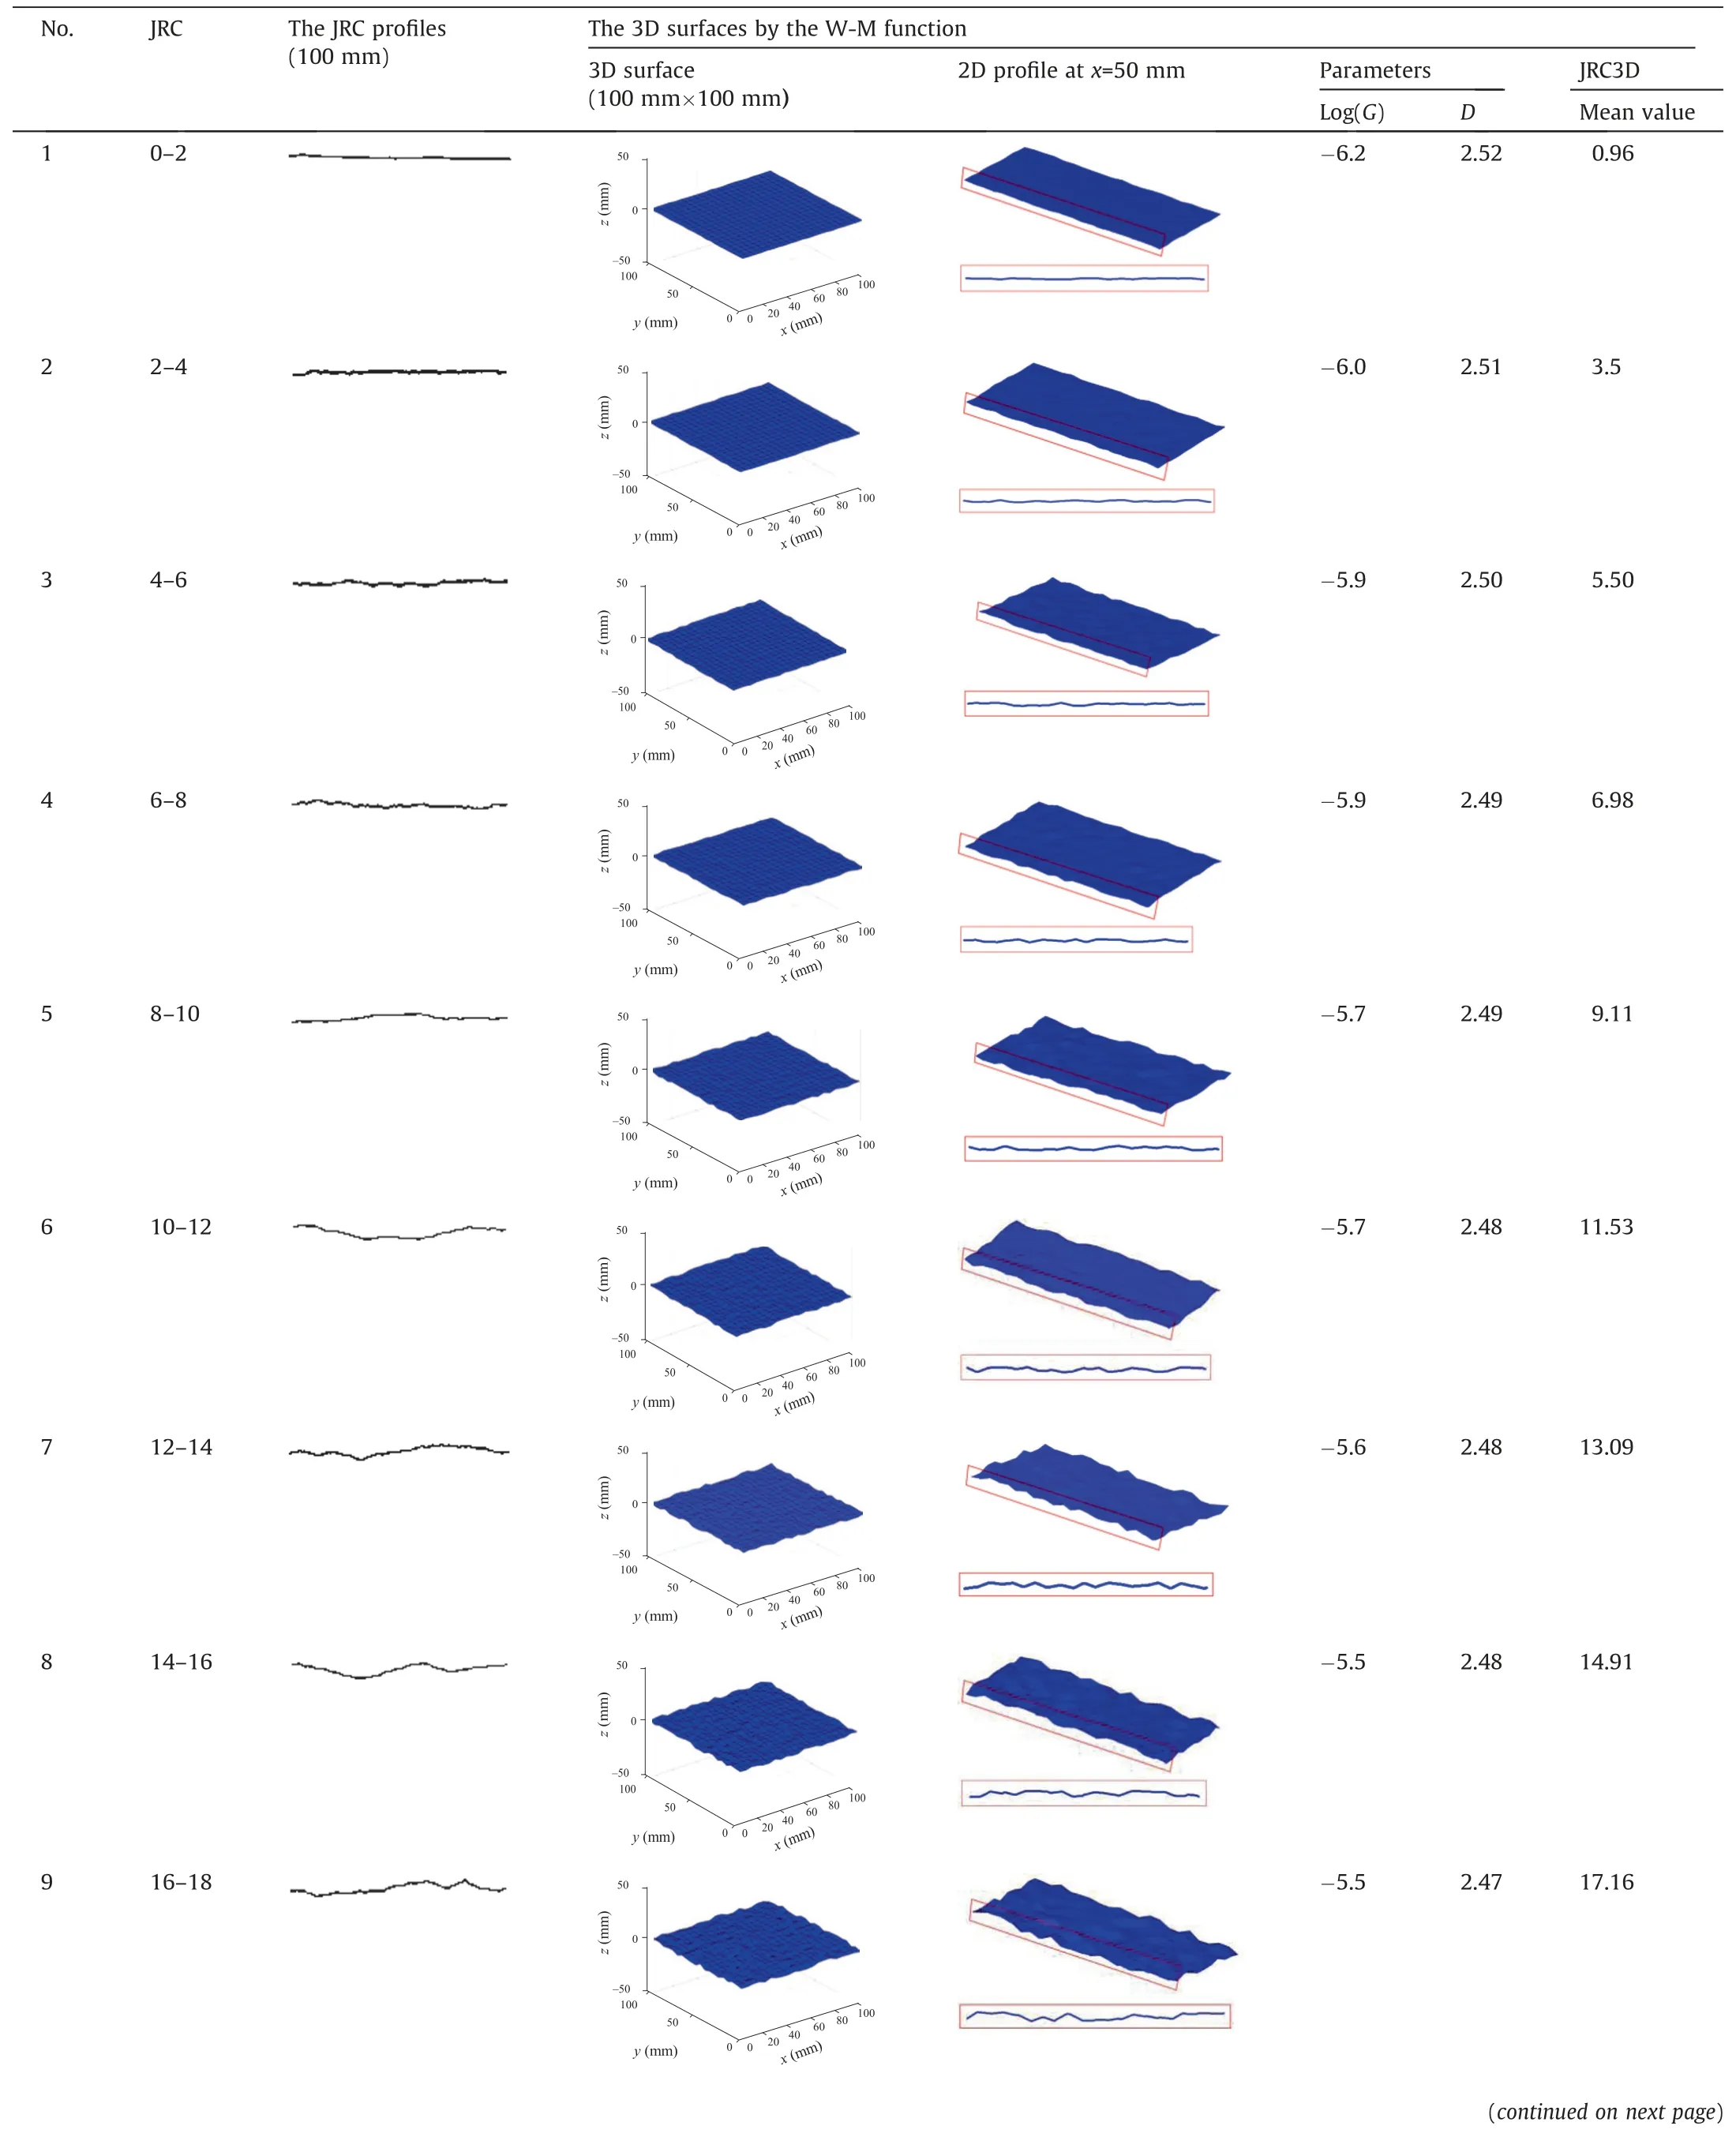
Table 1 Comparison of the 3D rough W-M meshes with the JRC profiles.
whereZ2is the root mean square of the first derivative of a surface profile,is the JRC value atZ2.Take the JRC curve of 6-8 for example,the 2D profile atx=50 mm along the W-M surface matches well with the roughness of the curve when the Log(G) andDare-5.9 and 2.49,respectively.The JRC3D value is 7.23,which falls in the value of 6-8.This result could provide a reference for the characterizing of the natural discontinuities in jointed rock masses.
Relationship of the 3D W-M meshes with the naturally rough surface could be preliminarily obtained by comparing the waviness of the trace section with the standard JRC curves.Fig.5 shows the slope surface obtained in Shilu iron open pit mine.The waviness of the structure traces coincides with the curve with JRC is 14-16.Then the W-M parameters could be obtained according to Table 1,as shown in Fig.5.However,it should be clarified that this process is not accurate and rigorous.In further research,we will study the quantitative relationship between the real rock joint surfaces with the dominating W-M parameters.
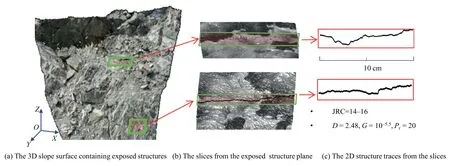
Fig.5.The comparison of the JRC curves with natural rough surface and selection of the W-M parameters.
3.Construction of the RDFN3D model
3.1.Principle of the construction of the RDFN3D model
Modeling the discrete fracture network is a key for the characterization of the equivalent rock mass.A 3D rough discrete fracture network (RDFN3D) model is established according to the 3D W-M surfaces based on the Monte Carlo method.The characterization of the geometric properties of the rough structural surface is realized.The modeling principle of the fractional dimensional RDFN3D model is shown in Fig.6.In practice,volumetric density is often estimated by simulation based on linear density or surface density,which can be referenced to the relationship between linear density,surface density and volumetric density established by Kulatilake et al.[49]and Wu et al.[50].First,the rough surfaces based on the W-M function according to the shapes of natural structures should be determined.Here,the rough surface is mainly dominated by the parameters including the fractal dimension ofD,the amplitude ofG,and the precision ofPr.Then,the determination of the information of the 3D structural planes includes the orientation,spatial size,and spacing.The central points of the rough surfaces follow the uniform distribution,which means the spatial locations of the fractures also follows the uniform distribution.It should be noted that,in the generated RDFN model,the thickness of the three-dimensional surface is zero,that is,the aperture is not considered,so the initial value is 0.The aperture can be considered by offset during the modeling process in the AutoCAD code.The statistical model of the 3D discontinuities should be established according to the on-site survey.Then the RDFN3D model could be established based on the Monte Carlo method considering the positions,areas,and directions of W-M surfaces.Since all the rough surfaces are determined using the mathematical model in the MATLAB code,we could export the information of all the nodes composing the rough surfaces.Many format files could be exported,such as the DXF files,and the TXT.Here we exported the RDFN3D model to AutoCAD,COMSOL Multiphysics,and the particle flow code in 3-dimension(PFC3D),which enable the computational analysis of the mechanical behavior of the RDFN3D model.
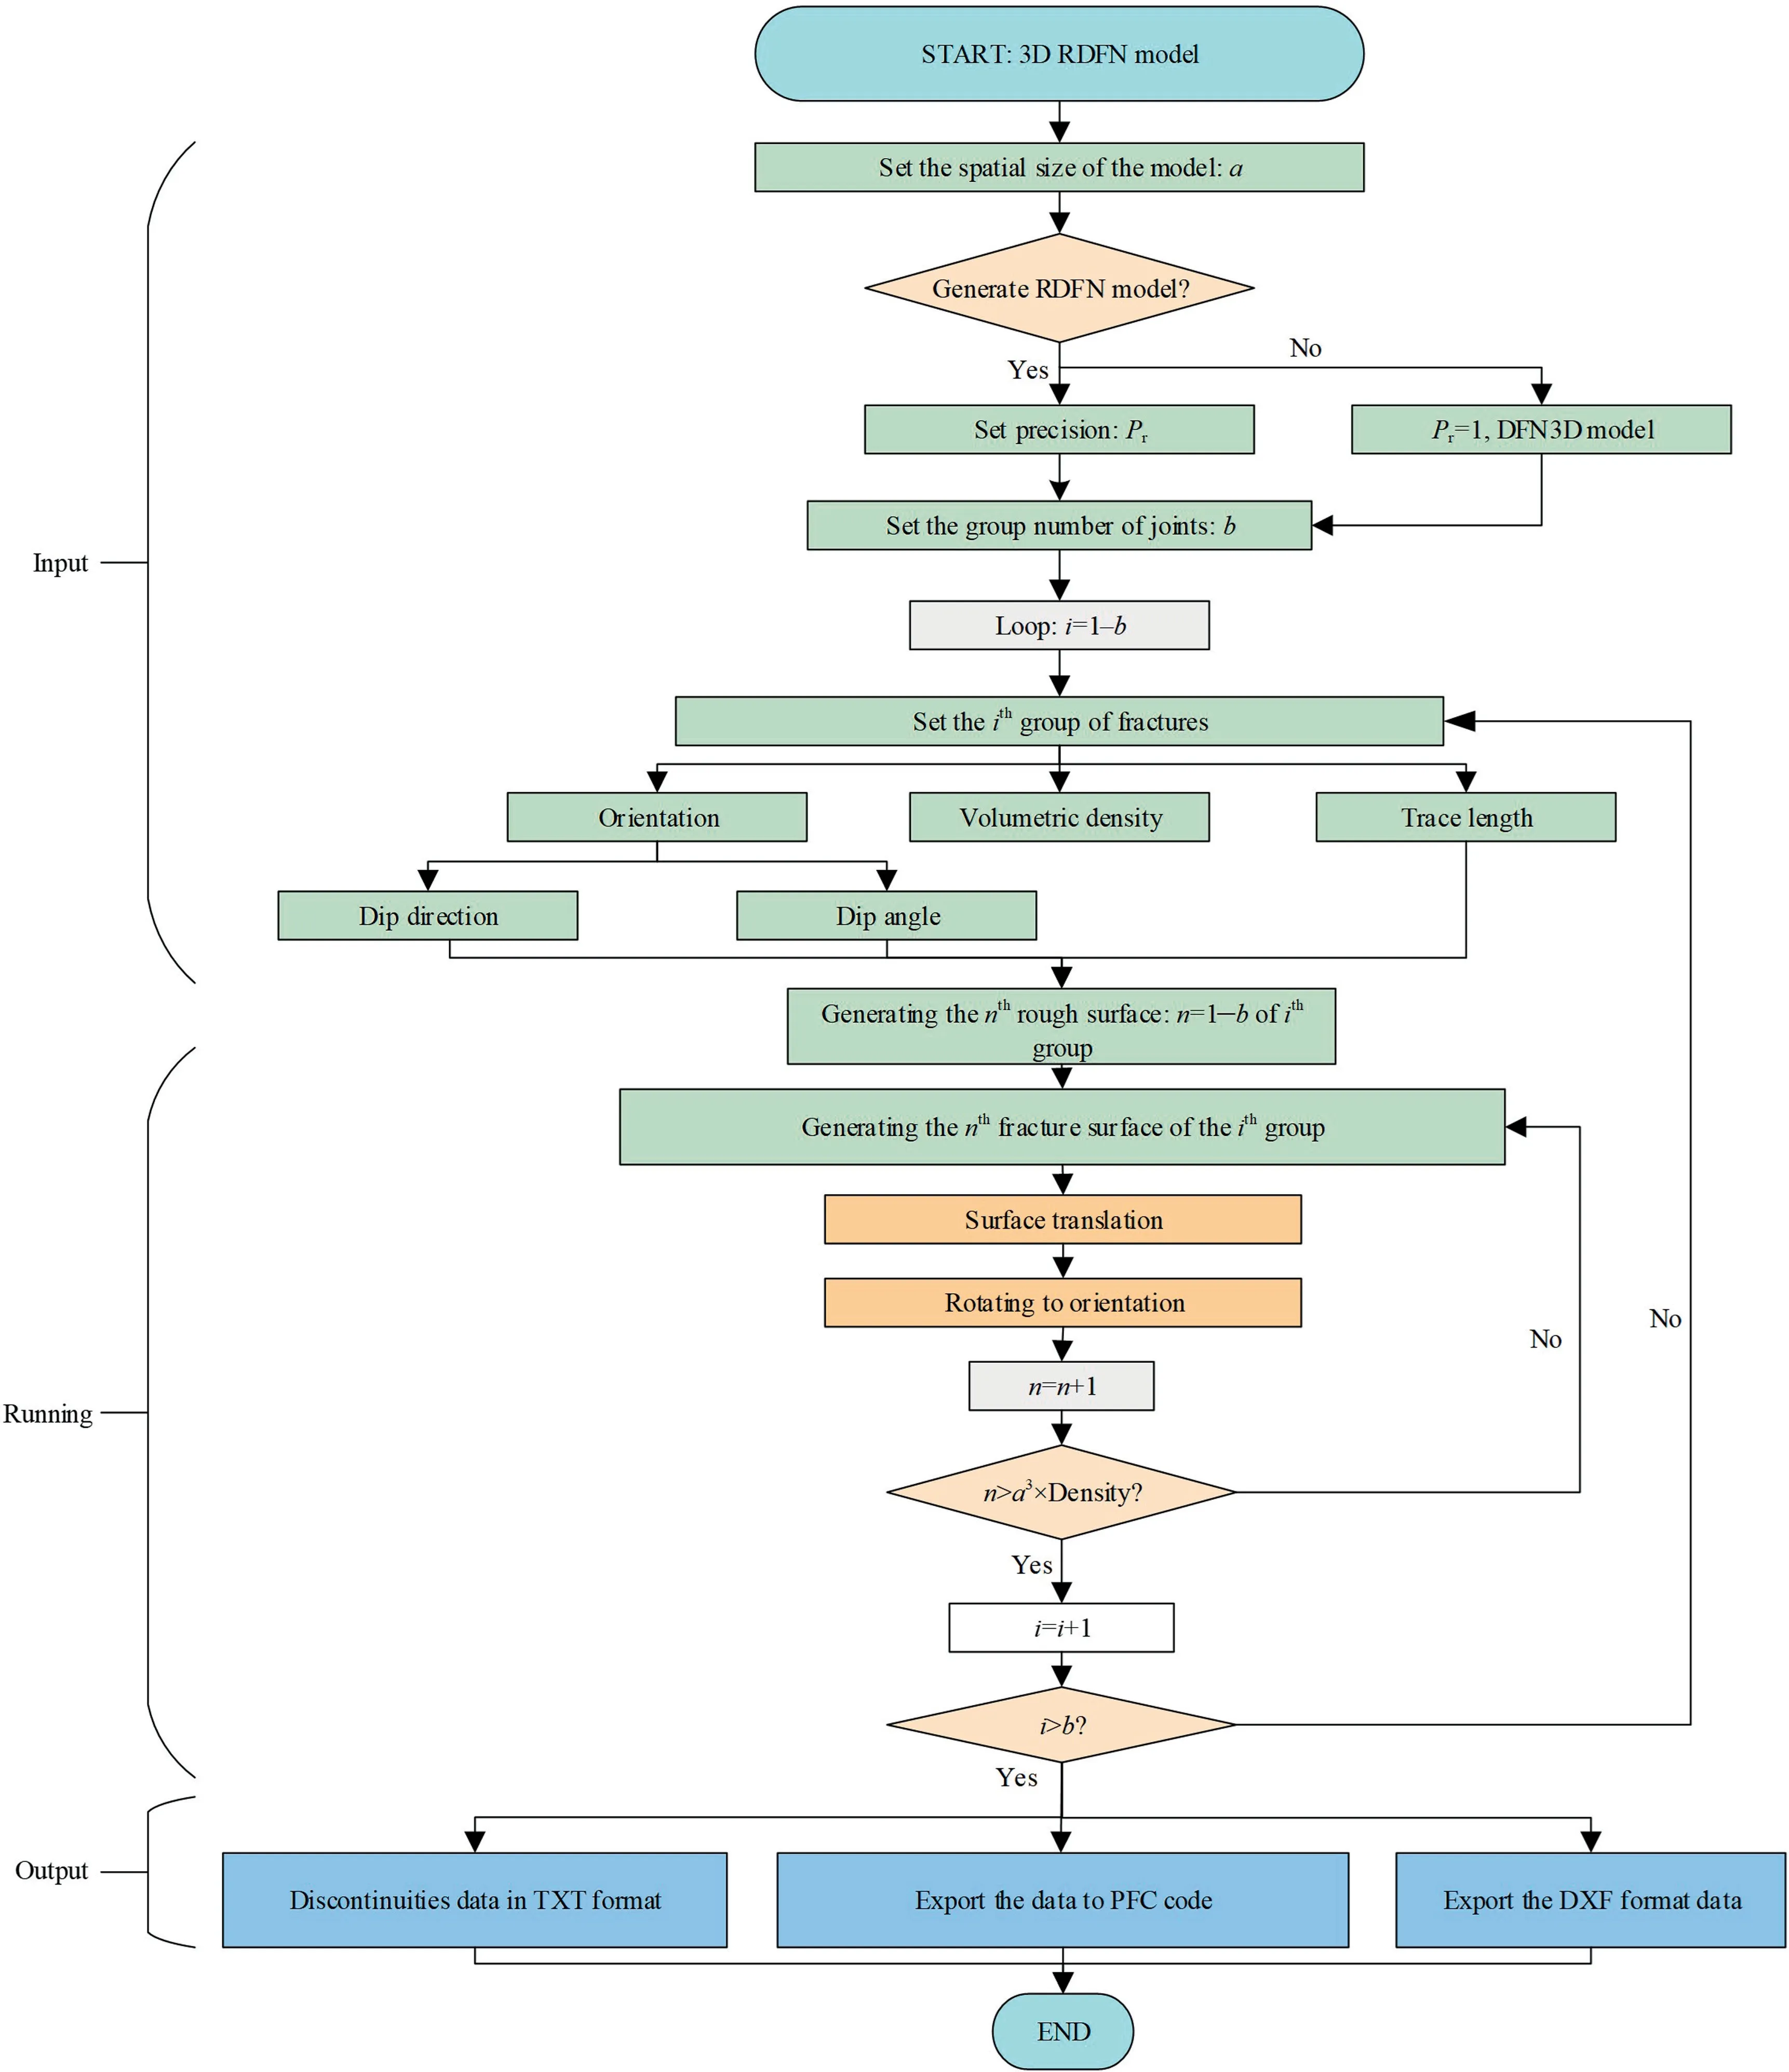
Fig.6.Flowchart of RDFN model generation algorithm.
3.2.Influence of dominating parameters
In this section,three case studies including both the RDFN3D and DFN3D models were established and the influence of the parameters ofD,G,andPrwas discussed.The RDFN3D model including only one set of fractures was introduced and the information is listed in Table 2.The average values and deviation of the dip direction,dip angle as well as trace length are set uniformly distributed.Fig.7 show the varied rough fractures network considering different values ofD,G,andPr.Increasing the fractal dimensionDfrom Fig.7a to b results in a significant decrease in the absolute height of the fracture surfaces and a decrease in the degree of undulation.A smoother appearance of the fracture surfaces is obtained.As compared with those in Fig.7b to c,with the increase of height amplitudeG,the absolute height of each fracture surface also increases along the profile.The undulation frequency did not change and the roughness of the fracture surface was increased.Comparing Fig.7c and d,the absolute height of each fracture surface does not change when increasing the precisionPr.However,the degree of waviness increases significantly.The roughness of Fig.7d and a show a similar pattern.The parameters ofGandPrcould significantly increase the roughness of the 3D surfaces.However,the fractal dimension ofDdecreases the surface roughness and waviness.
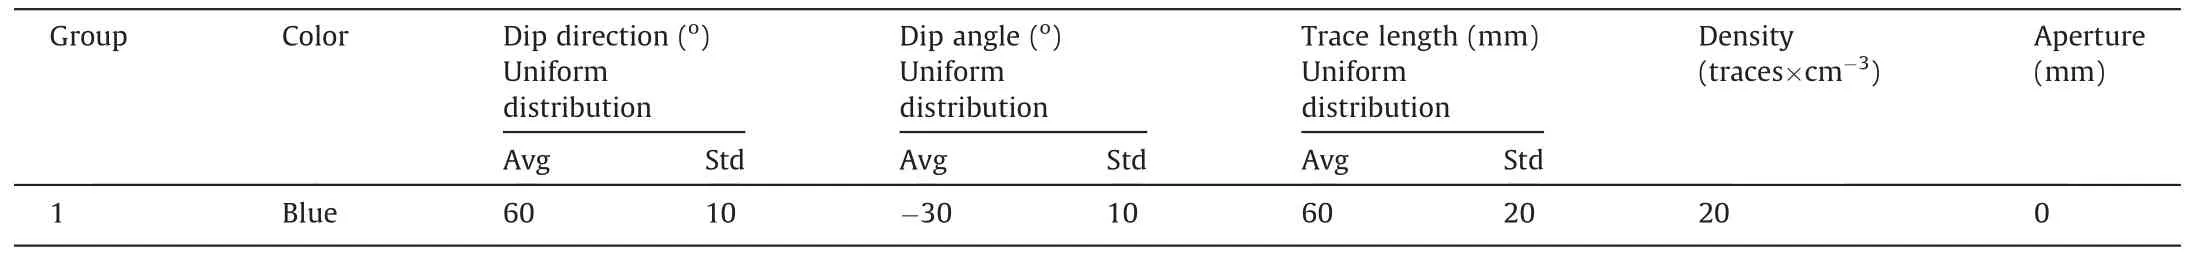
Table 2 The geometrical parameters of the rough fractures.
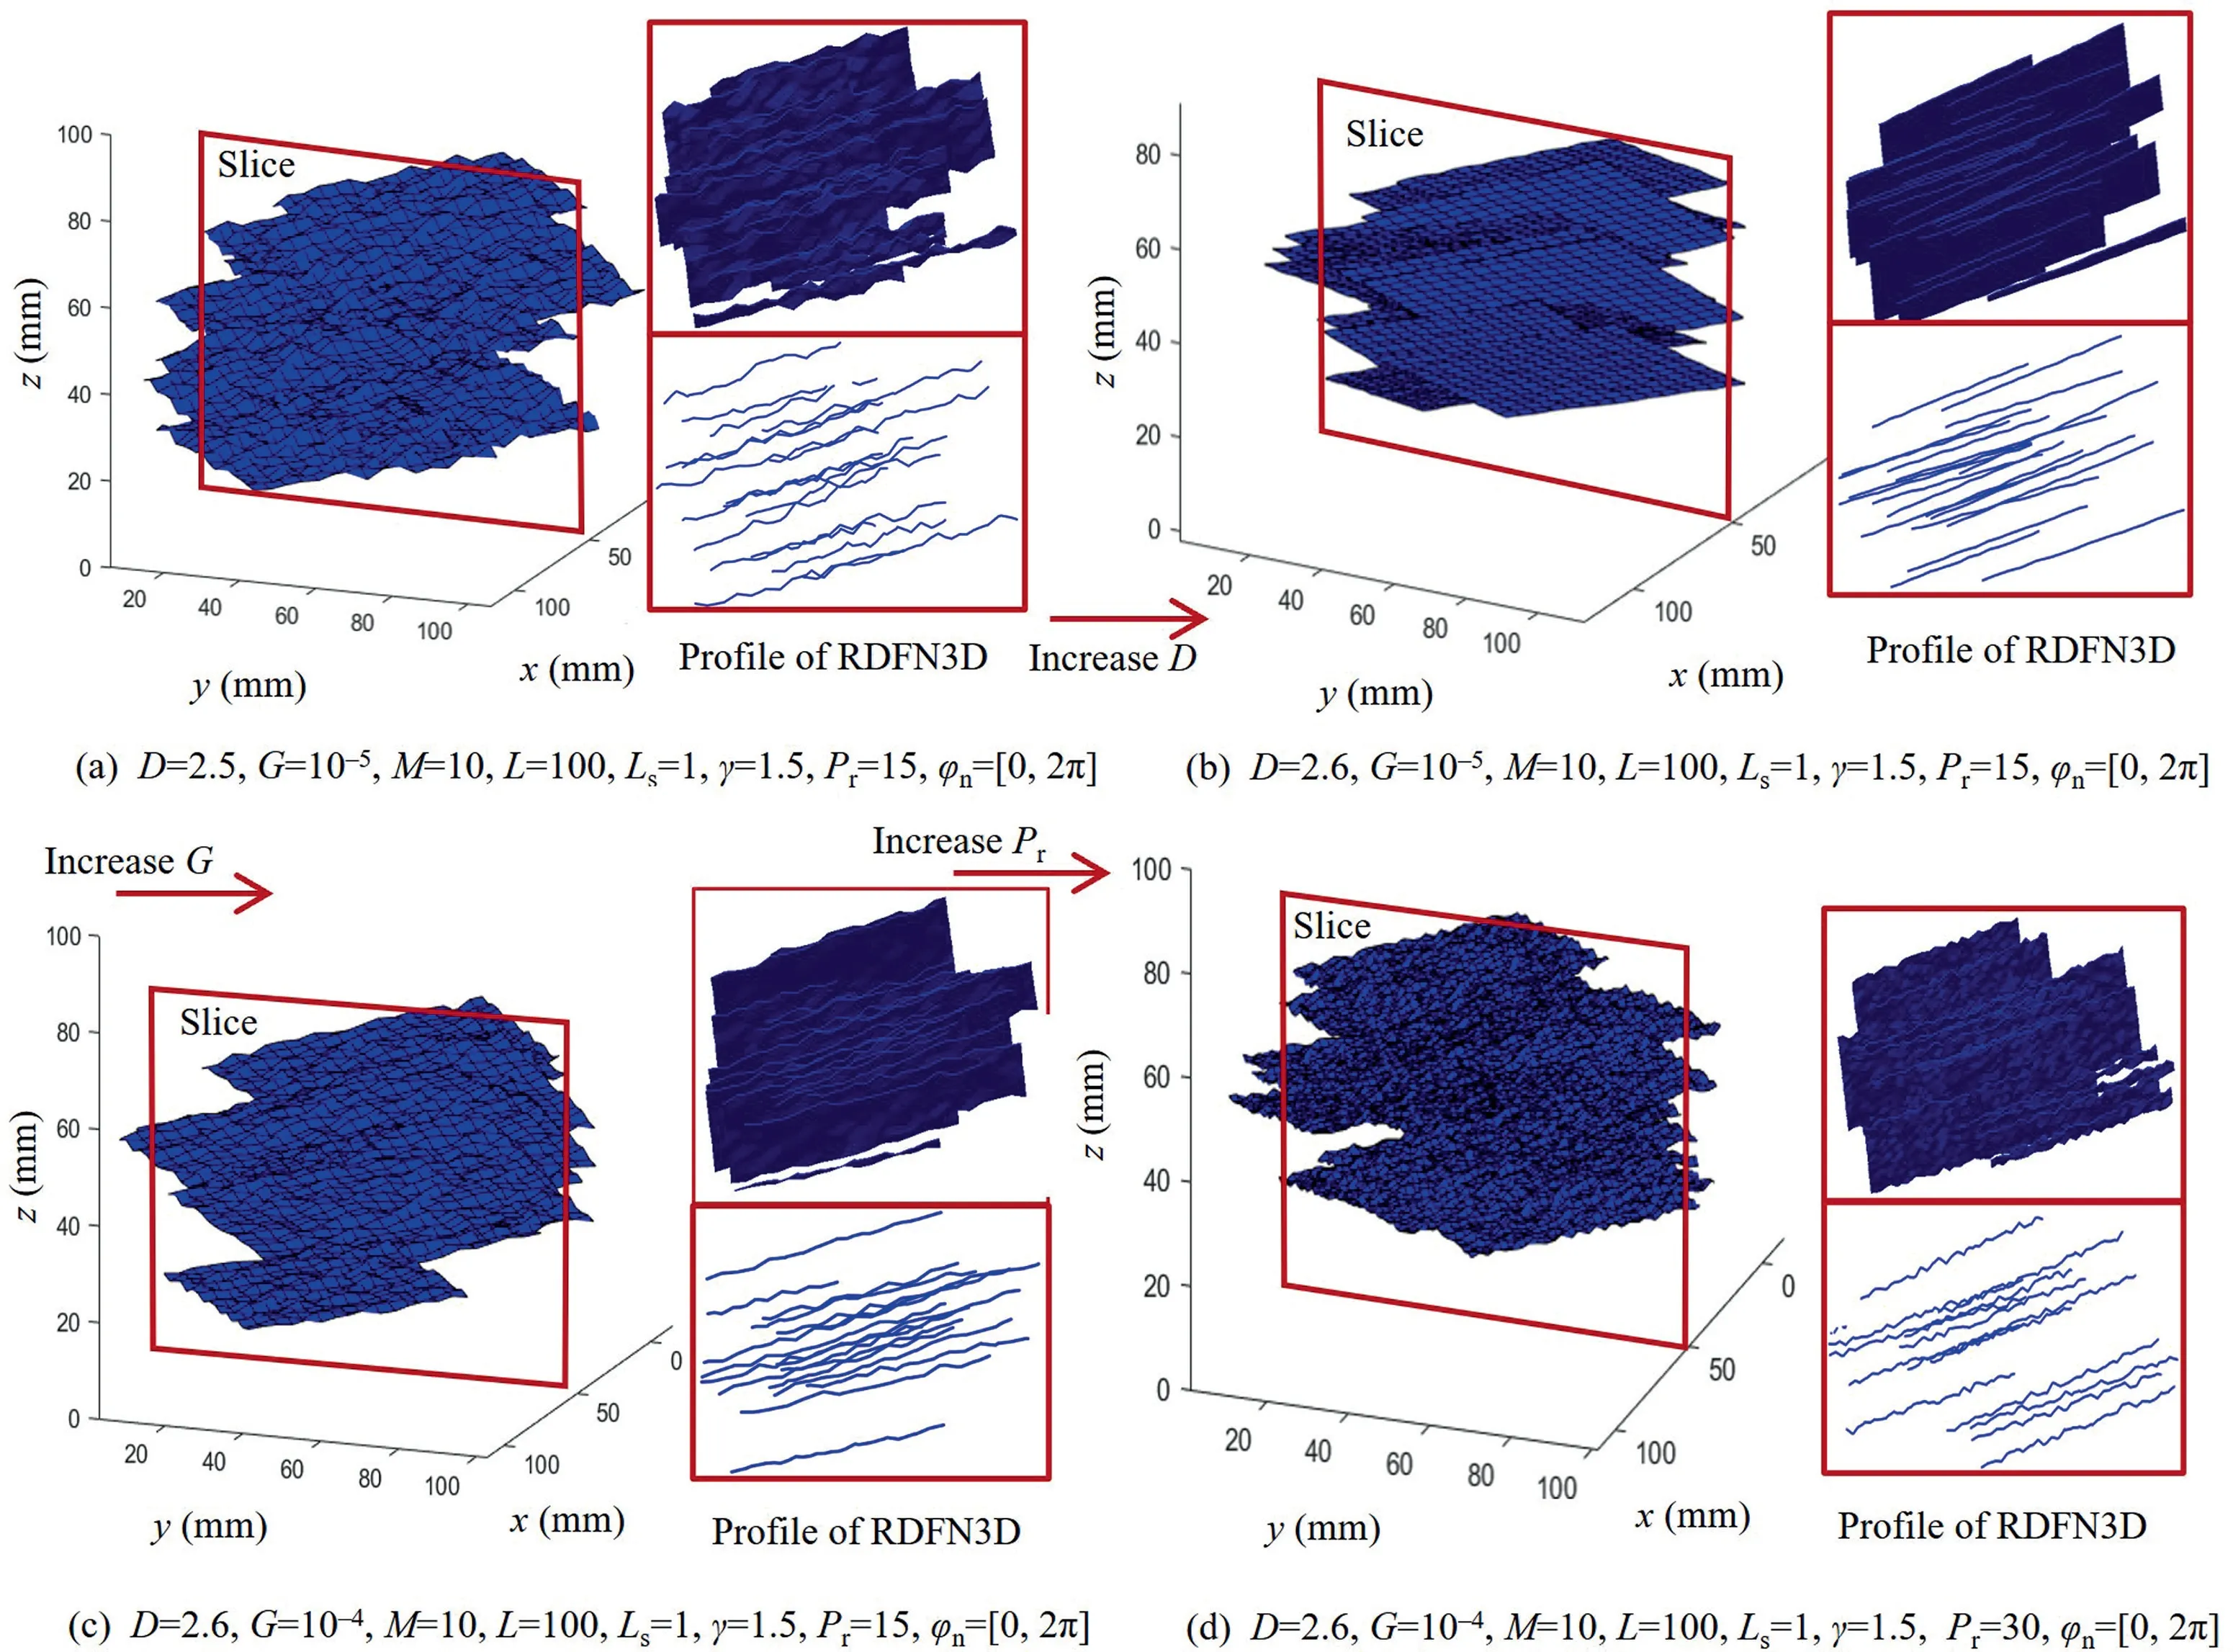
Fig.7.The profiles of RDFN3D models with different values of D, G and Pr (at x=50 mm).
3.2.1.Case study I:RDFN3D model with one set of fractures with high persistence
The RDFN3D model of the case I study is shown in Fig.8 and the corresponding parameters are listed in Table 3.In case I,there is only one set of discrete fractures with relatively high persistence.The scale size of the model is 100 mm×100 mm×100 mm.The dip direction,dip angle,and trace length are uniformly distributed.Fig.8a shows the spatial distribution of the fractures and Fig.8b shows the profiles of varied sections,in whichX-1,X-2,X-3 shows the slices perpendicular to thex-axis,Y-1,Y-2,Y-3 shows the slices perpendicular to they-axis,andZ-1,Z-2,Z-3 shows the slices perpendicular to thez-axis,respectively.
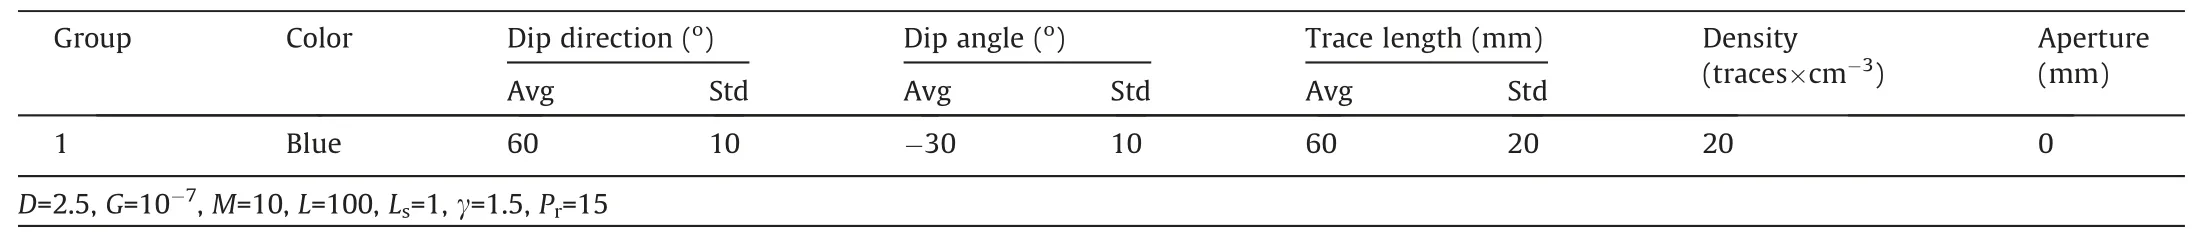
Table 3 The fractal parameters of the rough fractures in case I.

Fig.8.The distribution of RDFN3D model with one joint set (case I,with high persistence).
3.2.2.Case study II: RDFN3D model with three sets of fractures with high persistence
Both the RDFN3D model and DFN3D model are shown in Fig.9 in the case II study and the corresponding parameters are listed in Table 4.As is shown in case II,there are three sets of discrete fractures with high persistence.The scale size of the model is also 100 mm×100 mm×100 mm.Fig.9a shows the spatial distribution of the fractures of the RDFN3D model and Fig.9b shows the profiles of varied sections of the DFN3D model.The roughness of each joint trace could be obtained.
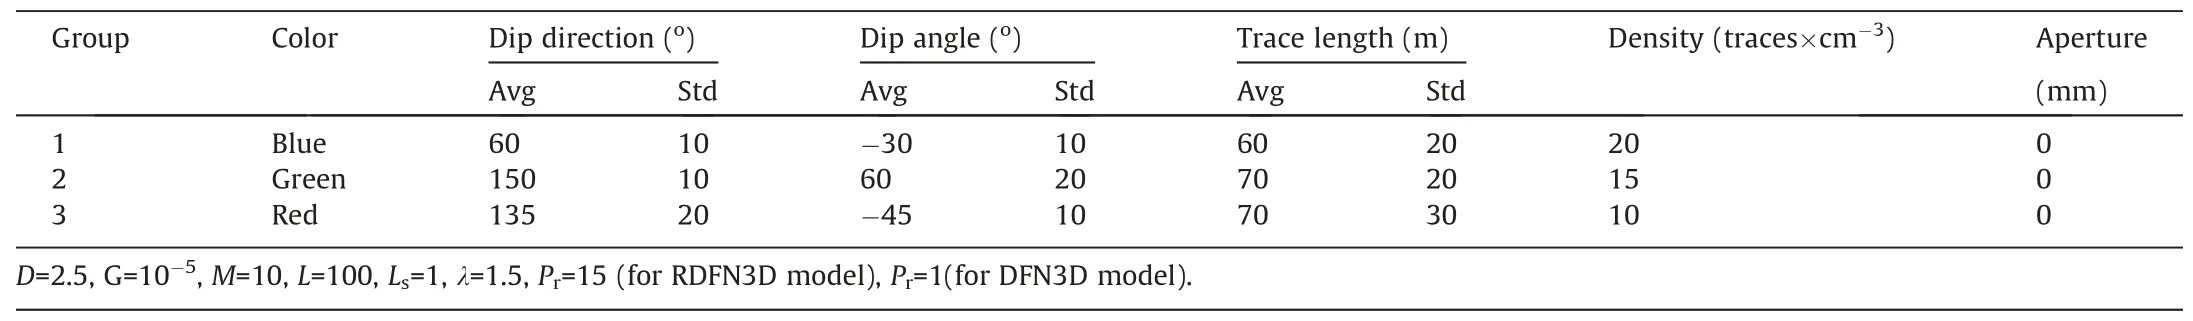
Table 4 The fractal parameters of the rough fractures in case II.

Fig.9.The distribution of RDFN3D and DFN3D models with three joint sets (case II,with high persistence).
3.2.3.Case study III: RDFN3D model with three sets of fractures with low persistence
In natural structures,the fractures are generally distributed with low persistence.In case study III,the RDFN3D model,as well as the DFN3D model with lower persistence,are shown in Fig.10.Three profiles along the slice planes ofX-1,Y-1,andZ-1,are listed.Table 5 lists the corresponding information of the three sets of fractures.The scale size of the model is also 100 mm×100 mm×100 mm.The corresponding JRC curve is 10-14.
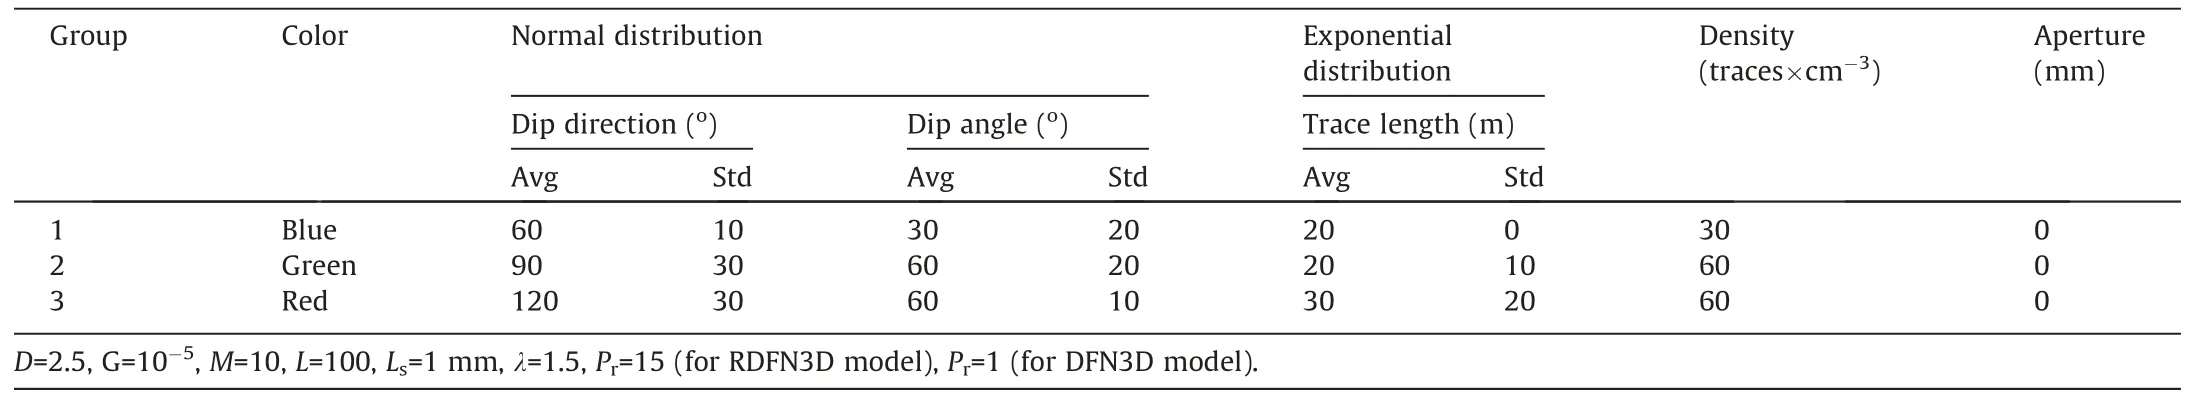
Table 5 Distribution of RDFN3D model with three sets of fractures.
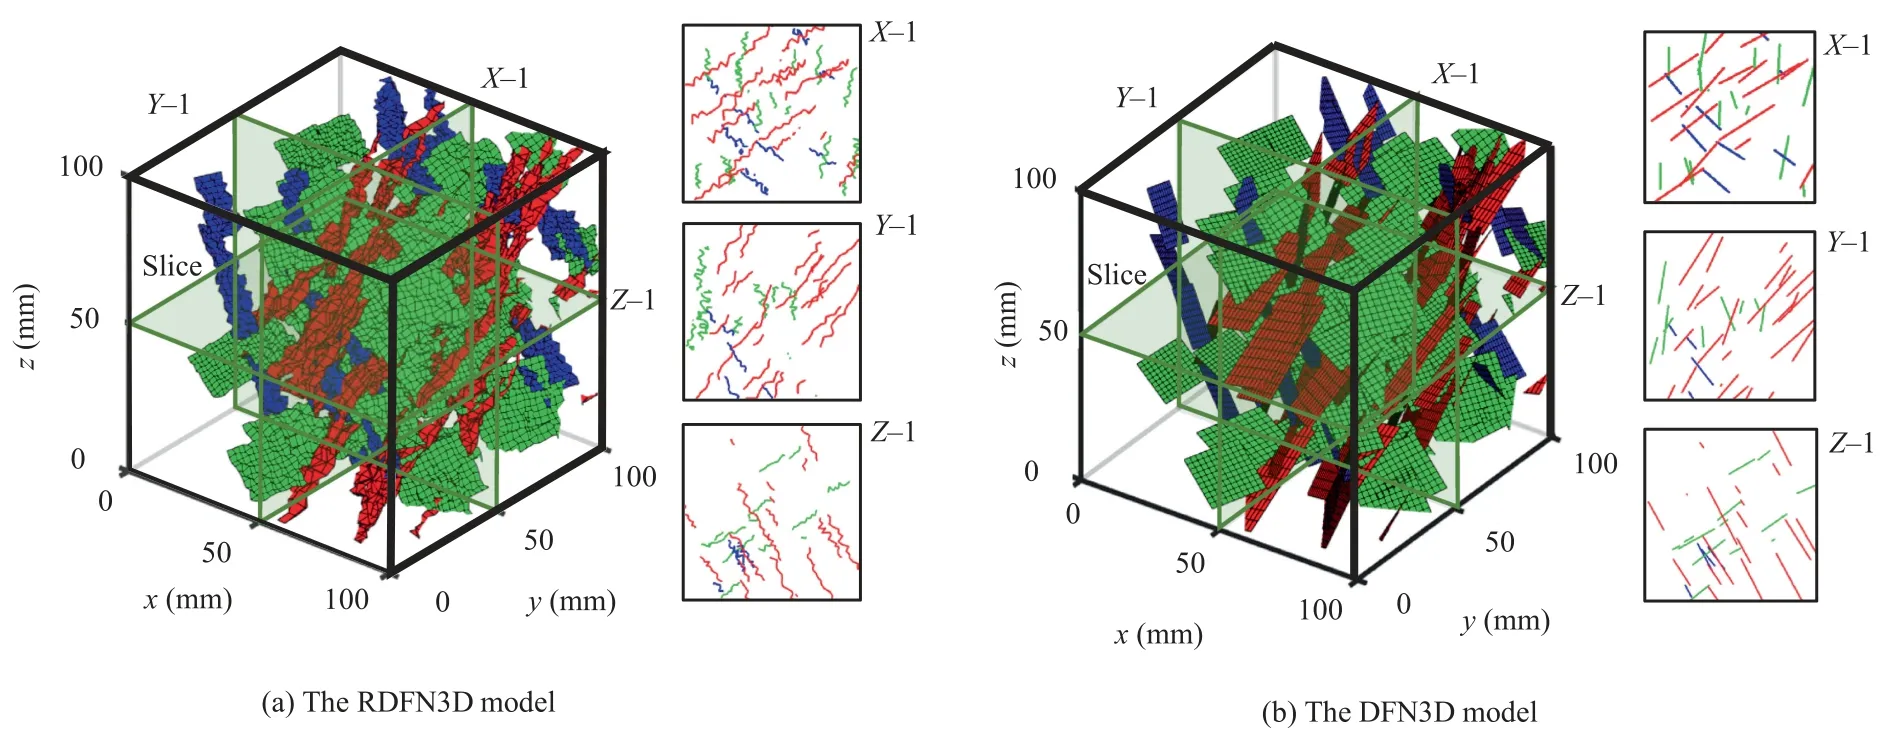
Fig.10.The distribution of RDFN3D and DFN3D models with threes joint sets (case III,with low persistence).
4.Analysis and discussion
The particle flow code (PFC) has been widely used to simulate the mechanical behavior of rock materials.Wu et al.[50] established a numerical synthetic rock mass (SRM) based on the PFC code to study the mechanical behavior of jointed rock masses.The SRM model has been widely used in the PFC model to study the mechanical properties of rock masses.It is necessary to establish a more detailed geomechanical model of the rock matrix to perform the numerical simulation.The RDFN3D modeling method has been introduced based on the MATLAB code.It also realizes the export of the drawing exchange format (DXF) file and the PFC3D command code,which provides a computational model for performing numerical simulation,such as the finite element method and the differential element method.It is worth noting that when constructing the geological model,an arbitrary number of fractures can be specified to generate a corresponding RDFN3D model.However,in finite element simulation,due to the complexity of mesh partitioning,the geological model will be simplified in the process of transformation to the numerical model.When generating finite element meshes,errors will occur if there are too many rough surfaces.Therefore,there are fewer fractures in the numerical model than in the digital RDFN3D model.
The application of the RDFN3D model is presented here and then discussed with the PFC3D and COMSOL Multiphysics models.Comparisons are made to show the influence of the rough surfaces on both the mechanical compression properties and the flow properties.
4.1.Application in PFC3D modeling
As shown in Fig.11,each rough surface of the 3D rough network model can be regarded as composed of multiple nodes.The conventional structural surface can be regarded as a projection of each discrete point of the plane,and the rough surface can also be determined through the projection with discrete particles showing certain undulations.The point cloud data could be imported into a TXT text file.And a series of point cloud coordinates are obtained by importing the text file in PFC3D.Fig.14 show the jointed rock mass within an intrinsic RDFN3D model in the PFC3D numerical model.Fig.12a shows the RDFN3D mathematical model,in which three sets of fractures are distributed.Fig.12b shows the corresponding PFC3D model.The fracture opening can be achieved by defining the particle diameter.

Fig.11.The generation of rough structure planes in PFC3D.
The numerical model could provide a new SRM model based on the PFC3D code,for performing the analysis of mechanical properties subjected to uniaxial compression.The mechanical parameters of green sandstone reported by Huang et al.[51] were tested by uniaxial compression.The size of the original numerical model is 50 mm × 100 mm,the density is 2.17 g×cm-3,the compressive strength is 29.80 MPa,the Young’s modulus is 8.40 GPa,and the Poisson’s ratio is 0.290.To study the effect of three-dimensional rough structure on rock mass,a numerical model with the size of 150 mm×150 mm×150 mm is established.The bond strength of the joint element is 1% of that of the intact rock elements.Fig.13 shows the comparison of the jointed rock models with smooth DFN3D model and rough RDFN3D model.As is shown in Fig.13,all the joint surfaces in the DFN3D model are smooth planes.The rock surfaces in the RDFN3D model are more complexly distributed.An apparent difference in the failure patterns could be observed as shown in Fig.13a.The linear parallel bonded model was used to evaluate the mechanical response the jointed rock specimens.The main microparameters are listed in Fig.13a.Fig.13b shows the particle distribution,contact bonds and contact force chains of single rough joint surface.The fracture patterns are significantly influenced by the roughness and waviness of the intrinsic discontinuities.The peak strength of the RDFN3D model is slightly higher than that of the DFN3D model.The compressive stress-strain curves of both the RDFN3D model and DFN3D model coincide at the pre-peak stresses stage.A slight difference in the compressive stress curves was observed during this stage.The peak compressive strength of RDFN3D model and DFN3D model are 58.11 and 55.70 MPa,respectively,which means that the joint roughness could increase the compressive capacity of jointed rock mass.
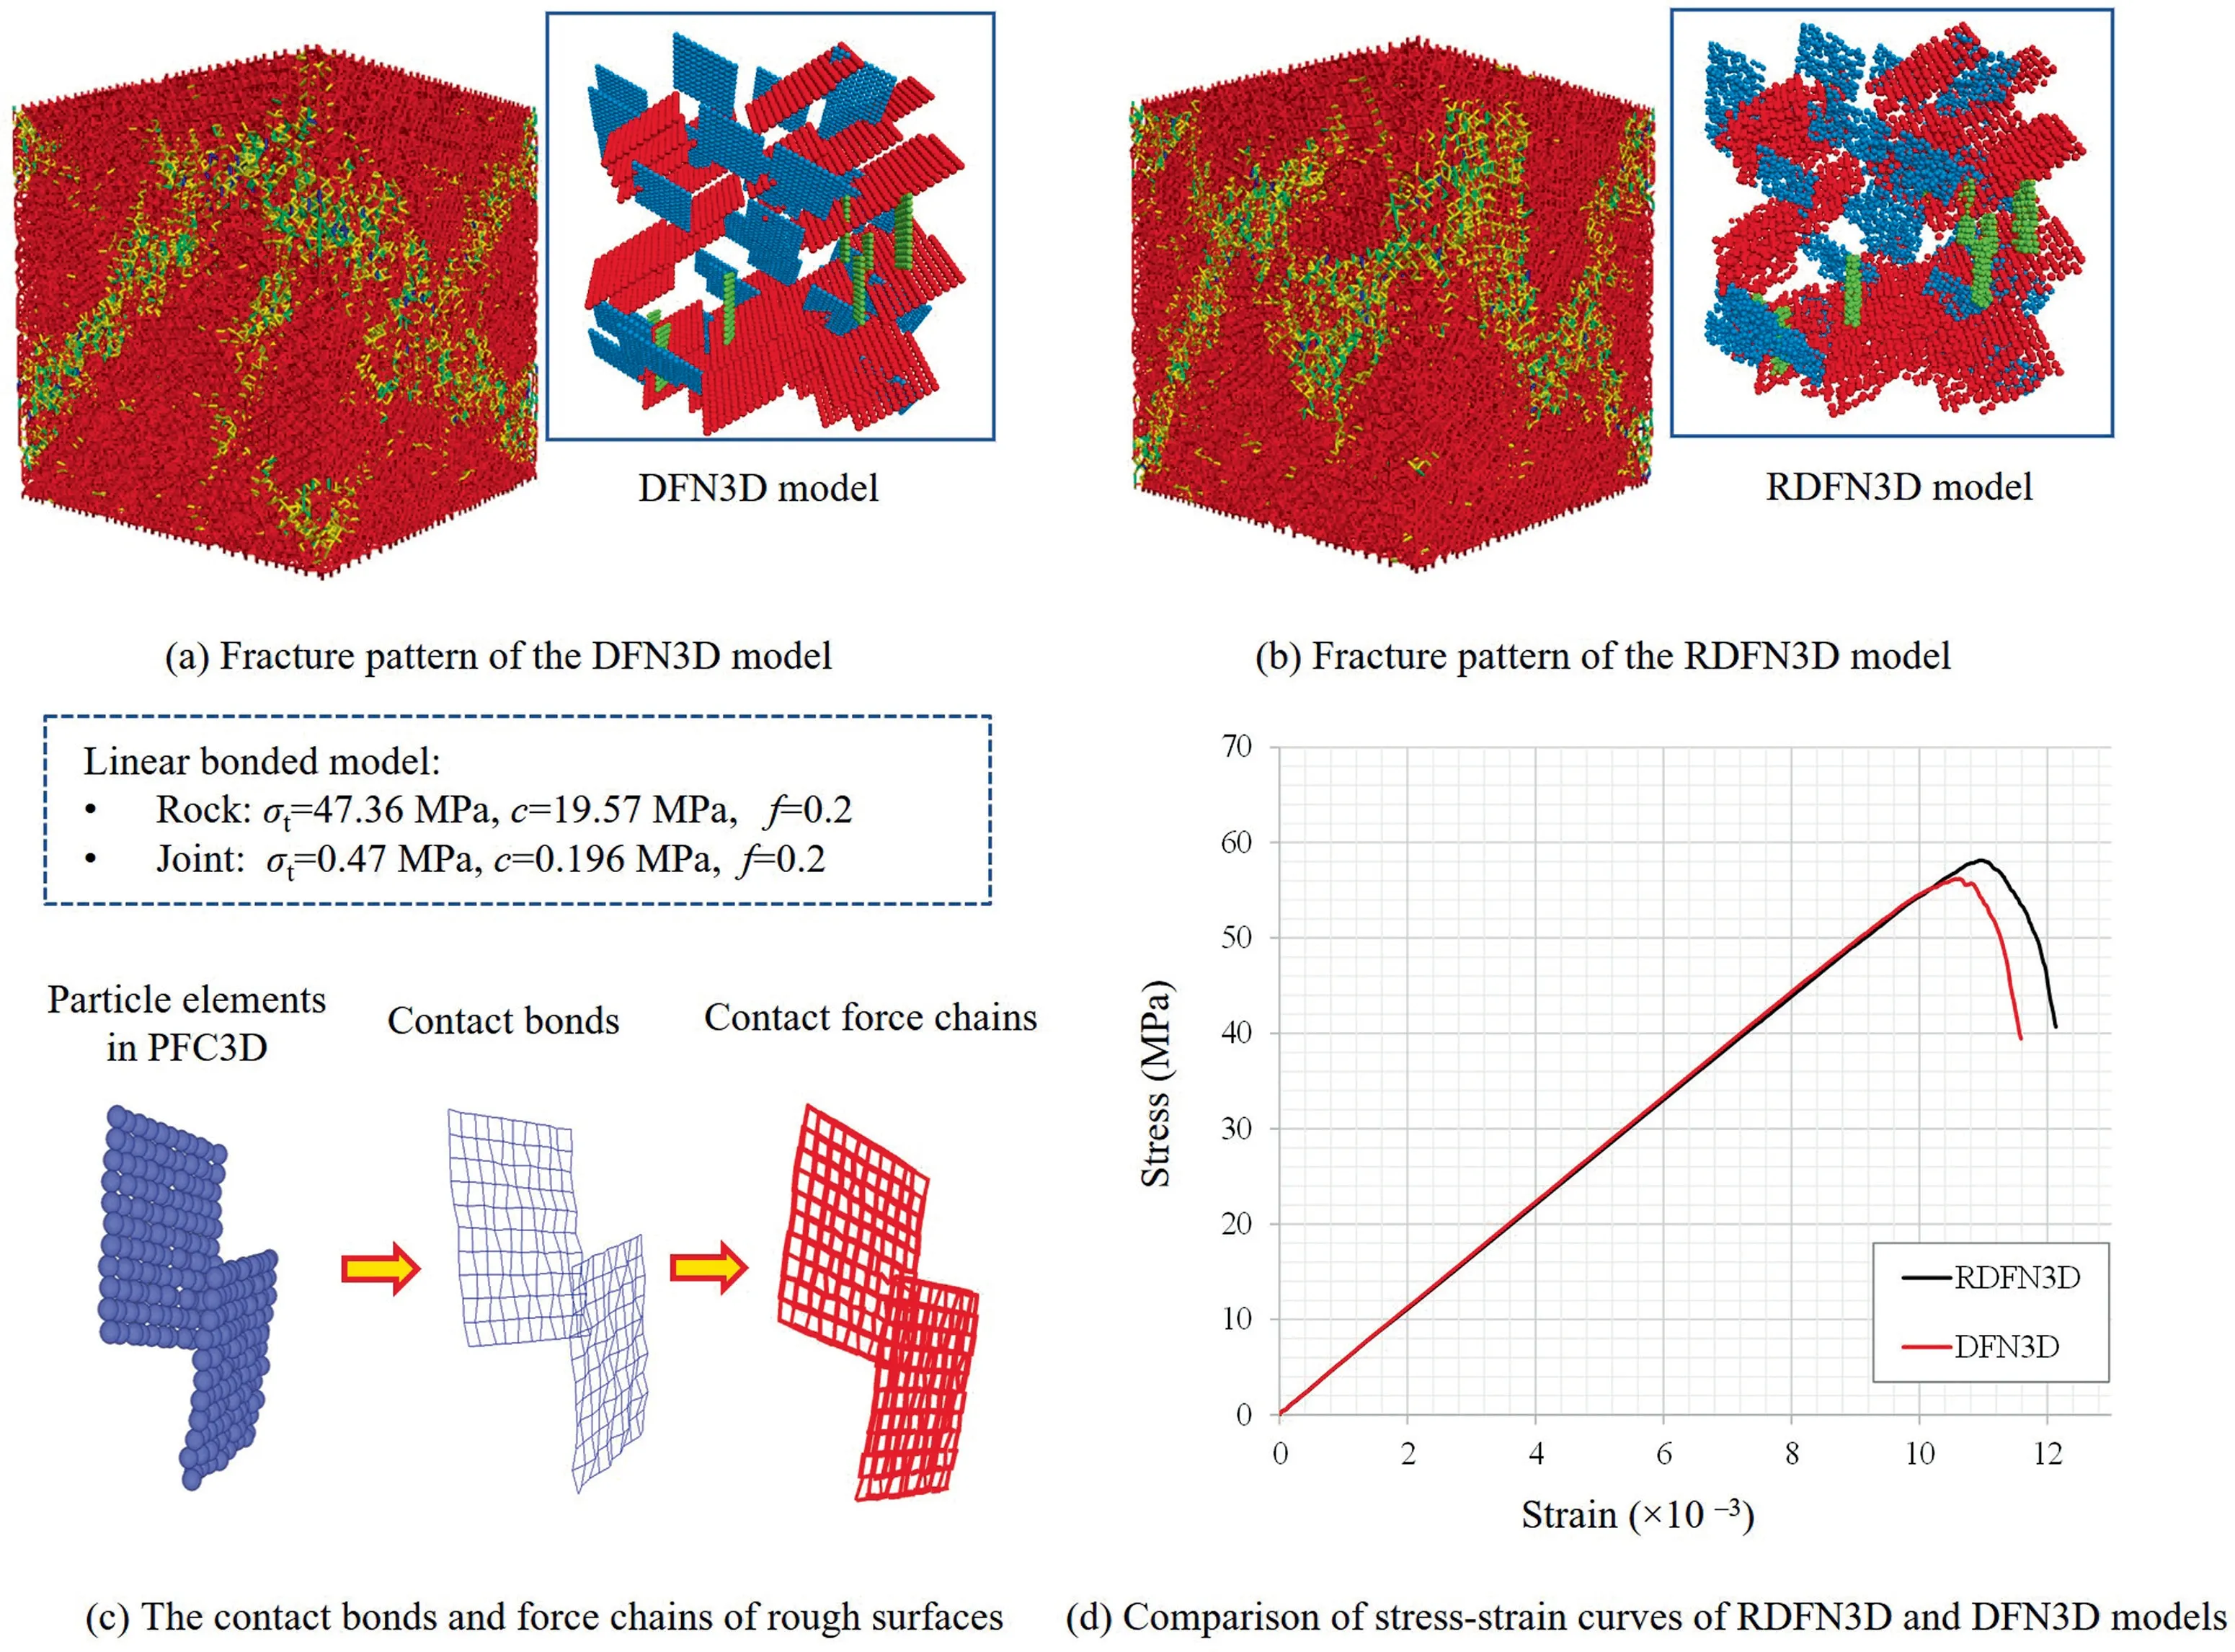
Fig.13.Comparison of the mechanical properties of DFN3D and RDFN3D models in PFC3D code.
4.2.Application in COMSOL modeling
Fig.14a shows the comparison of the established RDFN3D and DFN3D models.Fig.14b shows the exported DXF file in AutoCAD software.Fig.14c shows the 2D profiles of both the RDFN3D and DFN3D models.It should also be noted that the model can be exported to STL format for future 3D printing.Here,the RDFN3D model could be exported as a DXF format file and then imported to the FEM model.Fig.15a shows the FEM models in the COMSOL Multiphysics code.The characteristics of the hydraulic flow of two RDFN3D models were discussed based on Darcy’s flow relationship.Fig.15b shows two crossing fractures and the flow vectors along the rough surfaces.The connectivity parameters of the RDFN3D and DFN3D,especially the geometry and intersection length are apparently different,which coincides with the theory about the fracture connectivity by Li et al.[27,28].This result has a good application prospect in the studies for the mechanical properties of naturally fractured reservoirs.
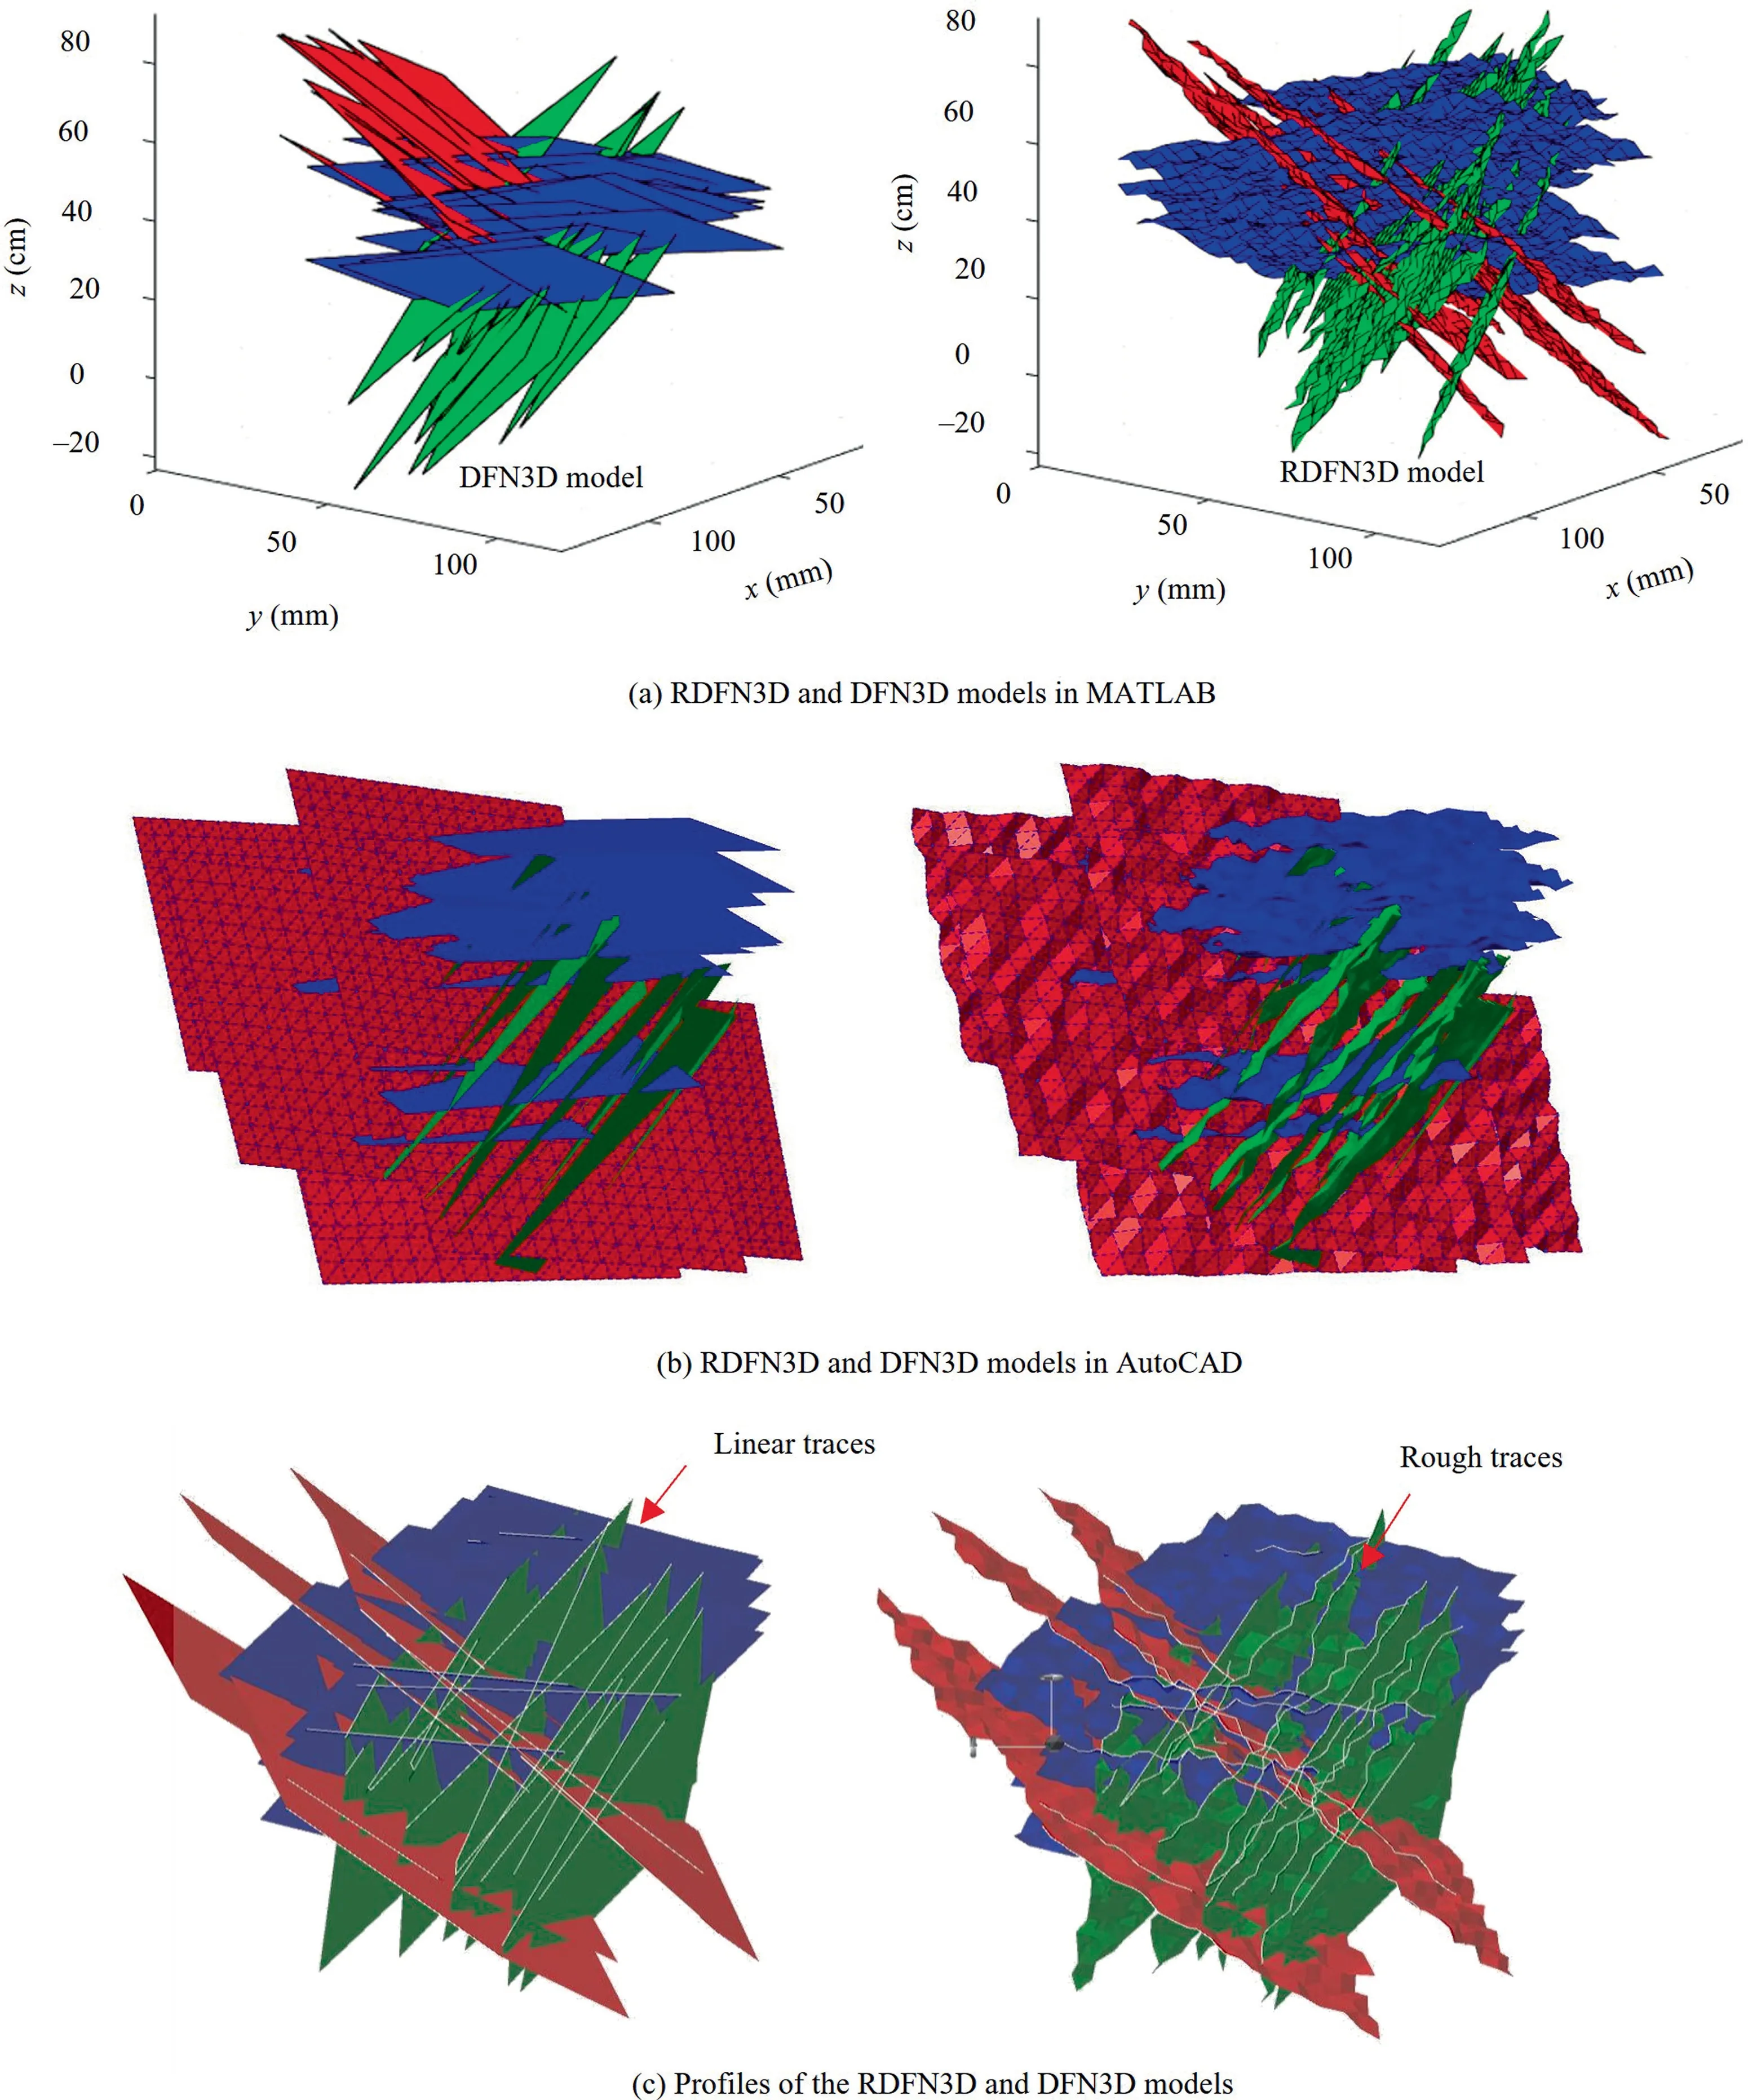
Fig.14.The comparison of RDFN3D and DFN3D models of the DXF format file.
The water pressure in the inlet and outlet is 1 and 0 kPa,respectively.Other boundaries are set to impermeable.The density and the dynamic viscosity of the fluid are 1000 kg/m3and 1.001×10⁻⁶Pa·s,respectively.The coefficient of permeability is 1×10⁻⁸m2.The movement of fluid within the rough surface flows forward around the concave and convex regions,forming a high flow velocity region at a relatively smooth location.Meanwhile,in the concave and convex body,a distinct low flow velocity region was formed in the fluid in the rough fissure channel.This means that a resistance would be formed at the concave and convex areas.The fluid flow in the rough crossing fractures shows the same pattern as in the single surface.Fig.15c shows the comparison of the seepage flow in the RDFN3D model and DFN3D model.The aperture of the fractures in both joint models is 1.0 mm.It can be observed that the flow field of the flat fracture surface is more uniform when the fluid flows from the left inlet to the right side,while the flow direction of the rough fracture surface is more complicated due to the influence of undulation,and there are several high-speed and lowspeed flow regions.The results prove the importance of the surface roughness on the flow patterns along the connected planes.Meanwhile,the orientation of the flow vectors was affected by the waviness,which means that the roughness of fractures should not be neglected when dealing with the fluid flow or solute transport in the fracture-matrix systems.
4.3.Comparison of RDFN model with DFN model
Compared with the DFN model,the roughness characteristic of the natural discontinuities is taken into account in the RDFN model.In terms of computational efficiency and result accuracy,the computational efficiency of both models is roughly equivalent,which mainly depends on the number of particles when the DFN model and the RDFN model are simulated in PFC3D.However,the computational efficiency of the RDFN model in the FEM simulation,such as the COMSOL Multiphysics code,is different from that of the DFN model.The bottleneck problem for the rough surfaces is still mesh generation.Thousands of rough surfaces could be generated in the digital RDFN model.However,fewer rough surfaces could be successfully partitioned into meshes for mechanical analysis.More efforts should be taken to apply the RDFN3D model in the rock engineering.
5.Conclusions
(1) We proposed a novel 3D rough discrete fracture network model,which considers the joint roughness,to analyze the mechanical behavior.The methodology for constructing the 3D rough surface network was introduced.A corresponding program was developed to export both the RDFN3D and DFN3D models to AutoCAD,PFC3D,and COMSOL Multiphysics.
(2) The single 3D structure was characterized on the basis of the W-M fractal surface.The influence of the dominant parameters on the surface waviness was systematically discussed.The fractal dimension (D) could influence the waviness frequency of the roughness of the surface.The higher the fractal dimension,the lower the waviness of the rough surface.The fractal roughness(G)could affect the amplitude of the rough surface.The maximum value of the rough surface will increase as the value ofGincreases.The surface precision(Pr)determines the number of mesh grids which determines the complexity of the rough surfaces.A smooth surface is obtained when the value ofPris zero.The higher the surface precision,the more complex the rough surface will be.
(3) The combination ofGandDwas verified to dominate the shape and roughness of the rough surfaces.A relationship of the W-M surfaces with the natural discontinuities was established.The quantitative relationships between the ten typical JRC curves and the dominant parameters (D,G,Pr)were established.Reference parameters for the 3D reconstruction of rock structures based on JRC3D were provided,which will help in the selection of geometric values for the characterization the natural structural planes.
(4) The proposed RDFN3D model has been successfully exported to PFC3D and COMSOL Multiphysics codes as well as the AutoCAD 3D modeling software,which provides more probabilities for future research.The roughness and waviness of the structural planes dominate the fracture patterns of jointed rock mass subjected to compression.The roughness of the intrinsic structures in the RDFN3D model can slightly increase the compressive capacity of jointed rock mass.The roughness and spatial connectivity of the fracture network were found to dominate the fluid flow patterns.
Acknowledgements
This work was financially supported by the National Key R&D Program of China (No.2021YFC2900500),the National Natural Science Foundation of China (Nos.52074020 and 42202306),the Open Fund of State Key Laboratory of Water Resource Protection and Utilization in Coal Mining(No.WPUKFJJ2019-06),the Interdisciplinary Research Project for Young Teachers of USTB(Fundamental Research Funds for the Central Universities) (No.FRF-IDRY-21-001),and the Natural Science Foundation of Jiangsu Province,China (No.BK20200993).
杂志排行

矿业科学技术学报的其它文章
- Extraction and imaging of indicator elements for non-destructive,in-situ,fast identification of adverse geology in tunnels
- Study on damage-stress loss coupling model of rock and prestressed anchor cable in dry-wet environment
- Mechanical response and microscopic damage mechanism of pre-flawed sandstone subjected to monotonic and multilevel cyclic loading:A laboratory-scale investigation
- Mechanism of gas pressure action during the initial failure of coal containing gas and its application for an outburst inoculation
- Morphological evolution and flow conduction characteristics of fracture channels in fractured sandstone under cyclic loading and unloading
- 3D forward modeling and response characteristics of low-resistivity overburden of the CFS-PML absorbing boundary for ground-well transient electromagnetic method