Performance optimization of scintillator neutron detectors for EMD in CSNS
2023-12-02XiaojieCai蔡小杰QianYu于潜ChangHuang黄畅BinTang唐彬ShihuiZhou周诗慧XiaohuWang王小胡XiupingYue岳秀萍andZhijiaSun孙志嘉
Xiaojie Cai(蔡小杰), Qian Yu(于潜), Chang Huang(黄畅), Bin Tang(唐彬),4,†, Shihui Zhou(周诗慧),Xiaohu Wang(王小胡), Xiuping Yue(岳秀萍), and Zhijia Sun(孙志嘉),4,§
1Spallation Neutron Source Science Center,Dongguan 523803,China
2Southwest University of Science and Technology,Mianyang 621002,China
3Institute of Modern Physics,Chinese Academy of Sciences,Lanzhou 730000,China
4Institute of High Energy Physics,Chinese Academy of Sciences,Beijing 100049,China
5Shenzhen Key Laboratory of Ultraintense Laser and Advanced Material Technology,Center for Advanced Material Diagnostic Technology,and College of Engineering Physics,Shenzhen Technology University,Shenzhen 518118,China
Keywords: scintillator neutron detector,silicon photomultipliers,wavelength shifting fiber, 6LiF/ZnS scintillator,detection efficiency inhomogeneity
1.Introduction
With the rapid development of neutron scattering technology,the scattering technology based on high intensity source is gradually playing an irreplaceable important role in the fields of material science and life science.
The spallation neutron source produced by acceleratordriven charged particles (such as protons, etc.) can provide high effective neutron flux, superior pulse time structure,and rich high-energy short-wavelength neutron combined with time-of-flight technology.[1]Engineering neutron diffraction can nondestructively and noninvasively probe stress,strain, temperature, and phase evolutions deep within bulk materials.[2]The mechanical behavior of real time can be achieved by applying temperature and tensile environment to the sample through the load platform,and thus provide strong technical support for manufacturing process, failure analysis,and so on.Chinese spallation neutron source is one of the four largest pulse spallation neutron sources in the world.Engineering material diffractometer (EMD), which can realize high-precisionin-situstress and strain detections of materials, will be constructed at the Beamline 8 between 2019 and 2023.It will serve for deep stress detection and dynamic change research of materials.A novel thermal neutron detector has been developed for the requirements of EMD applications.The detector consists of6LiF/ZnS(Ag)scintillation screens,wavelength-shifting fiber(WLSF)arrays silicon photomultipliers(SiPMs), and application specific integrated circuit(ASIC)read-out electronics.There are 14 detector modules with nearly 3 m2covered area has been assembled in two 90◦neutron scattering positions in the scattering room of EMD phase I.Before their installation, the performances of all the detector modules need to be tested.[3]Due to the existence of various influencing factors in the production process,the performances between each detector modules and between each channel in one detector are not consistent.The inhomogeneity detection efficiencies between each pixel and each detector are not consistent.[4]The inhomogeneity mainly caused by the inconsistency of the WLSFs in collecting scintillation photons,needs to be mitigated before the detector installation.In this work,the detection efficiency and its inhomogeneity of the detector module has been tested in BL.20 in CSNS.By adjusting the readout electronics threshold of each pixel, the detection efficiency inhomogeneity has been improved.A standard Si powder sample was also used to prove the diffraction peaks achieved by all the optimized detector modules,and it worked correctly.
2.Working principle and structure of scintillator detector
The scintillator neutron detectors for neutron spectrometers have been developed in CSNS since 2011.Version I scintillator detectors with6LiF/ZnS(Ag) screens, wavelength shifting fiber (WLSF) arrays, and multi-anode photo multiplier tubes (MA-PMTs) have been successfully installed and operated well in general purpose of powder diffractometer(GPPD)in CSNS.[5]The detector adopts the upper and lower double scintillation screens intermediately sandwiched for two-dimensional wave shifted fiber array structure, as shown in Fig.1.
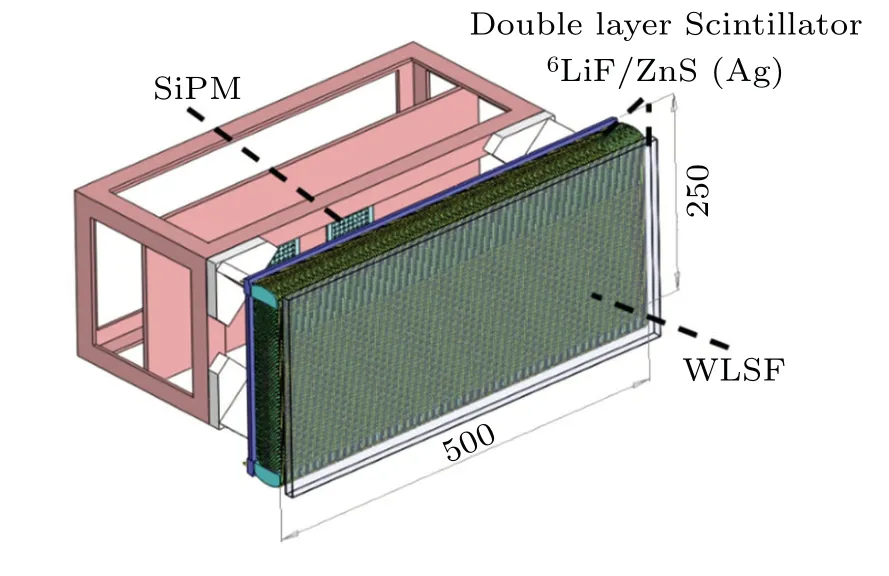
Fig.1.Scintillation detector unit structure diagram.
In such detectors, the6LiF/ZnS(Ag) screens convert the incident neutrons into secondary charged particles which cause the scintillation photons in the following reaction:
n+6Li→α(2.05 MeV)+3H(2.73 MeV).
The purpose of this design is to increase the thickness of the scintillation screen and increase the probability of neutrons reacting with6Li nuclide in the scintillation screen to release more photons.[5,6]
However,the EMD requires higher demand for detection efficiencies.The detection efficiency of the scintillation screen depends on the probability of nuclear reactions between neutrons and6Li nuclide, and photon emission probability in the scintillation screen.Therefore,we designed the detector with oblique incident shutter structure.[7]
Version II scintillator detector developed for the EMD application achieves higher detection efficiencies.This detector module is composed of inclined6LiF/ZnS(Ag)scintillation screens (scintillator/ND/300-µm thickness with6LiF:ZnS mass ratio 1:2), wavelength-shifting fiber array (WLSF, Kuraray/Y11(200)M/roundϕ1 mm with 200 ppm wave shifting doping), the silicon photomultiparray(SiPM,SENSL/miroFC-30035-SMT), and the ASIC readout electronics.The fluorescing light is collected by the WLSF which absorbs blue light and reemits green light.The green light was transmitted to the end surface of the WLSF,which is coupled to the SiPMs by silicon oil.SiPMs convert the optical signals into pulsed electrical signals.The signals are amplified, shaped, and discriminated by custom-designed read-out ASIC electronics and converts them into digital signals which will be input to the FPGA chip for further processing.[8]Different from the traditional discrete component electronics,the ASIC has the advantages of high integration and low power consumption,which is more suitable for engineering applications of multi-pixel detectors.As shown in Fig.2,the head of the detector adopts oblique incident shutter structure.It could improve the detect efficiency effectively because the opaque6LiF/ZnS(Ag) scintillation screen makes the incident path of the neutron larger, while the outgoing path of the fluoresce light is not changed.The tilt angle of the scintillation screen is designed as 17◦to the incident neutron.
The WLSF arrays distributed longitudinally on the surface of the scintillation screen to collect the fluorescence from the neutron screens.[7]
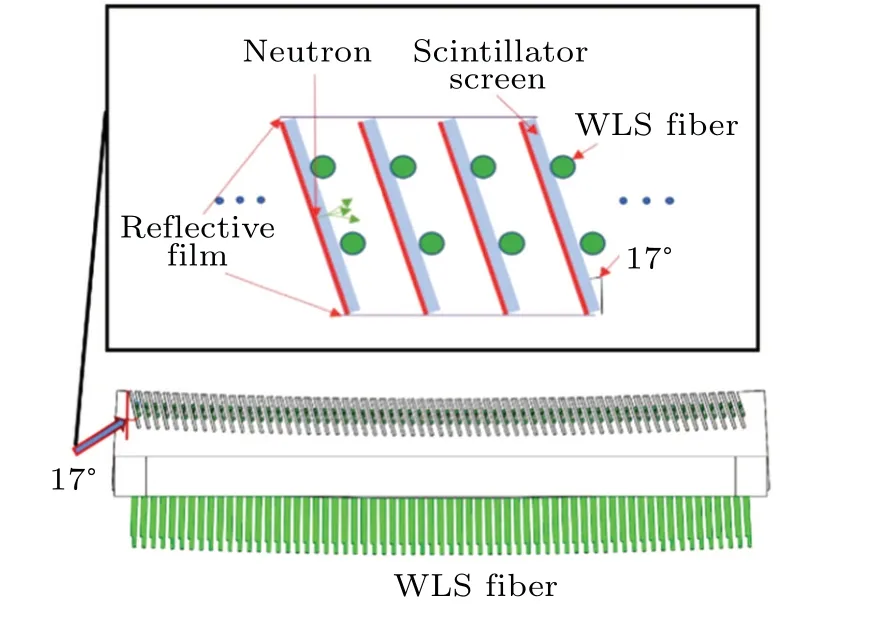
Fig.2.The schematic diagram of the detector head.
In order to verify the fact that the optimal detection efficiency can be achieved when the scintillation screen of the detector is tilted at an angle of 17◦.We used GEANT4 to simulate the detector structure of the scintillation screen at different tilt angles.Figure 3 is the neutron conversion efficiency of the scintillation screen under various tilt angles at different wavelengths.The results show that with the decrease of the tilt angle between the scintillation screen and incident neutrons,the detection efficiency of the scintillation screen increases gradually.Considering that the pixel size is 3 mm and the space requirement of the WLSF arrangement, the inclination angle of the scintillation screen of the detector is designed as 17◦.The neutron reaction efficiency of the scintillation screen could reach 81.2%@1 ˚A neutron wavelength.

Fig.3.The neutron reaction efficiency of the scintillation screen under various tilt angles at different wavelengths.
The hade of the detector module is designed as a circular arc with a diameter of 2 m to realize circular neutron detection detector cell with common mechanical chamber for supporting and light shielding.Figure 4 shows the photo of the detector cell.Five detector modules are also fixed to the mechanical support frame to form an arc-shaped construction with the radius of 2 m.Except the neutron incident window,the out-shell of the cell adopts boron-containing aluminum plates to protect it from neutron radiations.Each module in the cell consists of 643 mm×180 mm size pixels.The cell dimensions are 1066 mm (length)×203 mm (height)×450 mm (thickness).All the detector cells are mounted on the bank bracket according to the laser positioning data.
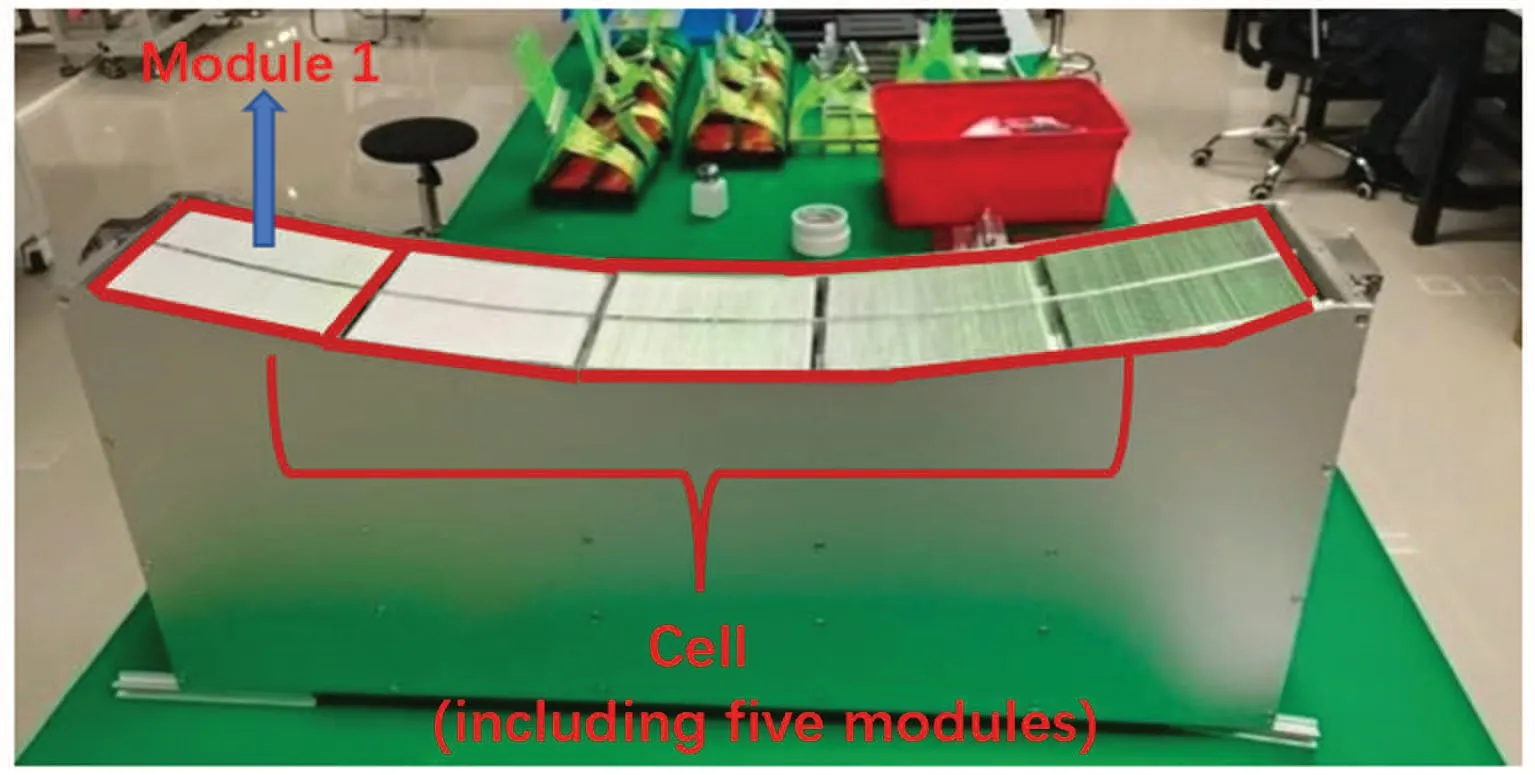
Fig.4.Photo of a detector cell consist of 5 detector modules.
3.Performance test of the detector module
According to the physical design of EMD, the main parameters of the scintillator detector are detection efficiency and detection efficiency uniformity.The consistency of position resolution of the detectors is mainly determined by the accuracy of the mechanical processing and the optical isolation for each pixel.These differences are usually small.However the detection efficiency performances for each of detector modules and for each of pixels are not consistent.It mainly related to the uniformity of tilt angle and the thickness of the scintillation screen, the uniformity of the optical transmission efficiency of each WLSF from its bending and coupling process,and the uniformity of the gain of each SiPM.The uniformity of the thickness of the scintillation screen is less than±5%according to the examination report from the manufacturer.The difference of the tilt angle is also less than 1◦(±6%)by the finish machining of the mechanical support.The gain difference of each of SiPMs is less than±5%according to the manufacturer quality report.The uniformity of the optical transmission efficiency of each WLSF from its bending and coupling process is less than±10%with the manufacturing process quality control.All these differences may cause a maximum difference of 1.6 times inhomogeneity of the detect efficiency for each of pixels.So before the detector modules installation,the inhomogeneity needs to be measured and mitigated.
The typical way for the calibration of the detection efficiency is using isotopic neutron source with 4πemitting uniformly.[9,10]
It will cost quite long time for all the detector pixel detections to gain a good efficiency uniformity.The time schedule of the EMD installation is not allowed us to do such an experiment.
The BL.20 neutron beam line of the CSNS is designed specifically for the detector testing.We use high incoherent neutron scattering sample to disperse the neutron beam and the neutron counts of each pixel.By adjusting the readout electronics threshold of each pixel, the inhomogeneity of the neutron detect efficiency can be improved.
3.1.Experimental setup
The BL.20 beam line in CSNS uses a decoupled narrowing liquid hydrogen moderator.After several collimations and absorption,the diameter of the neutron beam spots at the outlet is 20 mm.The neutron fluency is about 108n/(cm2·s).The neutron wavelength range is 0.2 ˚A–10 ˚A and can be changed by two chopper with 5.6-˚A bandwidth.The distance from moderator to the neutron outlet spot is about 9 m.Figure 5 shows the structure of the BL.20 beam line in CSNS.
The measurement setup for measuring relative detection efficiency is shown in Fig.6.The standard3He tube(LND252299/pressure 20 atm,1 atm=1.01×10⁵Pa)/diameter 1 inch,1 inch=2.54 cm)is placed to evaluate the incident neutron flux.
The outgoing neutrons pass through the beam limiting hole from the BL.20 beam line.The limited neutron beam then incident into the mica monochromator with an incident angle of 45◦.Because the distribution of the neutron wavelength from the BL20 is wide and the neutron flux is still too high for the3He tube,the mica(0 0 10)(0 0 8)monochromator is used to further reduce the neutron flux to prevent the count rate saturation of the3He tube and to choose special wavelengths of neutrons (wavelength 1.4 ˚A, 2.8 ˚A, and 4.8 ˚A) for calculating the detect efficiency accurately.in the beam exit.The detect efficiency can be calculated by the following formula:

Fig.5.The structure of the BL.20 beam line in CSNS.

Fig.6.Detection efficiency measurement setup diagram.
The time-of-flight(TOF)spectrum of the monochromatic neutrons is gained by the standard3He tube and the detector respectively in the same position.Both two neutron counts are measured normally by the counts of the beam monitor placed
whereNSDandN3Heare normalized neutron counts of scintillator detectors and standard3He tube respectively,andη3Heis the detection efficiency of standard3He tube detectors.
Using high incoherent neutron scattering sample, such as water or polyethylene, to disperse the neutron beam, the neutron counts of each pixel in each detector cell could be obtained.[11]These counts reflect the inhomogeneity of the neutron detection efficiency for each of pixels.The detector cells are placed in an aluminum bracket with 2-m distance from the sample.
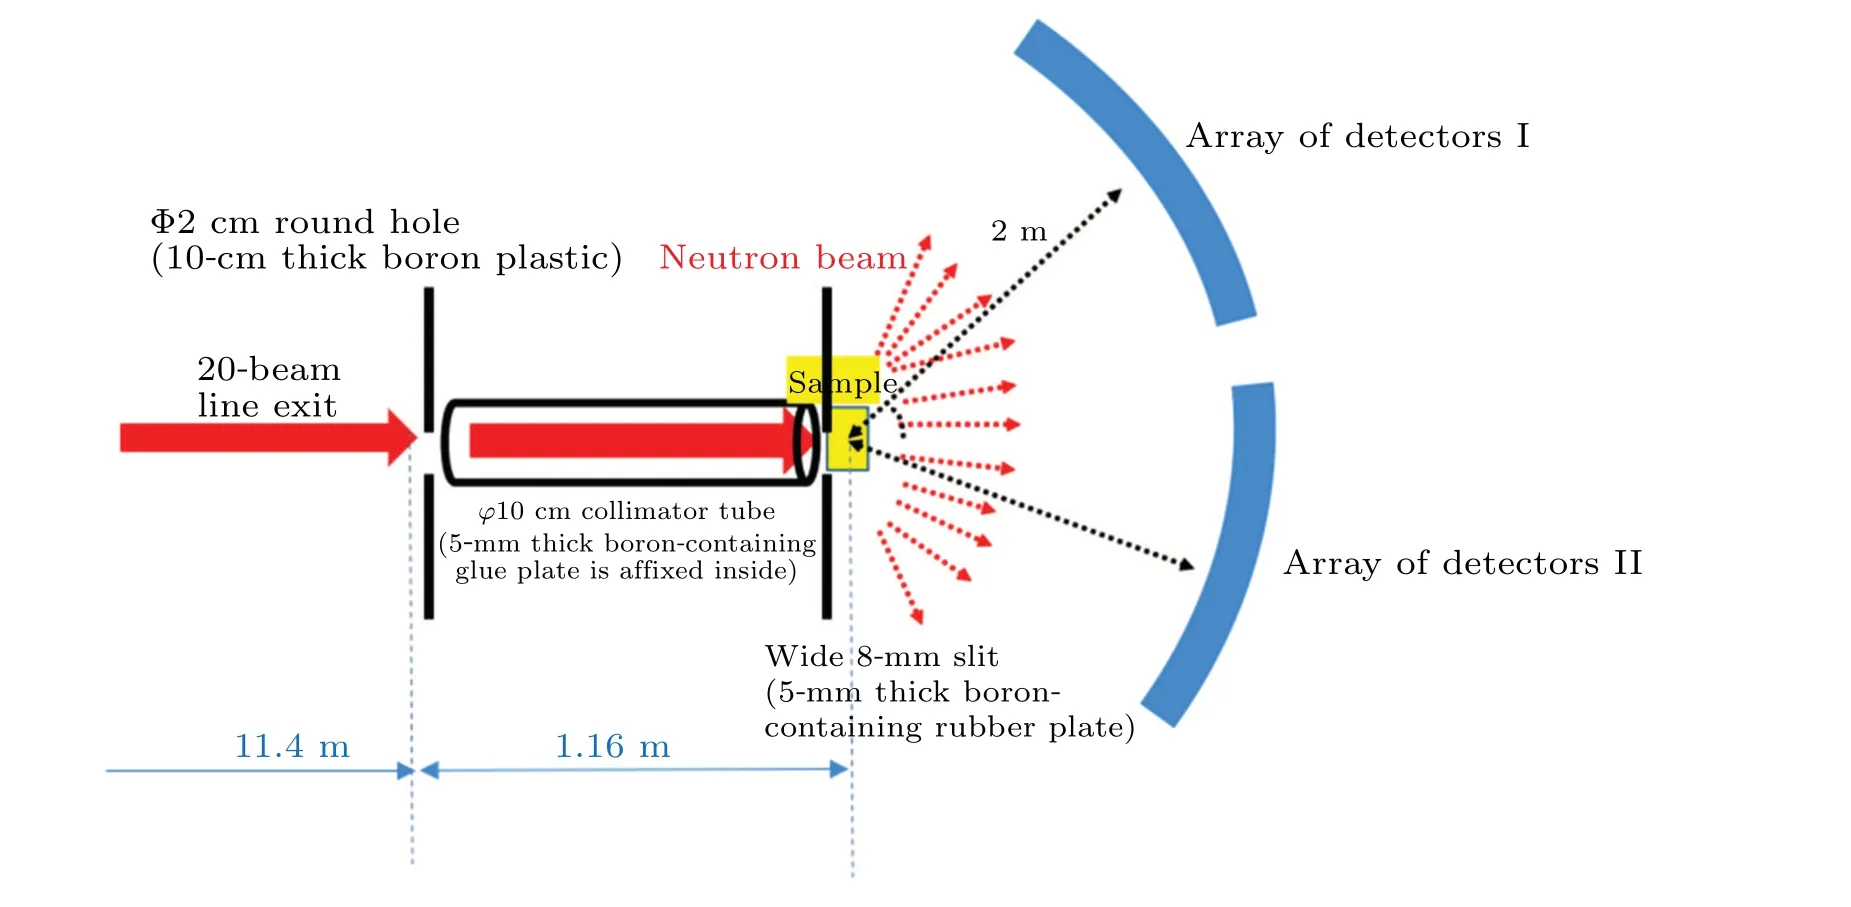
Fig.7.Field experimental test of imitating engineering material spectrometer.
And the angle between the center of the neutron beam line and that of the detector cell is 23◦,which is the maximum angle that the scattering room of the BL.20 beam line can be placed.The inhomogeneous area of the neutron scattering in forward direction for water sample needs to be avoid.The aluminum bracket can place 7 detector cells trying to simulate the actual placement of the detector cells in EMD.The schematic diagram of the experimental set-up is shown in Fig.7.
A boron-containing rubber plate collimating tube with 1.16-m long,10-cm diameter,and 5-mm thickness was placed at 11.4-m position from the beam hole.The collimating tube reduces the neutron divergence.A slit with 8-mm width was set in front of water sample.Finally, the diffracted neutrons incident into the detectors in 2-m arc.And in order to reduce the spatial neutron background, all the tables were wrapped with boron-containing polyethylene.Before measurements,the uniformity of the moderated neutrons after 2-cm thickness water with 10 cm×10 cm area was simply simulated by GEAN4.A cured ideal neutron detector with 6 m×6 m area was placed on a 2-m arc.The moderated neutrons counting distribution is approximately uniform in a range of angles 10◦–25◦between the neutron incident direction and the ideal detector.
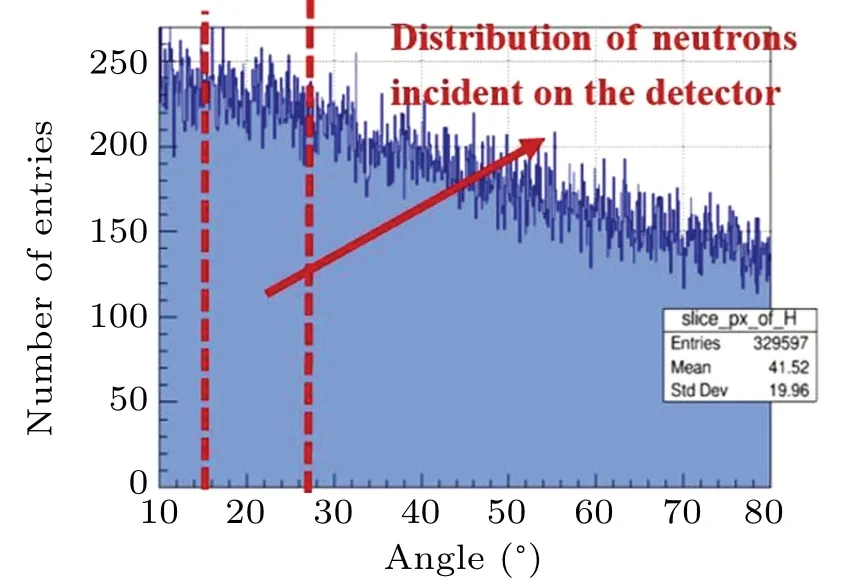
Fig.8.GEANT4 simulation results.
The diffraction peak of the stander sample could be calculated through the data of the detector by changing water to stander Si powder in the later stage.
3.2.Measurement results and discussion
Using the mica monochromator, the counts for neutron wavelengths of 2.9 ˚A and 1.4 ˚A for the standard3He tube and that of the scintillator detector were obtained.And the inner wall is fitted with a 5-mm polyethylene block collimated pipe being placed at 11.4-m position from the beam hole.The collimating tube reduces the neutron divergence.A slit with 8-mm width was set in front of the water sample.Finally, the diffracted neutrons incident into the detectors with 2-m distance.And in order to reduce the spatial neutron background,all the tables was wrapped with boron-containing polyethylene.The diffraction peak of the stander sample could be calculated through the data of the detector by changing the water to stander Si powder in the later stage respectively.
3.2.1.Detection efficiency
The incident neutron wavelength can be calculated by the TOF(time of flight)way using the following formula:
whereLis the neutron flight distance,mnis neutron mass,andhis the Planck constant.The neutron wavelength spectrum can be calculated with this formula.
The TOF spectrum of the standard3He tube and the particularly pixel of the detector is calculated and is shown in Fig.9(a).We find that the two characteristic peaks with wavelengths 1.4 ˚A,2.8 ˚A,and 4.8 ˚A are clear.However,in the short wavelength part(1 ˚A–2 ˚A),the spatial neutron background is more serious in the TOF spectrum.The reason is that part of the short wavelength neutrons background cannot shielded effectively by the boron-containing polyethylene.
By calculating the total number of neutrons in the specific wavelength segment,such as 1.38 ˚A–1.42 ˚A or 4.78 ˚A–4.82 ˚A,the detection efficiency of the corresponding wavelength of the detector can be obtained by using formula (1).the detection efficiency of the scintillator detector is 53%@1.4 ˚A,77%@2.8 ˚A,and 88%@4.8 ˚A,respectively.
Figure 9(b) is the detection efficiency curve for the particularly pixel of the detector.The difference in detection efficiency between the three pixels can be seen from the picture.This will affect the accuracy of the test result of samples in the engineering application of the stress testing.
Therefore, the detection efficiency of the detector needs to be optimized.In the later stage, the detection efficiency of each pixel of the detector needs to be modified to further reduce the influence of the non-uniformity of detection efficiency on the stress testing result of the sample.
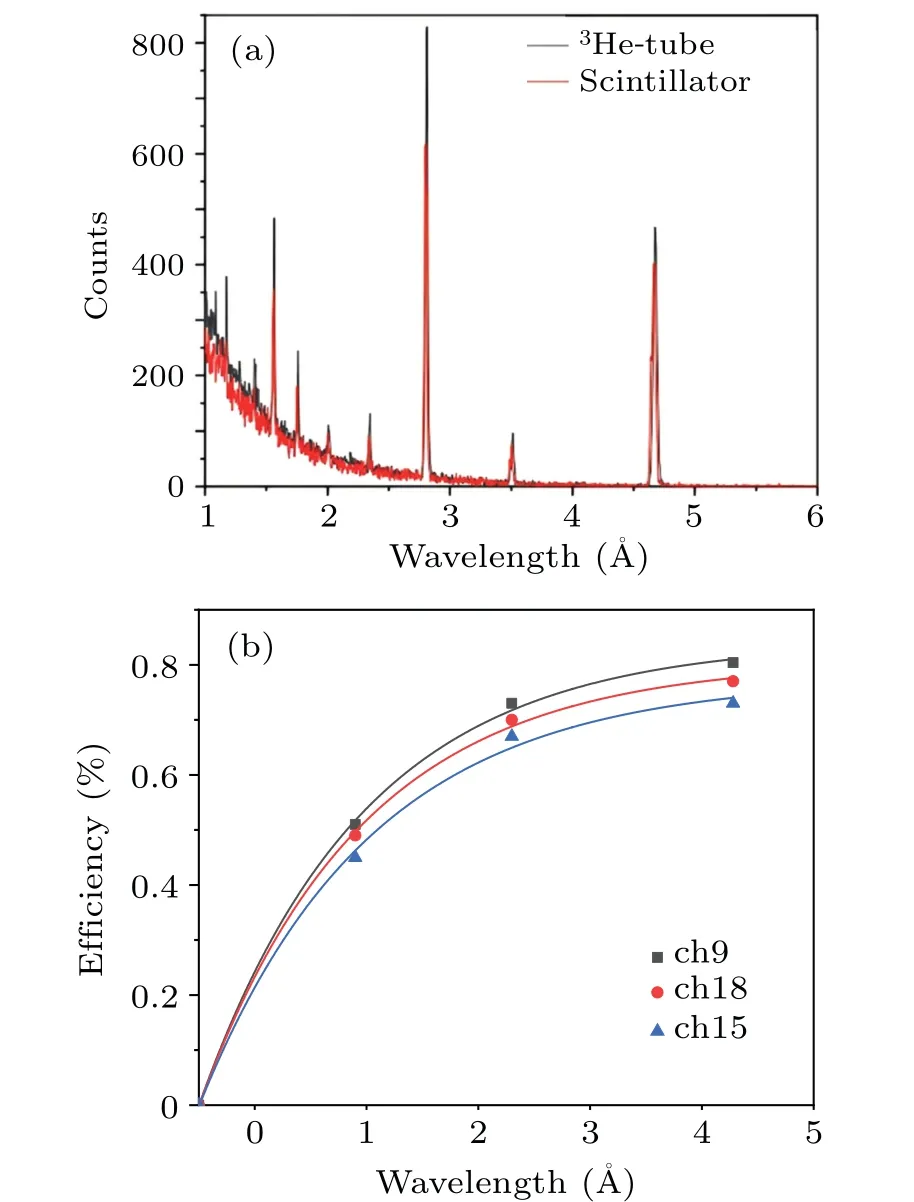
Fig.9.TOF spectra obtained by the standard 3He tube and the prototype scintillator detector(a).The detection efficiency of the scintillator detector as a function of neutron wavelength(b).
3.2.2.Detection efficiency uniformity
According to the former test of the neutron signal charge spectrum(see Fig.10)of the scintillator detector module with the252Cf radioactive source, the signal spectrum is a wide Landau distribution.This is caused by the second particle energy loss distribution of the6Li(n, d)αnuclear reaction, the opacity of the6LiF/ZnS(Ag) scintillator, and the optical collection efficiency difference of the round WLSFs for different incident scintillate photon positions.When the electronics threshold is setting between 1 pc and 5 pc,the neutron signals can be separated from the background noise,and the detection efficiency can maintain in 40%–60%@1.4 ˚A.

Fig.10.The neutron signal spectrum of the scintillator detector.
This means that by adjusting the electronic thresholds of each channel of the detector,it is possible to optimize the uniformity of the detector efficiency of the scintillator detectors.For stress measurement, the inhomogeneity of detection efficiency of the detector cannot guarantee the accurate measurement of continuous stress of the sample.Only with better uniformity of the detection efficiency can the weak stress variation of samples be detected.[12]
Before the neutron uniformity measurement,the standard detector MWPC is used to test the spatial uniformity of neutrons.By this testing,the moderated neutrons counting distribution is approximately uniform.Thus the neutrons are generally uniformly distributed.[5]
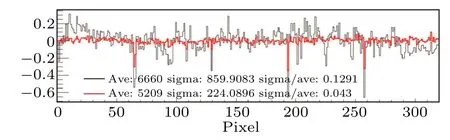
Fig.11.A comparison of neutron counts for each channel changed before and after adjusting electronics.
By adjusting the threshold of each channel to optimize the neutron counts uniformity of the detector,the uniformity of the neutron counts for each pixel are greatly improved.Figure 11 shows the neutron counts distribution of a detector cell before and after the adjusting.The original neutron counts distribution showed that the detect efficiency non-uniformity caused by the device difference is obvious.The way of adjusting the electronics threshold only optimizes the detect efficiency in a limiting range.If the difference caused by the wrong operation in manufacturing process or caused by the bad device performance is too large, the detect efficiency homogeneity of the pixel is hard to be optimized to an acceptable level,such as 3 pixels shown in Fig.11.In general,the efficiency uniformity of the detector can be optimized to be better than 90%.
Figure 12 shows the neutron counts distribution of all 14 detector cells after electronics threshold adjusting.We can see some bad channels in several cells, such as pixel 128, pixel 192, and pixel 256 still had bad performance.It is mainly caused by the WLSF break in the processing according to our return inspection.
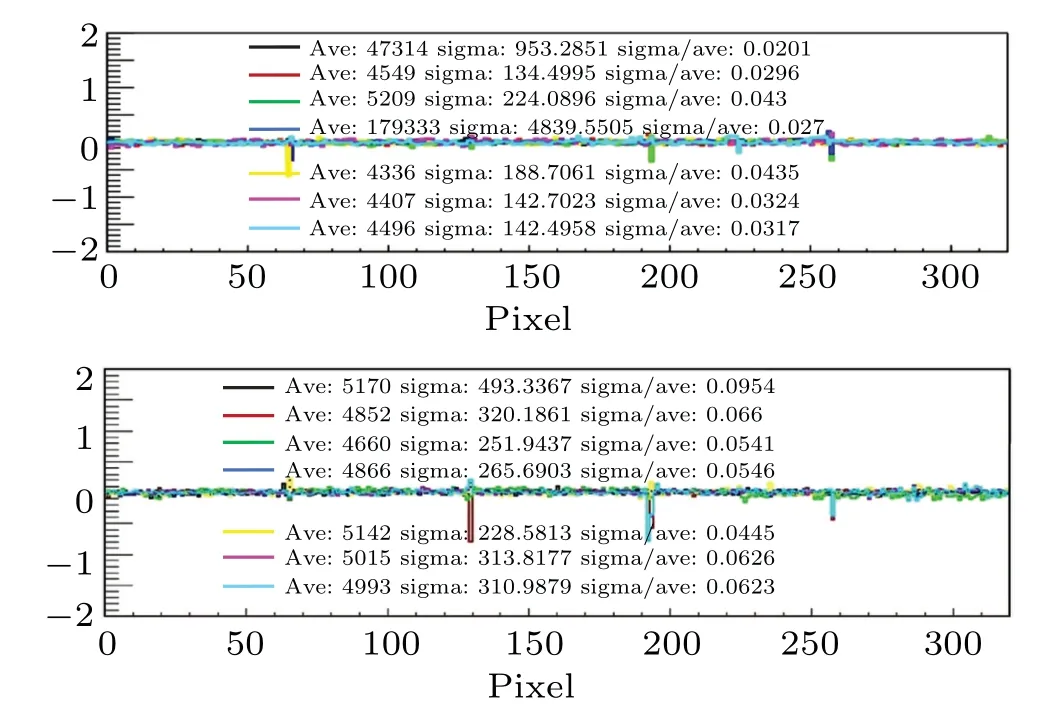
Fig.12.The uniformity of fourteen detectors after calibration.
The WLSF breakage will cause most of the light collected from the scintillation screen hardly being transmitted to the SiPM, which will result in a small signal in this channel.It is difficult to improve the neutron detection efficiency of these kinds of channels by adjusting the electronic threshold.
3.2.3.Standard Si sample testing
After the detect efficiency optimization tests for 14 detector cells, the standard Si powder samples are used to check the performance of all the detector cells.Figure 13 shows the diffraction spectrum of the standard Si powder sample obtained by the optimized detector.According to the Bragg’s diffraction formula
whereθis the angle between the incident direction of the neutron and the diffracted neutron.λis the wavelength of the neutron.Theλvalue can be obtained from the time-of-flight spectrum,and thus thedspectrum of the detector pixel can be obtained.
As can be seen from Fig.13, multiple diffraction peaks appear.By comparing the test results with the diffraction spectrum of the Si powder sample from the scintillator detectors of the GPPD in CSNS,it is shown that the numbers and the positions of the diffraction peaks are consistent.However, the results are interfered by the short wavelength neutrons background from the Si powder incoherent scattering.
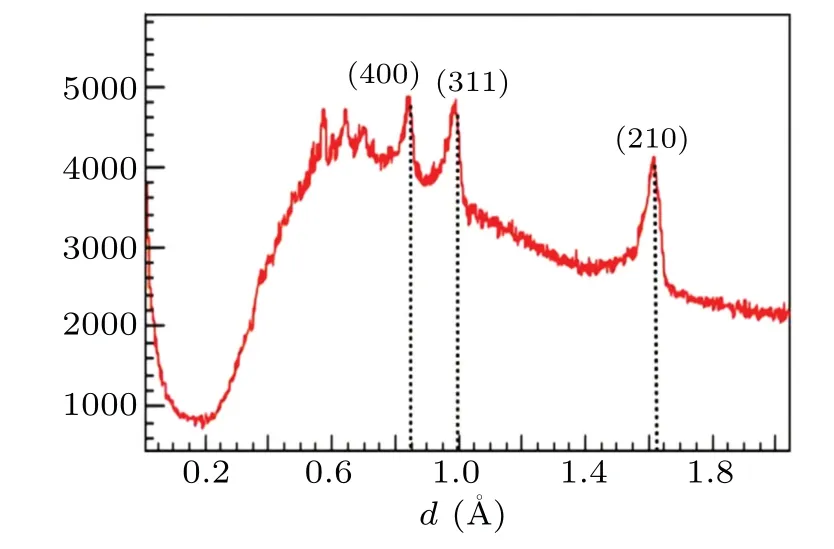
Fig.13.The diffraction spectrum of the standard Si powder sample obtained by the optimized detector.
4.Conclusion and outlook
By the testing performance of detectors,the detection efficiency of the detector is increased more than 40% at the wavelength 1.4 ˚A,which meets the design of the EMD spectrometer.The detect efficiency uniformity caused by small different fabrication processes of each independent devices of the detector cells is also measured by water sample experiment.The detection efficiency of each pixel channel of the detectors is optimized to be consistent by adjusting the electronics thresholds.The detection efficiency of several channels did not adjust to the better state because of the WLSFs break.After the optimization,the mean square error is less than 5%,and there is no obvious uneven interval.
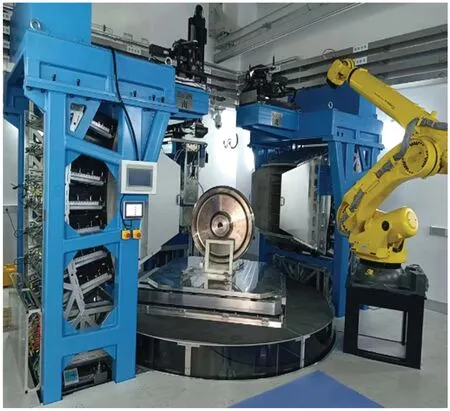
Fig.14.The EMD spectrometer real scene picture.
The performances of the testing detectors show that all the 14 fabricated detectors can be used in engineering applications in EMD.These new scintillator detectors not only meet the urgent needs of CSNS engineering, but also improve the level of neutron detection technology in our country.The EMD has great significance in the material science study.The EMD spectrometer real scence picture is shown in Fig.14.
The EMD spectrometer can provide domestic highperformance neutron detectors for many advanced neutron scattering experimental platforms in China, and at the same time, it can also serve as the stress measurement for material design and process upgrading and improvement.
The establishment of engineering material diffraction spectrometer will bring great help to solve the problems encountered by Chinese industry,especially to improve the level of China’s aerospace industry.
Acknowledgements
Project supported by the National Natural Science Foundation of China (Grant Nos.11975255 and 11875273) and Guangdong Basic and Applied Basic Research Foundation(Grant No.2020B1515120025).
杂志排行

Chinese Physics B的其它文章
- Optimal zero-crossing group selection method of the absolute gravimeter based on improved auto-regressive moving average model
- Deterministic remote preparation of multi-qubit equatorial states through dissipative channels
- Direct measurement of nonlocal quantum states without approximation
- Fast and perfect state transfer in superconducting circuit with tunable coupler
- A discrete Boltzmann model with symmetric velocity discretization for compressible flow
- Dynamic modelling and chaos control for a thin plate oscillator using Bubnov–Galerkin integral method