Subtle lattice distortion-driven phase transitions in layered ACu4As2(A=Eu,Sr)
2023-11-02YongNie聂勇ZhengChen陈正MingMei梅明YuanYuanWang王园园JiaTingWu吴嘉挺JiaLiangJiang蒋佳良WenHaiSong宋文海WeiNing宁伟ZhaoShengWang王钊胜XiangDeZhu朱相德andMingLiangTian田明亮
Yong Nie(聂勇), Zheng Chen(陈正), Ming Mei(梅明), Yuan-Yuan Wang(王园园),Jia-Ting Wu(吴嘉挺), Jia-Liang Jiang(蒋佳良), Wen-Hai Song(宋文海), Wei Ning(宁伟),†,Zhao-Sheng Wang(王钊胜), Xiang-De Zhu(朱相德),‡, and Ming-Liang Tian(田明亮),4,§
1Anhui Province Key Laboratory of Condensed Matter Physics at Extreme Conditions,High Magnetic Field Laboratory,Hefei Institutes of Physical Science(HFIPS),Chinese Academy of Sciences,Hefei 230031,China
2Department of Physics,University of Science and Technology of China,Hefei 230026,China
3Key Laboratory of Materials Physics,Institute of Solid State Physics,HFIPS,Chinese Academy of Sciences,Hefei 230031,China
4School of Physics,Anhui University,Hefei 230601,China
Keywords: thermal expansion,specific heat,lattice-distortion
1.Introduction
The compounds composed of transition metal cations and pnictide anions provide a rich platform for studying novel physical phenomena and various phase transitions,such as structural phase transition,[1]superconductivity,[2]magnetism,[3,4]and charge density wave (CDW) order.[5,6]For example, in BaAg2As2, an anomalous resistivity peak was observed at 150 K which derives from a structural distortion with the in-plane distortion without CDW and band reconstruction.[7]In the doped BaFe2As2, high temperature superconducting phase occurred in the vicinity of a collinear antiferromagnetic order and a tetragonal-orthorhombic structural distortion related to orbital/spin order.[8-10]Meanwhile,anomalous specific heat and electric transport were reported to be caused by a pure lattice-driven distortion in BaNi2As2,[11]so were the CDW-order-driven distortions in BaPt2As2and SrPt2As2.[5,6]Recently, it has been reported that SrAg4As2and EuAg4As2exhibit anomalous resistivity at 110 K and 120 K.[12,13]In EuAg4As2,an anomalous resistivity transition at~120 K was regarded as a first-order structural transition,which is accompanied with a superlattice,which is verified by the single-crystal x-ray precession images below 120 K.[13]Like EuAg4As2, EuCu4As2also displays an anomalous resistivity with a hysteresis at 75 K associated with structural distortion.[14]These findings suggest that further investigation of arsenides will be able to discover more exotic phenomena,which contributes to the study in this area.
In this work, we report on a study of two arsenidesACu4As2(A=Eu and Sr)combined,by the measurements of electric transport, magnetization, heat capacity, transmission electron microscope (TEM), and thermal expansion.These two compounds were synthesized as early as decades ago.However, their physical properties have not been well studied yet.Our transport and heat capacity measurements show a transition atTP~70 K in EuCu4As2and atTP~145 K in SrCu4As2.Thermal expansion reveals a subtle lattice parameter variation nearTPwhile the structural characterization of TEM shows no structure phase transition nor CDW below and aboveTP.These results are in sharp contrast to the previous observations of EuAg4As2and EuCu4As2.Our experimental data suggest that this transition is a nonmagnetic transition and relates to lattice distortion, which provides a clue to comprehending the transitions in EuCu4As2and SrCu4As2.
2.Method
The crystals of EuCu4As2and SrCu4As2were synthesized by using Bi flux method.The molar ratio of elements was Eu shots (3N purity)/Sr shot (3N purity): Cu plates (4N purity): As shots(4N purity): Bi shots(5N purity)=1:4:2:8.Oxide layer of Eu/Sr shots was scraped off from the surface.The mixture agents in the alumina crucible were sealed into a quartz tube under high vacuum.The furnace was heated to 950°C and held for 3 days, then slowly cooled to 680°C taking a week.The flux was removed by quick centrifugation.Several crystals each with a size of 2 mm×3 mm,were obtained,and the optical photographs of EuCu4As2and SrCu4As2are shown in the inset of Figs.1(b)and 1(c),respectively.
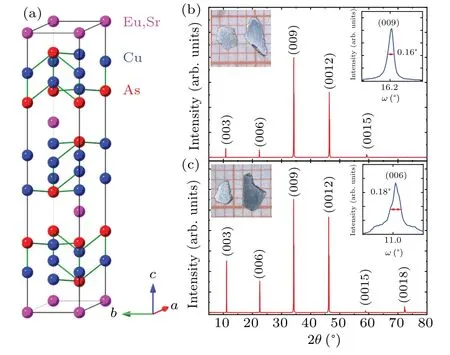
Fig.1.(a) Crystal structural unit cell of ACu4As2 (A=Eu and Sr).XRD patterns of single crystal for(b)EuCu4As2 and(c)SrCu4As2,with the left insets showing optical images of several typical single crystals,and the right insets referring to the rocking curve at (009) peak of EuCu4As2 and (006)peak of SrCu4As2,respectively.
The compositions and stoichiometry of crystals were determined by energy dispersive spectrometer (EDS) equipped on SEM/FIB dual beam system (Helios nanolab600i, FEI Inc.).The x-ray diffraction (XRD) patterns were measured by Rigaku-TTR3 x-ray diffractometer using Cu-Kαradiation.The magnetization was measured with a magnetic property measurement system(MPMS,QD Inc.).Resistivity and specific heat capacity measurements were performed on physical properties measurement system (PPMS-14T, QD Inc.).Selected area electron diffraction patterns were obtained by Talos F200X equipped with a liquid-nitrogen-cooled holder.Thermal expansion measurements inabplane and alongcaxis were done by using home-made strain gauge[15]and capacitance dilatometer,[16]respectively.
3.Results and discussion
The layered compoundACu4As2is iso-structural to EuAg4As2and SrAg4As2with the space group ofR3min rhombohedral CaCu4P2structure[17]as illustrated in Fig.1(a).Eu ions(Sr ions)are located between Cu2As layers.The XRD patterns with crystalline indices(00l)are shown in Figs.1(b)and 1(c)for EuCu4As2and SrCu4As2,respectively.As shown in the inset of Figs.1(b) and 1(c), the values of full width at half maximum(FWHM)of rocking curves are as low as 0.16°and 0.18°at the peak of(009)and(006),respectively,implying that these as-grown single crystals are of high quality.

Fig.2.Curves of temperature-dependent in-plane resistivity of(a)EuCu4As2 and(b)SrCu4As2 under heating(red line)and cooling(blue line)cycling at zero magnetic field,respectively.(c)Temperature-dependent reciprocal of susceptibility(1/χ-T)measurement for H‖c and H‖ab;difference in reciprocal of susceptibility between H‖c and H‖ab(Δ1/χ)(olive line)for EuCu4As2 at H=100 Oe(1 Oe=79.5775 A·m-1).(d)Temperature-dependent susceptibility for H‖c and H‖ab for SrCu4As2 at H=2 T,with inset showing magnified part of H‖c curve.
Figure 2(a) shows temperature-dependent resistivity of EuCu4As2.It suggests a metallic behavior in both heating cycle and cooling cycle.An hump atTP~70 K with no hysteresis and a peak atTN~35 K can be observed.The peak atTNoriginates from ferromagnetic transition[14]and the hump atTPis consistent with the bifurcation point of the 1/χ-Tcurves forH ‖abandH ‖cas shown in Fig.2(c).The Δ1/χ(Δ1/χ=1/χab-1/χc)curve(olive line)is plotted to observe the difference of reciprocal of susceptibility betweenH ‖ candH ‖abclearly.The anisotropic effective susceptibilities for EuCu4As2atTPare also observed in other systems,which is considered to stem from the crystal fields change.[18,19]Figure 2(b)displays the curves of temperature-dependent resistivity measured in both cooling and heating cycles for SrCu4As2,where a typical metallic behavior with a hump atTP~145 K but no hysteresis can be observed in theρxx-Tcurves.Figure 2(d) exhibits the temperature-dependence of susceptibilities(χ-T)forH ‖abandH ‖catH=2 T.A clear kink superimposed on the paramagnetic background is observed nearTPin the direction ofH‖c.The inset shows part of ofχ-TforH ‖c.It is clear that the hump atTPis unrelated to the magnetic moment of Eu ions as seen by comparing the results of electric transport and magnetization between EuCu4As2and SrCu4As2.
In order to figure out the origin of the anomalous hump inρxx-Tcurve atTP~70 K in EuCu4As2and 145 K in SrCu4As2, temperature-dependent heat capacity (CP) measurements at different magnetic fields in a temperature range from 2 K to 200 K are carried out as shown in Figs.3(a)and 3(b).A peak atTNand a hump atTPcan be identified from zero field heat capacity (green) for EuCu4As2.The hump atTPremains unchanged under different magnetic fields while the peak atTNgradually moves to higher temperature with the increase of magnetic field,indicating the underlying ferromagnetic transition as shown in the inset with a zoom-in nearTN.Like the scenario in EuCu4As2, a magnetic field independent hump can be observed in SrCu4As2.These results clearly reveal that the hump atTPoriginates from a thermodynamic second order phase transition with a non-magnetic nature.

Fig.3.(a)Heat capacity measurements of EuCu4As2 from 2 K to 200 K at H =0 T,2 kOe, and 5 kOe, with inset showing zoom-in around 35 K.(b)Heat capacity measurements of SrCu4As2 from 2 K to 200 K at H =0 T and 3 T,with black linereferring to fitting line.(c)Fitting zero magnetic field heat capacity data(red solid line)from 70 K to 200 K after translating and magnifying part below 75 K and the magnetic contribution to the entropy (olive solid line) for EuCu4As2, with dashed line representing a reference guide line.Heat capacity in transition region corrected for the fitted background together with an estimate of the transition entropy obtained by integrating (Cp-Cfit)/T for (d)EuCu4As2 and(e)SrCu4As2,respectively.
The heat capacity data can be fitted by the expressionC=γT+CE+CD, where the first termγTon the right-hand side is the electron contribution,withγbeing the Sommerfeld coefficient.CEandCDare the heat capacity furnished by the Einstein formula and Debye formula,respectively,specifically given by the following expressions:
Herex=θD/T,y=θE/T,θDandθEare the Debye temperature and the Einstein temperature, respectively.The data ranging from 70 K to 200 K are translated up appropriately to eliminate the influence of the kink in EuCu4As2as shown in Fig.3(c).For EuCu4As2,CEis not taken into account.The parametersγ=105.8 mJ·mol-1·K-1andθD=209.24 K are obtained.The magnetic contributionCmagin EuCu4As2can be estimated by subtracting the electron and phonon contribution from the fitting result, and magnetic entropy from the magnetic ordering reaches a limiting value of 16.5 J·mol-1·K-1at 50 K, closing to the theoretical value ofRln8(R=8.31 J·mol-1·K-1).Transition entropy ΔSatTPis estimated at 1.24 J·mol-1·K-1.For SrCu4As2,the data are fitted from 2 K to 115 K,as shown by the black line in Fig.3(b).The parametersγ=242.2 mJ·mol-1·K-1,θD=152 K, andθE=258.5 K are obtained.Transition entropy ΔSatTPis estimated at 0.64 J·mol-1·K-1.
To figure out the origin of the phase transition nearTP,the structural characterization from the SAED studies by using TEM technique is performed.Figures 4(a) and 4(c), and figures 4(b) and 4(d) show the SAED patterns with the electron incidence parallel to the [0001] and [1010] directions at 300 K and 100 K for SrCu4As2,respectively.The diffraction pattern belowTPis identical to that aboveTP.No noticeable change of crystal structures in space group occurs, indicating that the transition nearTPis irrelevant to structural phase transition or CDW transition.The SAED pattern of EuCu4As2is absent,because theTPbelow liquid nitrogen temperature is beyond the equipment limit.The experimental results of electric transport,magnetism,heat capacity,and SAED mentioned above demonstrate that the transition atTPin ourACu4As2does not trigger off any type of magnetic or structural transition nor space group changes.

Fig.4.SAED patterns of SrCu4As2 taken along zone axis [0001] at (a)300 K and(b)100 K,respectively.SAED patterns of SrCu4As2 taken along zone axis[1010]at(c)300 K and(d)100 K.
Figures 5(a) and 5(b) show the temperature-dependent thermal expansion (ΔL/L) both in theab-plane and alongcaxis for EuCu4As2and SrCu4As2,respectively.A continuous drop ofcaxis about ΔLc/Lc~0.8‰ and a continuous slight increase ofab-plane about ΔLab/Lab~0.196‰occur as temperature decreases from 74 K to 61 K in EuCu4As2.Similarly,a slight drop ofcaxis about ΔLc/Lc~1‰and a subtle increase ofab-plane about ΔLab/Lab~0.007‰are observed in SrCu4As2when the temperature decreases from 160 K to 145 K.These subtle lattice parameter changes correspond to theTPtransition at 70 K in EuCu4As2and 145 K in SrCu4As2determined from the temperature-dependent resistivity and the susceptibility curves.

Fig.5.Thermal expansion of lattice parameters in ab plane and along c axis in(a)EuCu4As2 and(b)SrCu4As2,respectively.
The transition of temperature-dependent resistivity has also been observed in several analogous compounds.[13,20,21]However, first-order specific heat peak and the emergence of superlattice peaks and hysteresis onρxx-Tcurves are observed in EuAg4As2.While in EuCu4As2,[14]no hump on heat capacity and a small hysteresis onρxx-TatTPare observed.In both EuAg4As2and EuCu4As2, this transition is attributed to the structural distortion.Furthermore,for CaCu4As2,[22]a kink at~50 K with a hysteresis onρxx-Tis identified as a result of CDW transition.In our samples,theλ-type anomalous hump of heat capacity nearTPindicates that theTP-transition belongs to the second order-like thermodynamic phase transition.The conclusion of the second order transition can also be inferred from the result of subtle change of lattice parameters.This subtle lattice distortion is much smaller than a typical crystal structural transition with a lattice change on the order of~0.5%-1%.[23,24]
Additionally, similar phenomena have been observed in Cd2Re2O7[25-27]and LiOsO3,[28]including the anomalous kink in resistivity,λ-shaped anomalousness of heat capacity, and a kink in magnetization.This transition can be attributed to destruction of mirror symmetry caused by the average position displacement of Li ions in LiOsO3and Cd ions in Cd2Re2O7measured by convergent beam electron diffraction(CBED).Therefore,the transition may originate from the displacement of Cu ions in EuCu4As2and SrCu4As2.To further reveal the physical origin of the uniqueTPtransition, angleresolved photoemission spectroscopy(ARPES),CBED,resonance inelastic x-ray scattering(RIXS)or scanning tunneling spectrum(STS)measurements are helpful in ascertaining the underlying physical origin of this intriguing transition.
4.Conclusions
In summary,EuCu4As2and SrCu4As2feature a transition atTP~70 K and 145 K,respectively.The origin of structural phase transition and CDW for this transition can be ruled out from the characterization of the SAED pattern under different temperatures.The thermal expansion measurements show that subtle lattice parameters change nearTPfor both EuCu4As2and SrCu4As2.The experimental observations suggest that the nonmagnetic transition atTPshould be related to lattice distortion and may originate from the displacement of Cu ions.Our results provide a platform for exploring the anomalous transitions.
Acknowledgements
Project supported by the National Key Research and Development Program of China(Grant No.2021YFA1600201),the National Natural Science Foundation of China (Grant Nos.U19A2093, U2032214, U2032163, U1732274,11904002, and 11874359), the Collaborative Innovation Program of Hefei Science Center, Chinese Academy of Sciences (CAS) (Grant No.2019HSC-CIP 001), the Youth Innovation Promotion Association of CAS (Grant No.2021117), the Natural Science Foundation of Anhui Province,China(Grant No.1908085QA15),the Director Fund from the Hefei Institutes of Physical Science(HFIPS)(Grant No.YZJJQY202304),the Director Fund from the the Chinese Academy of Sciences and Hefei Institutes of Physical Science(CASHIPS),China(Grant No.E26MMG71131),and the High Magnetic Field Laboratory of Anhui Province,China.
杂志排行

Chinese Physics B的其它文章
- Single-qubit quantum classifier based on gradient-free optimization algorithm
- Mode dynamics of Bose-Einstein condensates in a single-well potential
- A quantum algorithm for Toeplitz matrix-vector multiplication
- Non-Gaussian approach: Withstanding loss and noise of multi-scattering underwater channel for continuous-variable quantum teleportation
- Trajectory equation of a lump before and after collision with other waves for generalized Hirota-Satsuma-Ito equation
- Detection of healthy and pathological heartbeat dynamics in ECG signals using multivariate recurrence networks with multiple scale factors