Percolation transitions in edge-coupled interdependent networks with directed dependency links
2023-10-11YanLiGao高彦丽HaiBoYu于海波JieZhou周杰YinZuoZhou周银座andShiMingChen陈世明
Yan-Li Gao(高彦丽), Hai-Bo Yu(于海波), Jie Zhou(周杰), Yin-Zuo Zhou(周银座), and Shi-Ming Chen(陈世明),†
1School of Electrical and Automation Engineering,East China JiaoTong University,Nanchang 330013,China
2School of Physics and Electronic Science,East China Normal University,Shanghai 200241,China
3Alibaba Research Center for Complexity Sciences,Hangzhou Normal University,Hangzhou 311121,China
Keywords: edge-coupled interdependent networks with directed dependency links, percolation transitions,cascading failures,robustness analysis
1.Introduction
Many facilities and systems in real life can be abstracted into networks, such as transportation networks, biological networks, financial networks, electric networks, and social networks.[1–9]These networks have brought convenience to human production and life,while the propagation phenomena occurring on the networks have also brought negative effects,and complex networks science provides theories and analytical methods for studying complex systems in the real world.
Early research on complex networks was limited to the topological properties of the single-layer network,[10–13]until it was discovered that the interdependence within networks in the real world posed extremely serious systemic risks,such as large-scale power outages and traffic congestion.[14,15]This is due to the fact that the failures in a single-layer network could spread not only in itself but also in the other networks.Therefore,the study of interdependent networks has attracted much attention of many scholars.
Buldyrevet al.[16]first developed the analytical framework of interdependent networks,where there are one-to-one dependent nodes between two networks, and found that interdependence greatly reduces the robustness of the network.Following this research, many results have emerged for the study of interdependent networks.According to the difference of interdependent patterns, Parshaniet al.[17]analyzed the node-coupled interdependent networks in which a fraction of the nodes are interdependent in both networks, and found that reducing the coupling between the networks leads to a change from a first-order percolation phase transition to a second-order percolation transition at a critical point, i.e., its robustness is better than the fully node-coupled interdependent networks.[16]Shaoet al.[18]proposed the coupled network systems with multiple support-dependence relations and investigated them analytically and numerically.Buldyrevet al.[19]and Parshaniet al.[20]studied the coupled networks with positively correlated degrees of mutually dependent nodes and found that as the networks become more inter-similar the system would become significantly more robust to random failure.Huet al.[21]found that the phase transition includes the hybrid transition of mixed first and second orders in study of a coupled networks system where both interdependent and interconnected links exist.This hybrid transition phenomenon was also found in the studies of Zhouet al.[22]and Zhanget al.[23]afterward.Donget al.[24]developed a interacting networks model with feedback-dependency links and found that the feedback-dependency links have no effect on robustness of the system for a weak coupling strength corresponding to the second-order transitions, whereas the system is more vulnerable for strong coupling strength corresponding to first-order or hybrid phase transition.Liuet al.[25]found that reducing the coupling strength between interdependent nodes can improve the system’s robustness by studying the interdependent networks with weak node-coupling strength.
In addition to studying interdependent patterns, scholars have proposed numerous network models.Gaoet al.[26–28]extended interdependent networks to systems with more than two independent networks and analyzed the effect of topology and the number of networks on network robustness.Cellaiet al.[29]showed that the overlap among layers can improve the robustness of interdependent multiplex systems and change the critical behavior of the percolation phase transition in a complex way.Huanget al.[30]studied the effect of clustering on the system robustness of interdependent networks and found that clustering makes the system more vulnerable.Valdet al.[31]set the nodes with high degrees as autonomous nodes and found them to be effective in improving the robustness of the network.Liuet al.[32]developed a theoretical framework of interdependent directed networks and found that the directionality within the network increases its vulnerability and exhibits hybrid phase transitions.
The above works address the case of node-coupled interdependent networks (NINs), i.e., the failures of nodes in one network lead to the failures of nodes in the other network.Considering that there are also many cases of edge-coupled interdependent networks in the real world, Gaoet al.[33]developed a new model of edge-coupled interdependent networks(EINs) and analyzed it using the self-consistent probabilities method[34]and found that it is stronger than the NIN.
The existing studies of EINs have only considered the case where both connectivity links and dependency links are undirected.However, there are also some EINs in which the dependency links are directed in the real world.One example is power-transportation interdependent networks.Generally speaking, power system and rail transportation system interdepend on each other.However,by analyzing the interactions between these two networks we found that there are one-way dependencies instead of mutual dependencies for the specific lines.For example,the failures of part power lines can directly affect the functions of some part of rail transportation lines,whereas these transportation lines may not just right affect these power lines.In other words, there are directed dependency relations between transportation lines and power lines.
Therefore, a model of edge-coupled interdependent networks with directed dependency links (EINDDLs) is proposed,and the theoretical framework for the analysis of EINDDLs under random attacks is developed by settingβto change the dependence relationship between two networks based on the self-consistent probabilities method.Both theoretical analysis and computer simulations are conducted on RR-RR and ER-ER EINDDLs(RR:random regular,ER:Erd¨os–Rényi)to explore the relationship betweenβand the phase transition behaviors of networks A and B under random attacks.Some characteristics in the phase transition behaviors of networks A and B are found and the corresponding prevention strategy is proposed.
2.Model description
The model of edge-coupled interdependent networks with directed dependency links (EINDDLs) in this paper refers to two-layer edge-coupled interdependent networks(EINs)consisting of networks A and B,where the dependency links are one direction instead of mutual direction.We assume that the number of nodes and the average degree of both networks are the same, so the total numbers of edges in both networks are equal.A connectivity link in network A is randomly selected to establish a directed dependency link with a connectivity link in network B, as shown by the red and blue dashed lines in Fig.1(a).Figure 1 gives the process of cascading failures for the EINDDL.Dependency links make the system follow such cascading rules,e.g.,failure ofa1↔a8causes failure ofb2↔b3while the failure ofb2↔b3cannot lead to failure ofa1↔a8.Here,βis defined to control the ratio of two directed types of dependency links, i.e., network A has a 1-βratio of connectivity links depending on network B,and network B has aβratio of connectivity links depending on network A.The dependencies of the two networks will also be changed by changing the value ofβ.

Fig.1.Cascading failures of the EINDDL.
According to the bond percolation theory, when a network is under attacks, it may be broken into many connected clusters.The biggest one referred as giant component(GC)is usually considered as functional part of a network.We randomly remove the 1-pfraction of connectivity links in network A in the initial state,this will result in a portion of nodes failing due to being out of GC, while the edges connected to these failed nodes will also fail.Since there are connectivity links in network B that depends on network A,it causes a part of the connectivity links in network B to fail and makes a part of the nodes fail by leaving the GC,which subsequently leads to the failure of connectivity links in network A that depends on network B and causes further damage to network A.Cascading failures repeatedly propagate between two networks as the above process until no more new connectivity links or nodes fail in both networks,which is the steady state.In terms of interdependent networks,the remainder of the network after the cascading failure composes an extensive component, referred as mutually connected giant component(MCGC).The size of the MCGC at a steady state reflects the robustness of the network.
The solid black lines in Fig.1 represent the connectivity links within the network,the dashed black lines represent the failed connectivity links,and the dashed red and blue lines are the dependency links between two networks, whereβis 0.6.Due to the initial statea3↔a4anda4↔a5in network A failed,as shown in Fig.1(a).According to the cascading failure rules,b5↔b6in network B will not fail andb6↔b7will fail.Finally,a steady state is reached,as shown in Fig.1(b).
3.Theoretical analysis framework
3.1.Single-layer network
The degree distributionp(k)is defined as the probability that a node of degreekis randomly selected in the network.The condition that a node of degreekdoes not belong to the GC is that allkconnectivity links of the node do not lead to the GC.We introduce an auxiliary parameterR,defined as the probability that a randomly selected link leads to the GC along one direction, then the probability that the node does not belong to the GC can be expressed as(1-R)k.For any node with degreeksatisfying the degree distributionp(k),the probability that a node does not belong to the GC is obtained by multiplying the probability (1-R)kwith the degree distributionp(k)and summing up,[34–38]whereSdenotes the probability that a randomly selected node in the network belongs to the GC,
From the generating function theory,[36,37]it is known that the network degree distribution generating function isΦ0(x) = ∑k p(k)xkand the excess-degree distribution generating function isΦ1(x) = ∑k q(k)xk-1, whereq(k) denotes the excess-degree distribution of the nodes, i.e.,q(k)=p(k)·k/〈k〉,and〈k〉is the average degree of the network,thus Eq.(1)can be rewritten as
Apart from Eq.(2),in order to solveSorR,it is also necessary to build a consistent equation of the probabilityRthat a connectivity link leads to the GC,i.e.,at least one of the remaining links of the node reached by this link leads to the GC,i.e.,
Thus Eq.(3)can reduce to
Using the generating functionΦ1(x), Eq.(4) can be rewritten as
If a fraction 1-pof connectivity links is randomly removed from the network (bond-percolation), the probability of randomly selecting a node in the network that belongs to the GC remains unchanged since no node is removed from the network,and the expression of the order parameterSremains as Eq.(2).Since only a fractionpof connectivity links remains in the network,the probability of randomly selecting a link to reach a node with degreekbecomesptimes the original one, i.e.,p·q(k).Thus, the consistent equation for the auxiliary parameterRis
The order parameterSand the auxiliary parameterRcan be solved by combining Eqs.(2)and(6).
3.2.Edge-coupled interdependent networks with directed dependency links
Following the single-layer network method,the EINDDL is a two-layer interdependent networks, where we introduce two auxiliary parametersRAandRB,which denote the probabilities that randomly selected link in network A and network B leads to the MCGC along one direction, respectively.Network A has 1-βfraction of connectivity links depending on network B,and network B hasβfraction of connectivity links depending on network A.For simplicity, assuming that both networks have the same degree distribution and the same number of nodes,their generating function expressions are also the same.In this case, when a connectivity link is randomly selected in network A, whether the node reached by this link belongs to MCGC depends on the following two factors.
(i) If a randomly selected connectivity link does not depend on network B,i.e., the corresponding link in network B will not cause this link to fail.The fraction of this part of connectivity links isβ.It is only necessary to consider whether the end nodes of these links in network A belong to the GC.
(ii) If a randomly selected connectivity link depends on network B, i.e., the failure of the corresponding connectivity link in network B will cause this link to fail.The ratio of this part of connectivity links is 1-β.It is necessary to consider the probability that the end nodes of this part of links in network A belong to GC, but also the probability that the end nodes of the corresponding links in network B belong to GC.
Therefore, based on Eq.(5), the probabilityRAAthat a fraction ofβconnectivity links leads to the GC is
Since a 1-βfraction of connectivity links depends on network B,at least one of the nodes to which the corresponding connectivity links the network B lead must be in the GC,as shown in Fig.2.
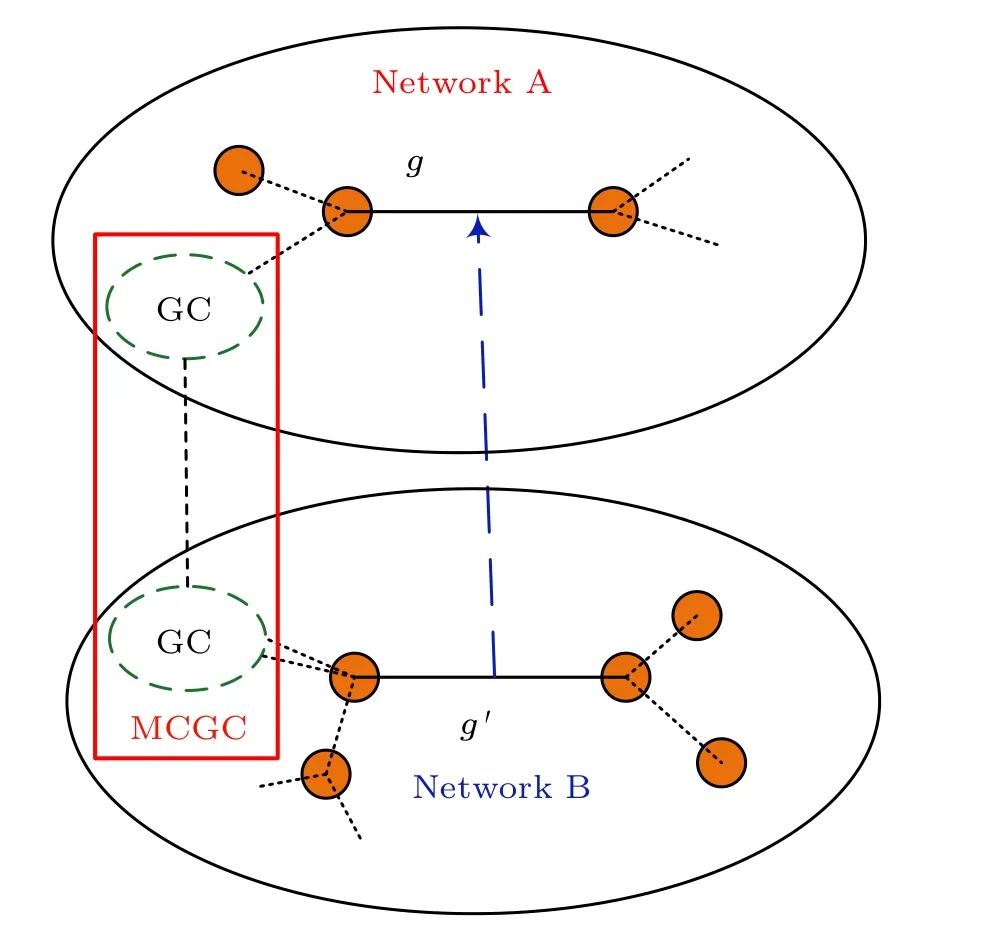
Fig.2.The survival of connectivity link dependent on network B.
The probability that one end ofg′not in the GC isΦ1(1-RB) and the probability that both ends are not in the GC is [Φ1(1-RB)]2.Thus the probabilityRLBthat at least one end of the connectivity linkg′in the GC is
Similarly, the node to which the 1-βratio of connectivity links leads has to be in the GC of network A, and its probabilityRABis known according to Eq.(5),
Accordingly, the probability that the nodes to which the connectivity links of the 1-βfraction lead are in the MCGC has to satisfy the conditions in both networks A and B, i.e.,RAB·RLB.
Combining the two aspects considered above, the auxiliary parameterRAcan be expressed as
Similarly, whether the nodes reached by a randomly selected connectivity link in network B belong to the MCGC requires consideration of the above two aspects.Using the same analysis,we can obtain that theβfraction of connectivity links in network B leading to the GC needs to satisfy both constraints in networks A and B,and the probability is
The 1-βratio of connectivity links in network B leading to the GC only needs to meet the constraint in network B leading to the GC,and the probability is
Thus, the expression for the auxiliary parameterRBcan be expressed as
Following the above formulas,if the 1-pfraction of the connectivity links in network A are randomly removed in the initial state,the fraction of remaining connectivity links in network A isp,and the connectivity links ofβand 1-βfractions becomep·βandp·(1-β),respectively.From Eq.(10),the expression of the auxiliary parameterRAat this time is
Since there are no attacks in network B,what affects network B is the failed links in theβscaled connectivity links.Therefore, the surviving connectivity links in network B are only related to the connectivity links of the 1-βscale and the connectivity links of thep·βscale.From Eq.(13), the expression of the auxiliary parameterRBis
In addition,after randomly removing the 1-pfraction of connectivity links in network A,the order parameterSwill not be affected by the deletion of connectivity links because the nodes between the two layers are not directly related.From Eq.(2),the expressions for the order parametersSAandSBof networks A and B are,respectively,
Given the values ofβandp,combing Eqs.(14)–(17),we can solve the values of the auxiliary parametersRA,RBand the order parametersSAandSB.
In the percolation theory,[16,35]a fraction 1-pof nodes or links are randomly removed which may trigger cascading failures due to the dependency between networks.An abrupt collapse may occur where the size of GC changes to zero discontinuously upon a removal of a critical fraction 1-pcof nodes/links.This discontinuous percolation transition is named as the fist-order phase transition andpcis known as the percolation threshold.If the size of GC changes to zero continuously that is typical on single-layer networks, we call it the second-order phase transition.
The type of phase transition and the phase transition thresholdpcof the EINDDL can be investigated by comparingSandp.The percolation behaviors of the networks vary with different values of the parameterβ.If the network undergoes a first-order phase transition,the curve of Eq.(14)tangentially will meet the curve represented by Eq.(15).If the network undergoes a second-order phase transition,the value of the auxiliary parameterRAorRBwill be 0,and the second-order phase transition threshold can be found by the above equations.
3.3.Theoretical framework verification
Figure 3 gives the plots ofSAandSBversuspfor the RRRR EINDDL and the ER-ER EINDDL with differentβfor the number of nodesNA=NB=100000 and the average degree〈kA〉=〈kB〉=4,where the solid lines are the theoretical results and the dots are the simulated values.
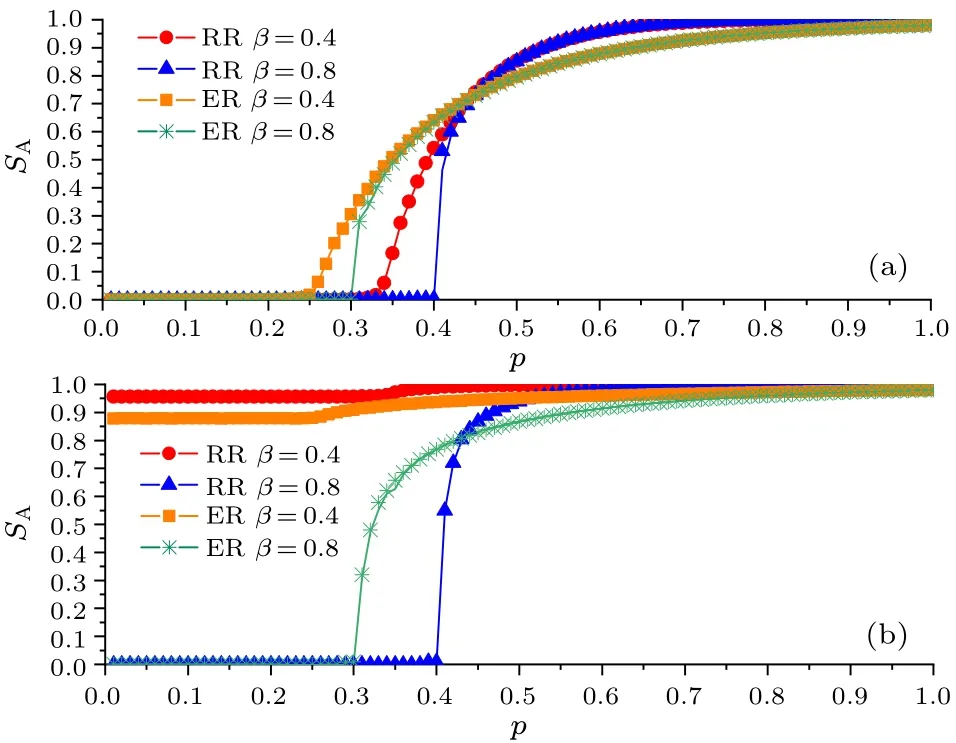
Fig.3.Plots of SA and SB versus p with different β.
It can be seen from Fig.3 that the theoretical values can match well with the computer simulation values.The theoretical framework can be verified.We apply this framework on the RR and ER networks to analyze their phase transition behaviors.
4.Robustness analysis of the EINDDL
4.1.The RR-RR EINDDL
In the RR network, all node degrees are〈k〉.Therefore,the degree distribution is
Assuming that the numbers of nodes of networks A and B are the same and the average degree is〈k〉, the generating function of the degree distribution of the RR network isΦ0(x)=x〈k〉and the generating function of the excess degree distribution isΦ1(x)=x〈k〉-1from the theory of generating functions.According to Eqs.(14)and(15),the expressions for the auxiliary parametersRAandRBof the RR-RR EINDDL are
From Eqs.(16)and(17),the expressions of the order parametersSAandSBare
From Eqs.(19)–(22), the values of the order parametersSAandSBare determined by the auxiliary parametersRAandRB, and only non-zero values ofRAandRBcan be obtained for non-zero values ofSAandSB.Obviously, Eqs.(19) and(20)possess a trivial solutionRA=RB=0,corresponding to the case in which the GC is 0 in the network.
The first-order phase transition thresholdof the system can be obtained when the curves represented by Eqs.(19)and(20)are tangent.The GC of network A in the critical case will be 0 if the system undergoes a second-order phase transition.At this time, the auxiliary parameterRA→0.The nontrivial solutionRB0of the auxiliary parameterRBcan be found by substituting it into Eq.(20), and then the second-order phase transition thresholdpIIcis obtained as follows:
Assuming that the number of nodes in both network A and network B in the RR-RR EINDDL isN=100000 and the average degree is the same,Fig.4 gives a plot of the order parametersSAandSBversuspat differentβfor〈k〉=3,4,and 5.
4.2.The ER-ER EINDDL
The degree distribution of a Erd¨os–Rényi (ER) network is Poisson distribution, i.e.,Similarly, assuming that the number of nodes of networks A and B are the same and the average degree is〈k〉,the generation function of the degree distribution of the ER network and the generation function of the excess degree distribution are the same from the theory of generating functions, that is,Φ0(x)=Φ1(x)=e〈k〉(x-1).According to Eqs.(14)and(15),the expressions for the auxiliary parametersRAandRBare,respectively,
From Eqs.(16)and(17),the expressions of the order parametersSAandSBare
Given the values ofβand the average degree〈k〉,Eqs.(24)and(25)can be rewritten as
Eliminating the auxiliary parameterRBfrom the system of Eq.(28),we obtain
When Eq.(29)satisfies the following conditions
Equations (24) and (25) appear as a nontrivial solution,corresponding to the critical case when the system undergoes a first-order phase transition, wherepis the first-order phase transition threshold.
If the system undergoes a second-order phase transition, the same analytical method of substitutingRA→0 into Eq.(25) can give the solutionRB0of the auxiliary parameterRB,which leads to the second-order phase transition threshold,
Figure 5 gives a plot of the order parametersSAandSBversuspat differentβfor〈k〉=3,4 and 5.

Fig.4.Plots of SA and SB versus p for the RR-RR EINDDL at different β and〈k〉.
4.3.Robustness analysis
4.3.1.Robustness analysis of network A
It can be seen that, no matter whether it is the RR-RR EINDDL or the ER-ER EINDDL, network A gradually converges to the first-order phase transition from the second-order phase transition asβincreases,as seen in Figs.4 and 5.Network A will change from the first-order to the hybrid phase transition and then from the hybrid to the second-order phase transition whenβkeeps increasing,as shown in Fig.6.
This process can be explained by the graphical method.SAis a monotonically increasing function aboutRAwhenkandβare inevitable, so the value ofRAcan directly reflect the phase transition.Taking the RR-RR EINDDLk=4 as an example, make the plot of the curve represented by Eqs.(19)and (20) and label the solution of Eq.(19) (i.e., the value ofRA),as shown in Fig.7.It can be seen thatRAchanges from zero to non-zero value continuously aspincreases in Fig.7(a).Therefore,the second-order phase transition occurs in network A.RAjumps from zero to a non-zero value aspincreases in Fig.7(b), and the first-order phase transition occurs in network A.In Fig.7(c),RAchanges continuously from zero to non-zero values and jumps when the two curves are tangent so that network A undergoes the hybrid phase transition.In Fig.7(d),RAstill changes from zero to non-zero continuously aspincreases,andRAdoes not jump because the tangent(intersection)point of the two curves is precisely on theRAaxis.Thus,network A undergoes the second-order phase transition.

Fig.5.Plots of SA and SB versus p for the ER-ER EINDDL at different β and〈k〉.
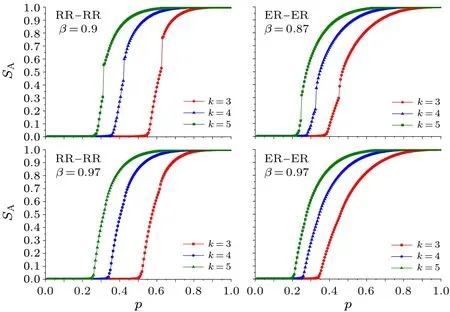
Fig.6.Plots of SA versus p for the EINDDL when β >0.8.
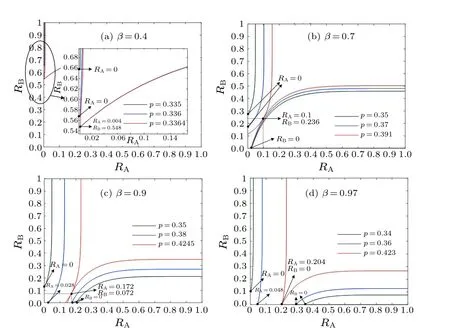
Fig.7.Plots of curves represented by Eqs.(19)and(20).
4.3.2.Robustness analysis of network B
From Figs.4 and 5, it can be found thatSBin network B gradually changes from a more significant non-zero value to zero whenp <asβincreases,because network A fails completely whenp <and network B is equivalent to the failure of a single network with the initial removalβfraction of connectivity links.
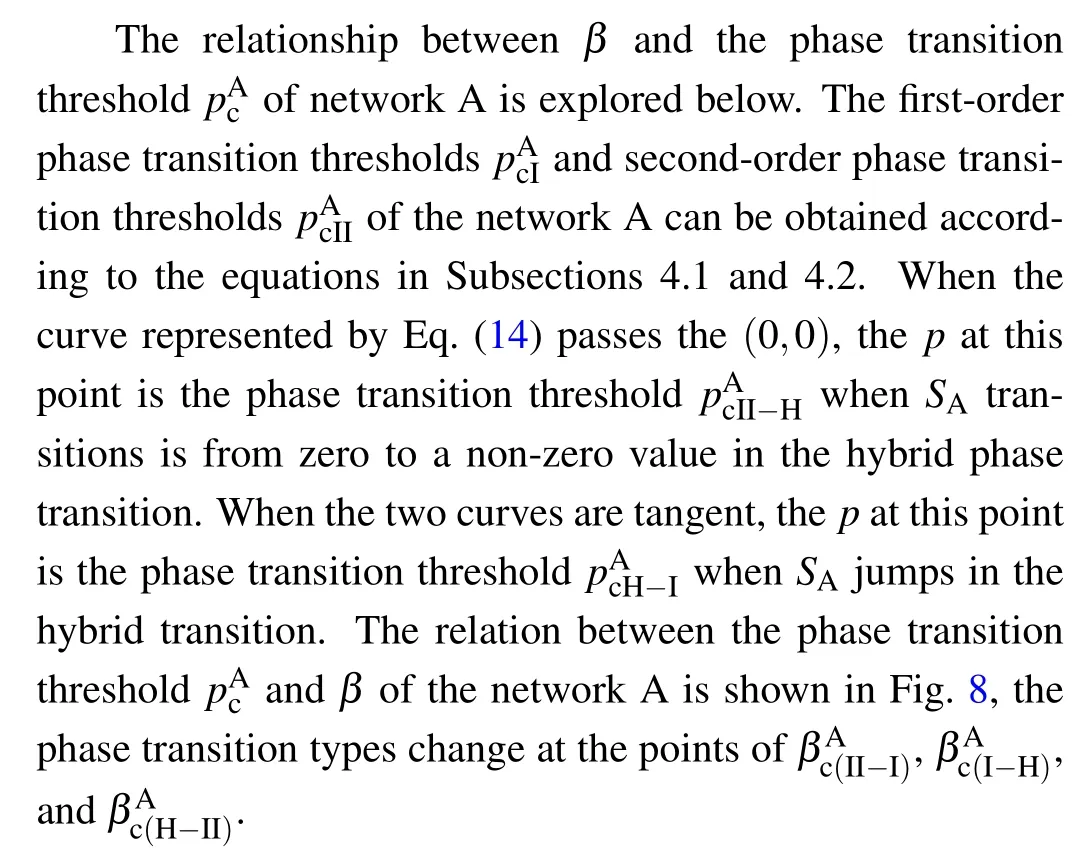
Next,we investigate the conditions,on which network B completely collapses.WhenSBis non-zero, Eq.(20) intersects theRBaxis in the plane (RA,RB) as shown in Fig.9(a),where the red line indicates Eq.(19) and the blue line indicates Eq.(20).Asβgradually increases to a certain value,Eq.(20)gradually goes from intersecting theRBaxis to passing the(0,0)point, when the order parameterSBis exactly 0 at a certainp, as shown in Fig.9(b), we define theβandpat this case as the critical valuesandwhen network B collapses completely.Subsequently, atβ ≥andp ≤,the value of the order parameterSBis always 0.Equation(20)no longer intersects with theRBaxis,as shown in Fig.9(c).
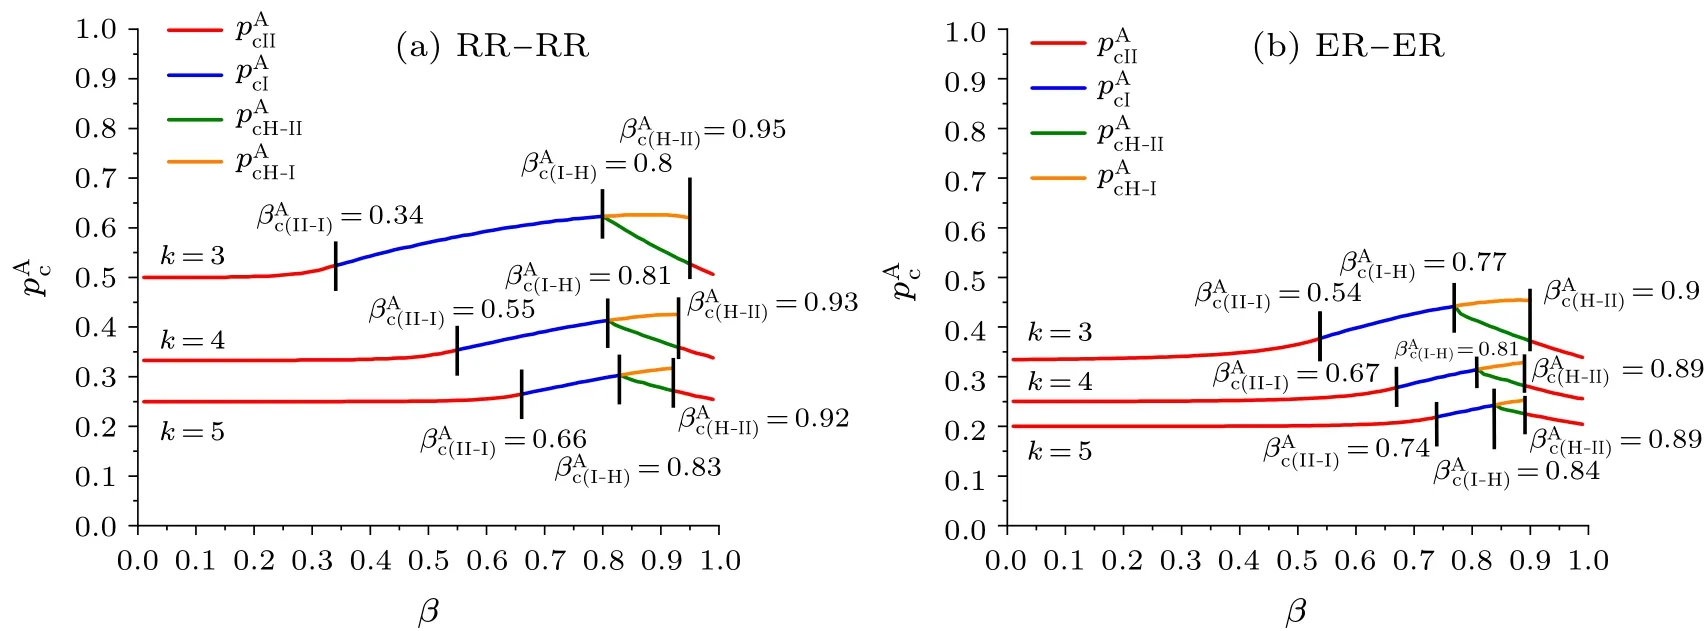
Fig.8.Plots of phase transition threshold pAc versus β for network A.

Fig.9.Plots of Eqs.(19)and(20)with identical p and different β.
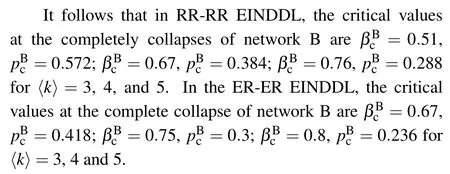
Fig.10.Plots of SB as a function of p-pc for the EINDDL when β >0.8.
Then we study what type of phase transition occurs when network B is able to completely collapses.The plots ofSBas a function ofp-pcare made whenβ ≥, as shown in Fig.10.It can be seen thatSBturns from discontinuous to continuous with the increase ofβfrom Fig.10.Hence, asβincreases,network B turns from the first-order to second-order phase transition whenβ ≥.
The process is similarly explained graphically by labeling the solution of Eq.(20) (i.e., the value ofRB) in Figs.7(b)–7(d).Asβincreases,the value ofRBchanges from discontinuously to a non-zero value to continuously to a non-zero value.Hence,network B changes from the first-order to the secondorder phase transition.Also,from Fig.7(d),it can be seen that when the tangent(intersection)point of the two curves is exactly on theRAaxis,the values ofRAandRBno longer jump,and the second-order phase transition occurs in both network A and network B at this time.
It is clear that the first-order phase transition occurs in network B whenand the second-order phase transition occurs in network B whenfrom the above study.
4.3.3.The prevention strategy
From Subsections 4.3.1 and 4.3.2, it is clear that the robustness of both network A and network B become weaker and then stronger asβincreases from 0 to 1 with the phase transition point of view.The mechanism of this phenomenon is the way of spreading the damages influenced byβ.To illustrate this,we defineFas the ratio of failed links of networkA(B) spreading to networkB(A) to the total number of links of cascading failure in the second and third steps,and make a plot ofFversusβfor EINDDLk=4,p=0.3, as shown in Fig.11.
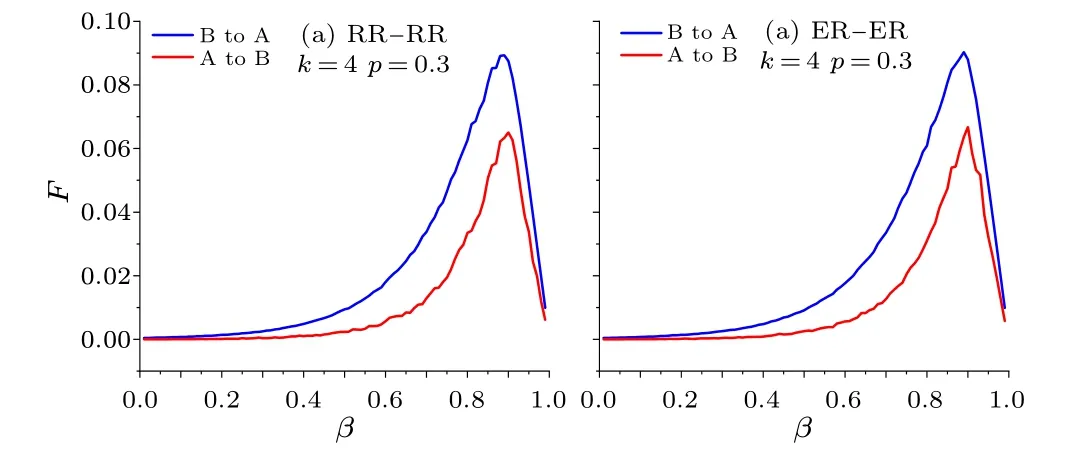
Fig.11.Ratio of failure links of A(B)spreading to B(A)with different β.
The number of failed links of network A (B) cascade to network B(A)increases and decreases asβincreases from 0 to 1.The more failed links there are in each cascading failure step,the more fragile the network is,that is the reason why the robustness of networks A and B decreases and then increases.Therefore,the value ofβcan directly affect the robustness of the EINDDL.Thus the prevention strategy is to find the value ofβwhen the EINDDL is most robust.
We useSABsimilar to the order parameterSto denote the size of MCGC.Figure 12 shows the plots ofSABas a function ofp.The robustness of the EINDDL can be measured by the phase transition thresholdpcand the jump valuePJat the transition threshold.In order to find the prevention methods to optimize the network design,we study the relationship between robustness measured by both phase transition thresholdpcand the jump valuePJandβ.As we know,the smaller thepcandPJare,the more robust the system is.rising-falling-rising trend with the increase ofβ,and there exists peaks which reflect the strongest cases.Therefore,to prevent mass cascading failures,the value ofβshould be chosen around the high peaks and away from the low peak.
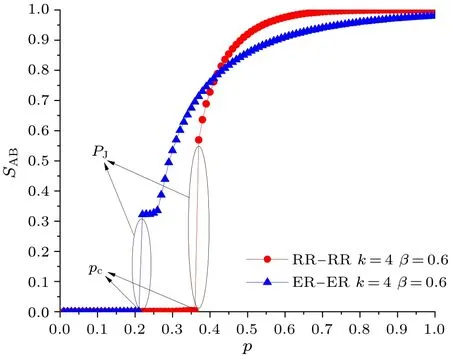
Fig.12.Plots of SAB as a function of p for the EINDDL.
5.Conclusions
In summary, we have established a model for edgecoupled interdependent networks with directed dependency links (EINDDLs), and the directed dependency strength between two networks is determined byβ.The theoretical analysis framework of an EINDDL is developed based on the selfconsistent probability method,and the theoretical analysis and simulation of RR-RR and ER-ER networks are carried out to prove the theoretical analysis.The results show that under random attacks,network A exhibits different types of phase transitions(first-order,second-order and hybrid)with the increase ofβ, and the critical values ofβfor the whole phase transition type change process of network A are obtained.Network B is rarely affected by cascading failure whenβis small,and asβincreases, network B will gradually converge from the first-order to the second-order phase transition.The robustness of both network A and network B becomes weaker and then stronger asβincreases from 0 to 1 with the phase transition point of view.Finally,by measuring the robustness of the EINDDL with the phase transition thresholdpcand the jump valuePJ,we obtain the value ofβwhere the robustness of the EINDDL is best,and propose the prevention strategy.
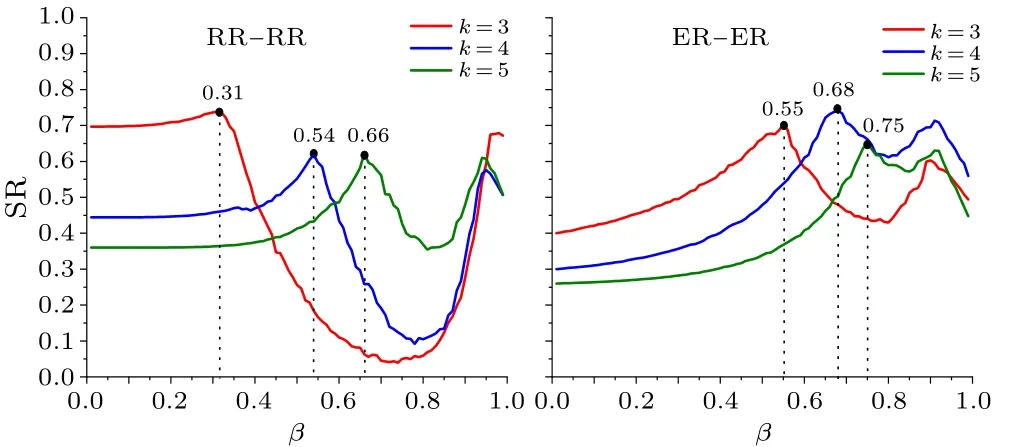
Fig.13.Plots of SR versus β for the EINDDL.
For differentβ,we get two vectorsand.To evaluate the robustness of networks,we forward transit and normalize the vectorsndto getSpcandSPJ,so the comprehensive robustness evaluation metricSRof the EINDDL is expressed in the following,where the weightsωcandωJof the two metrics are received by the entropy method.
Due to the forward transition and normalized vectorsp′candthe larger theSRis, the stronger the networks are.The plots ofSRversusβfor differentkis shown in Fig.13.It can be seen that the robustness of the EINDDL shows an
Acknowledgments
Project supported by the National Natural Science Foundation of China (Grant Nos.61973118, 51741902,11761033, 12075088, and 11835003), Project in JiangXi Province Department of Science and Technology (Grant Nos.20212BBE51010 and 20182BCB22009), and the Natural Science Foundation of Zhejiang Province (Grant No.Y22F035316).
猜你喜欢
杂志排行

Chinese Physics B的其它文章
- Dynamic responses of an energy harvesting system based on piezoelectric and electromagnetic mechanisms under colored noise
- Intervention against information diffusion in static and temporal coupling networks
- Turing pattern selection for a plant–wrack model with cross-diffusion
- Quantum correlation enhanced bound of the information exclusion principle
- Floquet dynamical quantum phase transitions in transverse XY spin chains under periodic kickings
- Generalized uncertainty principle from long-range kernel effects:The case of the Hawking black hole temperature