Flow control performance evaluation of a tri-electrode sliding discharge plasma actuator
2023-10-11BoruiZheng郑博睿YuanpengLiu刘园鹏MinghaoYu喻明浩YuanzhongJin金元中QianZhang张倩andQuanlongChen陈全龙
Borui Zheng(郑博睿), Yuanpeng Liu(刘园鹏), Minghao Yu(喻明浩),†, Yuanzhong Jin(金元中),Qian Zhang(张倩), and Quanlong Chen(陈全龙)
1School of Automation and Information Engineering,Xi’an University of Technology,Xi’an 710048,China
2School of Mechanical and Precision Instrument Engineering,Xi’an University of Technology,Xi’an 710048,China
3The Green Aerotechnics Research Institute of Chongqing Jiaotong University,Chongqing 401120,China
Keywords: plasma flow control, tri-electrode sliding discharge, particle image velocimetry (PIV), performance evaluation
1.Introduction
The dielectric barrier discharge (DBD) plasma actuator,a new type of active flow control device, has received wide international attention because of its simple structure,fast response,light weight and ease of installation on the surface of the controlled object.[1–3]A conventional DBD mainly comprises two metal electrodes and an insulating dielectric layer(see Fig.1(a)),with exposed electrode#1 attached to the upper surface of the dielectric layer and buried electrode#2 covered below the dielectric layer.The exposed and buried electrodes are in an asymmetric geometric configuration.When a highvoltage,high-frequency alternating current(AC)is applied to the DBD electrodes,the surrounding air near the exposed electrodes is rapidly ionized to form a plasma discharge.During the plasma discharge the charged particles are subjected to the electric field generated by the asymmetric electrodes and collide with the neutral particles for momentum transfer,forming a directional jet from the exposed electrode to the buried electrode along the actuator surface.[4]
DBD has many applications in active flow control, mainly lift increase and drag reduction,[5–9]noise reduction,[10,11]lateral force control[12,13]and suppression of flow separation.[14–18]The cited studies have demonstrated the flow control performance of DBD actuators.However,the output momentum generated by a conventional DBD is relatively weak and is challenging to apply to flow control situations where the velocity of the flow field is greater than 30 m·s-1.[19]Currently, academics agree that plasma flow control performance needs to be improved in two aspects.One is to develop a deeper understanding of the physical mechanism of plasma flow control and further enhance the coupling relationship between the plasma actuator and the external flow field.The other is to optimize the performance of the plasma actuator to significantly improve the induced body force(or maximum average induced velocity)of the DBD actuator.[20,21]

Fig.1.The power supply connection for different plasma actuators:(a)DBD plasma actuator and(b)TED plasma actuator.
Regarding DBD optimization research, Corkeet al.[22]systematically summarized the progress in plasma actuator optimization.They concluded that the induced body force improves the flow control effect.Furthermore, the magnitude of the induced body force is closely related to several actuator parameters, including the actuation electrical parameters(peak-to-peak voltage and actuation frequency),the thickness and dielectric constant of the dielectric material and the electrode configuration.Tri-electrode plasma actuators(TEDs)are one of the many optimized solutions(see Fig.1(b));these add a DC electrode#3 parallel to the AC electrode on the surface of a conventional DBD actuator to increase the extent of the plasma where the momentum exchange occurs on the surface of the plasma actuator,thus enhancing the induced body force and jet velocity generated by the DBD actuator.[23,24]
The TED configuration was first proposed by Aredet al.[25]Later, Lousteet al.[26]analyzed the electrical characteristics of a TED actuator when a negative DC was applied to electrode #3 and found that the current waveform did not change in the AC positive half-cycle.In contrast, a higher current pulse waveform appeared in the negative half-cycle.Moreauet al.[25]studied TED actuation characteristics and found that changing the amplitude and polarity of the DC voltage significantly affected the discharge phenomenon and the induced flow structure.When a negative high-voltage DC is connected to electrode #3, the jet direction will change with alternation of the DC voltage.The plasma discharge will extend gradually with increase in the DC voltage amplitude until the whole actuator surface is covered; the maximum plasma extension is up to 40 mm, so this actuation type is called a sliding DBD(SL-DBD).[23]
When a positive high-voltage DC is connected to electrode#3, although the discharge area does not change significantly compared with DBD the induced velocity profile increases, and the body force is enhanced dramatically.Such plasma actuation is called extended DBD (EX-DBD).[13]Although a TED has the advantages of a more significant induced body force, controllable jet direction and wider plasma discharge extent than a DBD,the addition of a DC power supply will also inevitably cause an increase in power consumption.Therefore the comprehensive performance of plasma actuators still needs to be further explored.
Body force is an important parameter for characterizing the performance of a plasma actuator.Debienet al.[28]measured the induced body force of an EX-DBD using a highprecision balance and verified that a positive DC could enhance the body force.This measurement method is simple and fast for obtaining the total time-averaged body force.However,it cannot obtain the spatial distribution of the body force.Thus,the resultant body force is often smaller than the actual value due to the influence of frictional drag formed by the induced flow field on the surface of the dielectric layer.[29]Another method to measure the body force is to use laser Doppler velocimetry (LDV) or particle image velocimetry (PIV).The Navier–Stokes equation can calculate the distribution of the body force of the plasma actuator in differential form.[30,31]This method gives the total time-averaged body force and the distribution of the body force in space,making it easier to evaluate the performance of the plasma actuator.
This paper will study the AC and DC power consumptions,induced flow field velocity distributions and body force distributions for three plasma discharge modes (EX-DBD,DBD and SL-DBD) based on the power evaluation with PIV and the Navier–Stokes equation.We analyze the electrical,body force and aerodynamic characteristics of different discharge modes.Further,the comprehensive performance under different discharge modes is calculated through the comprehensive figure of merit(OFM)calculation formula.This work provides a theoretical guide for practical engineering applications of plasma flow control.
2.Experimental setup
The TED plasma actuator is shown in Fig.2,and mainly consists of an insulating dielectric plate and three copper electrodes.Electrodes #1 and #3 are exposed electrodes (2 mm wide)while electrode#2 is a buried electrode(20 mm wide);the gap between the exposed and buried electrodes is 0 mm.The dielectric layer is a 0.9 mm thick FR4 material with relative permittivityε=4.4,and the buried electrode is covered by Kapton film.The metal electrodes are produced by a chemical etching process,and have an effective length of 50 mm and a thickness of 35 μm.

Fig.2.Geometric parameters of the TED plasma actuator.
The electrical measurement system consists of a millisecond AC power supply, a DC power supply and other electrical measurement equipment (see Fig.3).The millisecond AC power supply is CTP-2000K made by Corona Laboratory,which can output sine waveforms with a frequency of 5 kHz–30 kHz and an adjustable output peak-to-peak voltage from 0 kV to 30 kV.The DC power supply is a CX-300B dual high-voltage power supply with an adjustable output voltage of 2.5 kV–30 kV and an output current of 0 mA–10 mA.A Tektronix MDO3014 oscilloscope is used for the acquisition of electrical parameters.The AC and DC voltage measurements are made with a high-voltage probe(Tektronix P6015A)and the AC waveform is measured with a current transformer(Person 2877).It is worth pointing out that a passive probe(PVP2350)is used in parallel with a 10 kΩ resistor to measure DC currents to prevent displacement currents generated by AC voltages from interfering with the measurement results.

Fig.3.Electrical characteristics measurement system.
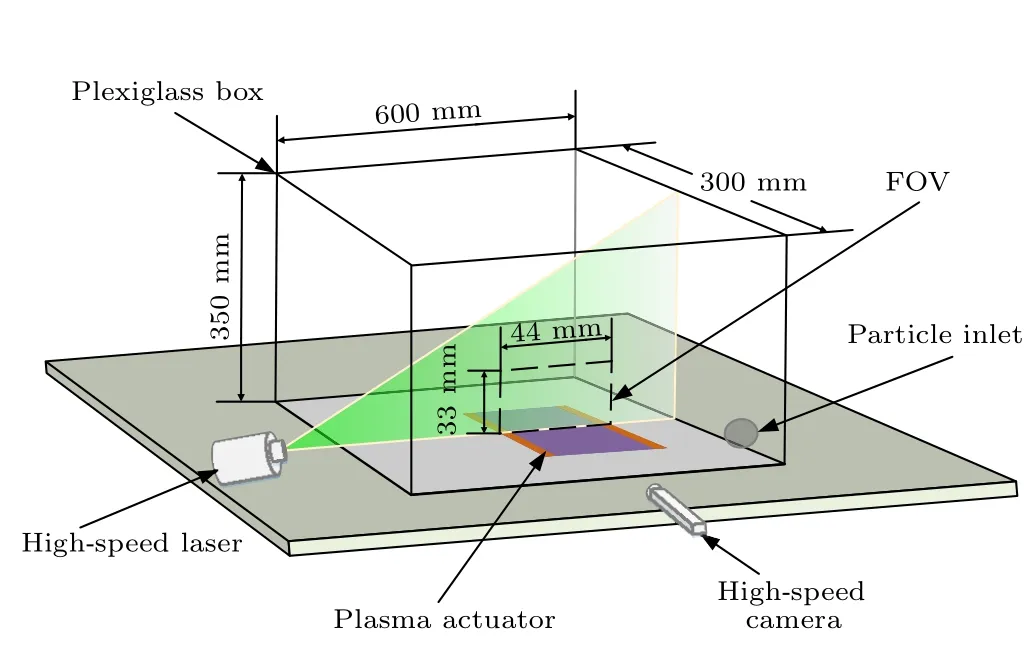
Fig.4.Schematic diagram of the PIV experimental setup(FOV,field of view).
PIV is a technique that captures instantaneous flow information for the entire flow field.It is based on the principle of calculating the fluid velocity at the particle location by capturing the displacement of a tracer particle over a short time.The PIV measurement system mainly consists of a double-pulse laser and a high-speed double-frame camera(Imager Pro LX),as shown in Fig.4, and the acquisition frequency is set as 11 Hz.The lens system of the laser produces a sheet laser beam approximately 1 mm thick,which ensures that the flow field acquired by the PIV system is two-dimensional.To ensure that the tracer particles(smoke particles with a diameter of approximately 1 μm) are not affected by the external flow field, PIV measurements are carried out in a glass box that is 600 mm long, 300 mm wide and 350 mm high.The experimental setup of the shooting field of view is 44 mm×33 mm,corresponding to a resolution of 1600 pixels×1200 pixels,and the pixel density is 36.36 pixels·mm-1.Measurements are collected for 10 s for each case, and 11 results are collected per second.One hundred and ten velocity vector distribution pictures are obtained after 10 s of PIV shooting for vector averaging.Data postprocessing is done with Davis 10.2 software.The postprocessing method is multichannel vector calculation with a rectangular interrogation window of 32×32 pixels and 75% overlap.None of the images in this experiment were smoothed.
3.Calculation method
To evaluate plasma actuator performance it is necessary to obtain the maximum induced jet velocity,total body force and power consumption for different input parameters.The velocity distribution can be obtained from the PIV experiment and the maximum induced jet velocity can be selected.The calculation methods involved in this section include(i)the calculation methods for the magnitude and distribution of the body force using the velocity vector field,(ii)the calculation of the power consumption and (iii) the comprehensive performance evaluation method.
3.1.Calculation of induced body forces
There are two main methods for calculating the body force using the PIV velocity distribution:[30,31](i)the Navier–Stokes equation in integral form and (ii) the Navier–Stokes equation in differential form.The integral form of the Navier–Stokes equation can only obtain the total body force.The differential form of the Navier–Stokes equation can get not only the total body force but also the spatial distribution of the body force.Thus, the differential form of the Navier–Stokes equation is selected in this paper.
Assuming that the flow field in the computational domain is two-dimensional steady-state, laminar and incompressible,the differential form of the Navier–Stokes equation is as follows:
wherefxandfyrepresent the spatial distribution of the body force in the horizontal and vertical directions,uandυare the horizontal and vertical components of the induced jet velocity,which are obtained from PIV experimental results,ρis the atmospheric density,µis the kinematic viscosity of air andρandµare taken as the corresponding values at 20°C at standard atmospheric pressure.
Thus, equations (1) and (2) have three unknown quantities, and Kriegseis[30]considered that the pressure term in the equations is at least one magnitude smaller than the body force term; thus, the assumption of an atmospheric pressure flow field is made here, namely,∂p/∂x=0.Moreover, the variablesfxandfyhave unique solutions.The horizontal and vertical components of the body force can be obtained by integrating the body force of the fluid microelements, and the resultant body forceFcan be calculated from
The velocities of the fluid velocity domain and fluid boundaries in Eqs.(1) and (2) are obtained by PIV measurement.The velocity at the wall boundary(the lower boundary of the computational domain) is theoretically 0 m·s-1.Therefore,we adopt the one-sided finite difference method to calculate the first-and second-order partial derivatives in the vertical direction of the wall boundary.The central difference method calculates the remaining first-and second-order partial derivatives with second-order accuracy.The integral operations for Eqs.(3) and (4) are computed using the second-order compound trapezoidal formula.
3.2.Calculation of the discharge power consumption.
The power consumption of the TED actuator can be calculated using
whereV(t)andI(t)are the instantaneous voltage and current values, respectively, at timet,TACis the time period of the high-voltage alternating current andfACis the frequency of the high-voltage alternating current.In this paper,the acquisition time interval for voltage and current is 2 ns,and 18 cycles of current and voltage waveforms are acquired to ensure the accuracy of the power consumption calculation.
3.3.Performance evaluation method
To evaluate the comprehensive flow control performance of an actuator,Seifert[32]defined a dimensionless parameter to quantify the OFM of a plasma actuator
whereFis the body force generated by the actuator,Upis the maximum induced jet velocity of the actuator andWis the mass of the actuator.PowerPis obtained from Eq.(6).Because the same configuration is used by the three discharge modes,the measured mass of the actuator isW=0.4 kg·m-1.
4.Experimental results and analysis
4.1.Analysis of electrical characteristics
In this section,we will discuss the electrical characteristics of the AC and DC components of the TED plasma actuator with different actuation parameters.According to the polarity and amplitude of the DC supply, the TED actuator discharge mode can be classified as DBD,EX-DBD or SL-DBD.When the DC voltage applied is 0 V it acts as a conventional DBD.When the DC voltage applied is positive, it is called an EXDBD and its discharge phenomenon is similar to DBD.When the voltage applied is negative, it is called SL-DBD and the plasma area can be extended from the AC electrode to the DC electrode.
Figure 4 shows the voltage and current waveforms of the two AC discharge cycles of DBD,EX-DBD and SL-DBD.In the positive half cycle of the AC component,the current waveform of the SL-DBD is not significantly different from that of the DBD.In contrast,for the EX-DBD,the current peak value of 0.082 A is lower than that of the DBD, which is 0.104 A,because the positive DC component reduces the maximum potential difference between the two electrodes of the EX-DBD,weakening the discharge intensity of the EX-DBD in the positive half cycle.In the negative half-cycle of the AC voltage,both the EX-DBD and SL-DBD show current peaks of different amplitudes.In addition,the DC voltage waveforms of the EX-DBD and SL-DBD have the same periodic fluctuation as the AC voltage frequency.This is due to the coupling relationship of the induced potential generated by the AC voltage on the DC voltage.
To study the relationship between the DC voltage and the AC and DC power consumption, the power consumption is measured when different DC voltages are applied with the same AC parameters,as shown in Fig.5.|VDC|represents the absolute value of DC voltage.Figure 5(a) shows the variation of the AC power consumption with DC voltage,and EXDBD power consumption is minimum at|VDC|=4 kV.The AC power consumption increases linearly with increasing DC voltage when|VDC|>4 kV, while the minimum DC power consumption of the SL-DBD mode occurs at|VDC|=6 kV,and the changing trend is consistent with that of the EX-DBD mode.In addition, at higher DC voltages, the maximum increase in the AC power consumption of the EX-DBD and SLDBD modes compared with DBD is 6.17% and 2.01%, respectively; thus, higher-amplitude DC voltages will slightly increase the AC power consumption.
Figure 5(b) shows the correlation between the DC voltage and DC power consumption.The DC power consumption increases linearly with increasing DC voltage, and the linear growth rate of the DC power consumption of the SLDBD mode is higher than that of EX-DBD.In addition, the power consumption of the DC component is not correlated with the AC voltage amplitude,and the respective power consumption curves of the EX-DBD and SL-DBD modes remain almost the same.Steady-state DC actuation cannot generate plasma actuation alone, which indicates that most of the DC power consumption is unrelated to the plasma discharge.To further investigate the energy loss of the DC component, the resistance between the upper and lower electrodes was measured with a digital bridge; the resistance valueRbetween the upper and lower electrodes was found to be approximately 180 MΩ.Ignoring the effect of the thermal deposition on the resistance value, the leakage currentIL=VDC/R, thus, when|VDC|=10 kV,the leakage current causes the conductance loss power to be approximately 11.11 W·m-1,closer to the experimentally measured value.Therefore, we can prove that the primary energy loss of the DC component is conductance loss,which can be reduced by increasing the thickness of the dielectric layer or changing the dielectric material.
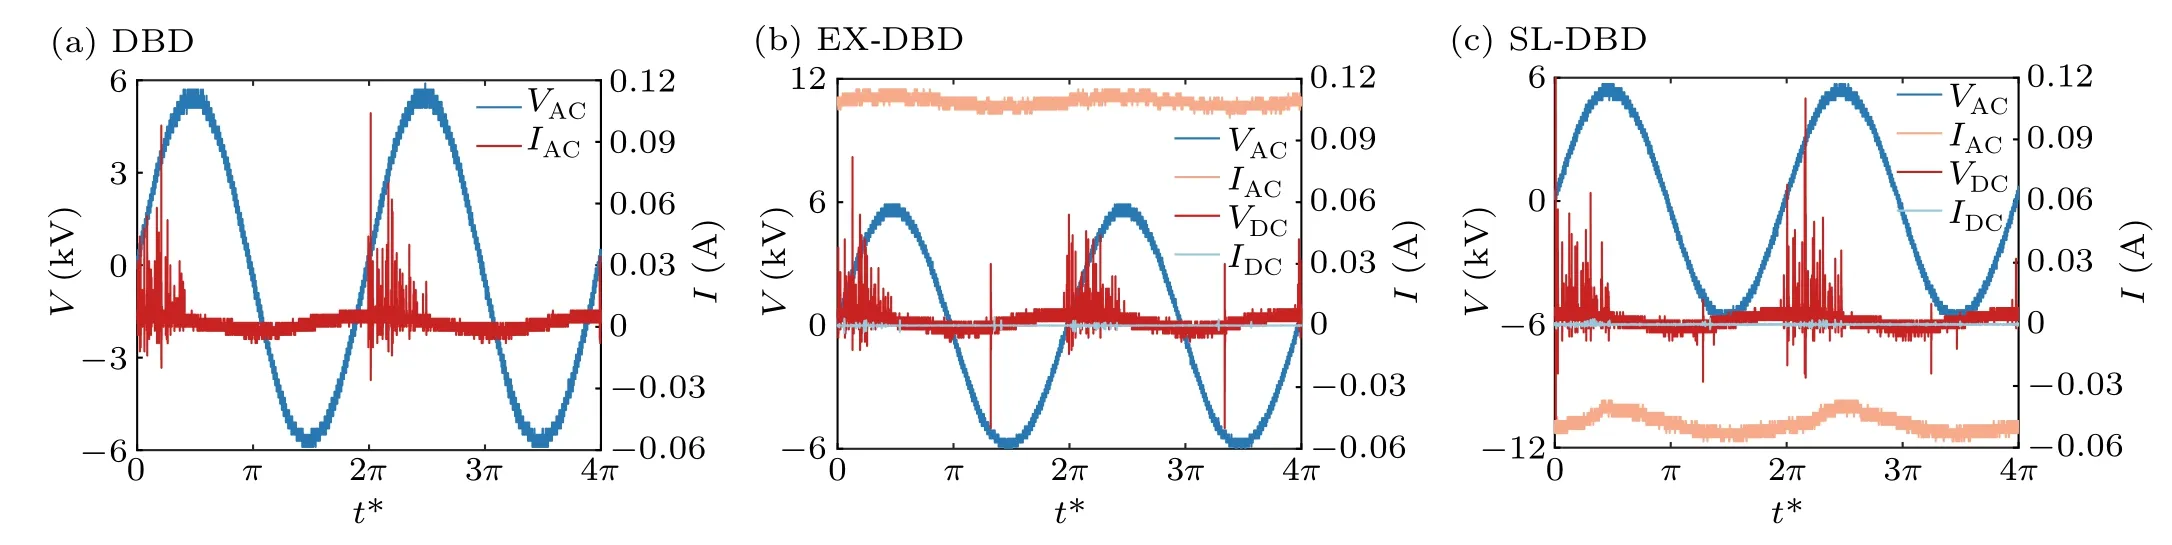
Fig.5.The voltage and current waveforms of three discharge modes: (a)DBD,(b)EX-DBD and(c)SL-DBD.
4.2.Analysis of flow characteristics
In this section, the induced flow fields of the DBD, EXDBD and SL-DBD modes are acquired by the PIV measurement system and analyzed in detail.The applied AC voltageVAC=12 kV,the AC frequency is 9 kHz and the DC voltages of the EX-DBD and SL-DBD modes are 11 kV and-11 kV,respectively.In Fig.6,the flow field area is 34 mm×20 mm.Figures 6(a)–6(c) show the induced flow fields of the DBD,EX-DBD and SL-DBD modes, respectively.The maximum induced jet velocities of the DBD, EX-DBD and SL-DBD modes are 2.99 m·s-1, 3.20 m·s-1and 2.33 m·s-1, respectively.The maximum jet velocity of the EX-DBD mode is increased by 7.02% compared with that of DBD.The velocity distribution of the EX-DBD mode is almost the same as that of DBD.The difference is that the jet velocity of DBD shows a decreasing trend along the wall direction: while the jet velocity of EX-DBD near the wall(y <2 mm)always stays above 2 m·s-1,the velocity decreases more slowly compared with that of DBD.The EX-DBD mode has a velocity extreme value atx=19 mm (3 m·s-1).The jet direction of SL-DBD can deflect, which is consistent with the experimental results of Moreauet al.[25]We found that the position of the velocity extreme of the SL-DBD was far from the wall and appeared at a distance of about 5 mm from the wall,with a 22.07%reduction in velocity compared with DBD.The black curve in the figure is the contour of 10%of the maximum velocity.The contour represents the range of flow field perturbation of the plasma actuation.The range of influence of EX-DBD and SLDBD is much more extensive than that of DBD.Moreover,the range of the perturbation extends to approximately 15 mm from the wall.
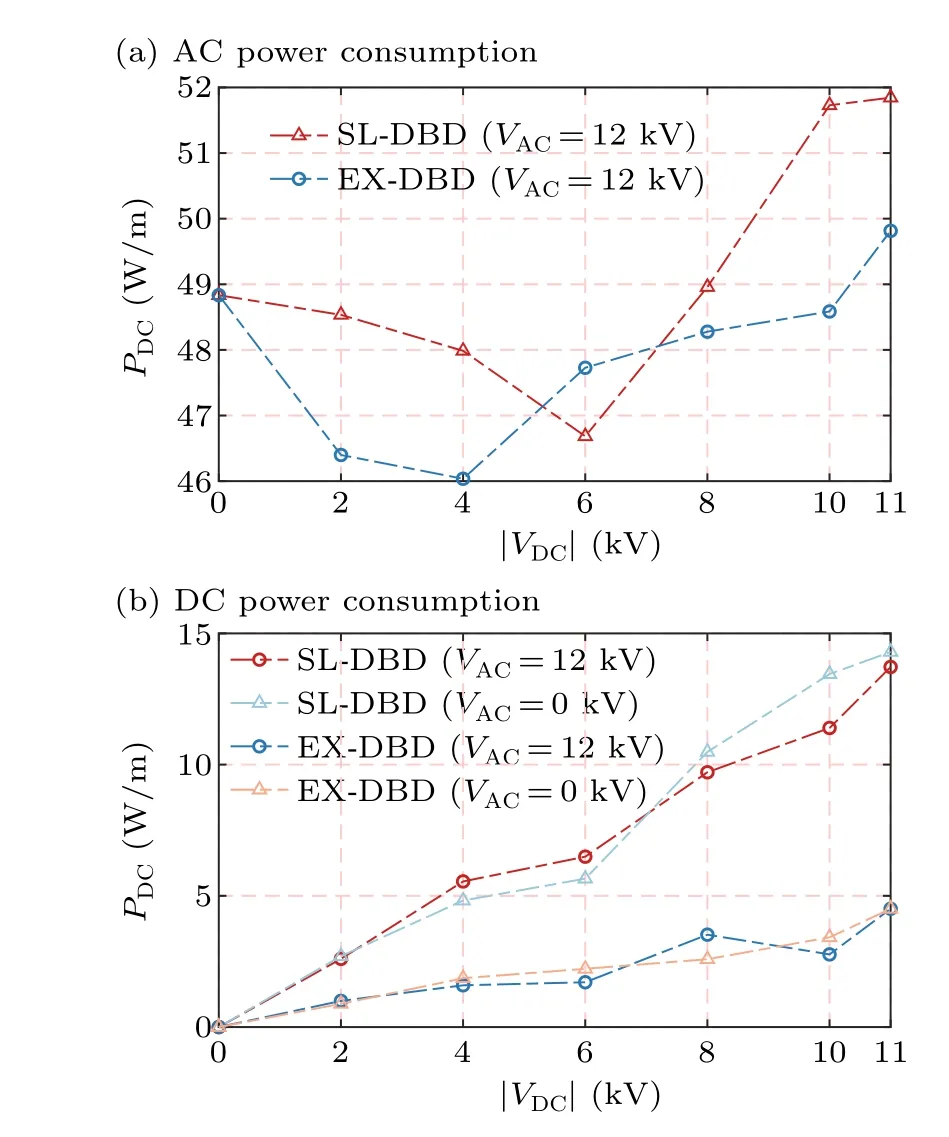
Fig.6.Analysis of the total power consumption:(a)AC power consumption and(b)DC power consumption.
4.3.Analysis of body force
The body force distributions of the three actuation modes are obtained based on the velocity distribution calculated in Subsection 4.2.The computational domain of the body force distribution is set to 25 mm×7 mm, and figures 7(a)–7(c)show the distribution of body forcefxin the horizontal direction for DBD, EX-DBD and SL-DBD, respectively.Thefxof DBD is mainly concentrated in the range of 0 mm<x <5 mm near the wall and shows the highest extreme valuefxmax=5.82×10³N·m-3among the three actuation models.The distribution of EX-DBD is broader than that of DBD,extending to approximately 6 mm from the wall, which is the principal reason why the disturbance range of EX-DBD is more extensive than that of DBD.The extreme value of SL-DBD is the smallest among the three discharge modes(fxmax=1.68×10³N·m-3,fxmin=-1.62×10³N·m-3), indicating that the negative DC suppresses the body force in the horizontal direction.
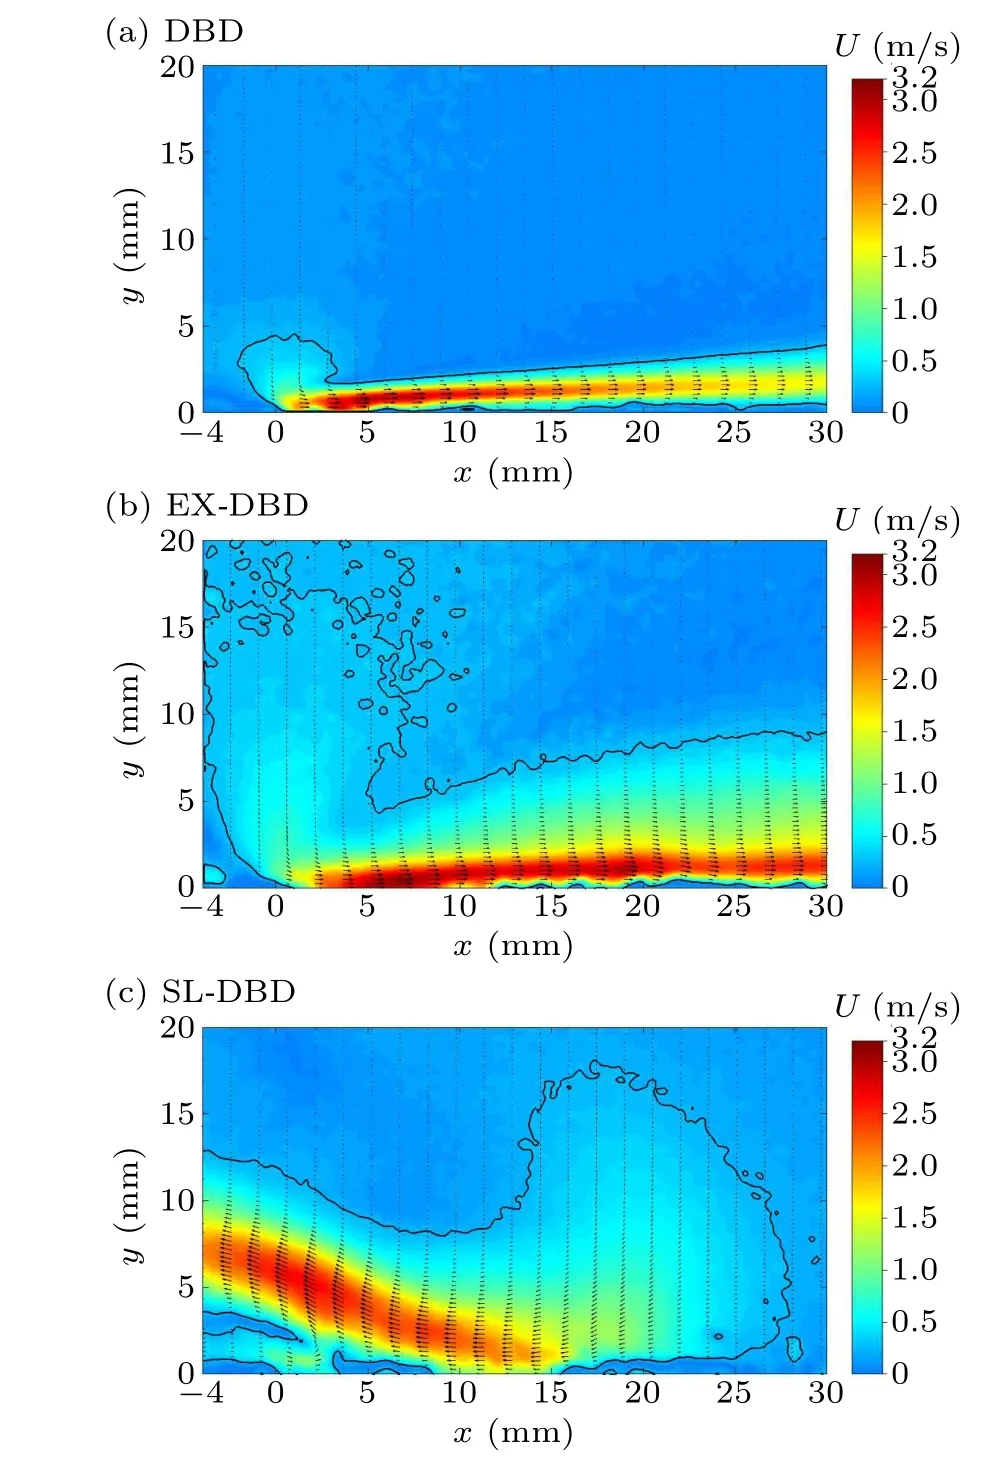
Fig.7.Velocity distribution of the TED-induced flow field: (a) DBD,(b)EX-DBD and(c)SL-DBD.

Fig.8.Body force distribution in the horizontal direction.

Fig.9.Body force distribution in the vertical direction.

Table 1.The resultant body force in different discharge modes.
Figure 8 shows the distribution of the body force intensityfyin the vertical direction for the three discharge modes.As shown in Fig.8,thefydistribution of the DBD is the smallest and is primarily concentrated near electrode #1, while thefydistribution of the EX-DBD is mainly concentrated near the two upper electrodes.The extremefyvalue of the SL-DBD is more significant than that of the DBD and EX-DBD.Additionally, the distribution range is the largest among the three discharge modes.This body force distribution increases the vertical component of the induced jet velocity.
The results for calculation ofFx,FyandFfor the three discharge modes are shown in Table 1.Moreover, the DBD body force in the horizontal direction is 6.89 N.This is one order of magnitude larger than that in the vertical direction,which is consistent with the findings of Zhao.[33]The EXDBD body force in the horizontal direction is 13.17 N,which is 91.15% higher than for the DBD because the area of distribution of the EX-DBD body force is more extensive than that of the DBD.Althoughfxof the SL-DBD in Fig.7(c)shows a smaller extreme value, the large area of negativefxvalues causes the directionFxof the SL-DBD to change.The body force in the vertical direction is elevated by an order of magnitude compared to the DBD, and the two factors combined cause the induced jet of the SL-DBD to be deflected.In addition,the resultant force of the SL-DBD is increased by 141.33%,which shows that SL-DBD not only enables change of the direction of the induced jet under this actuation parameter but also improves the body force significantly compared with that of the EX-DBD.
4.4.Comprehensive performance analysis
OFM is a dimensionless parameter used to evaluate the comprehensive performance of the plasma actuator flow control.The larger the value of OFM,the higher the comprehensive performance of the plasma actuator (OFM is defined in Eq.(7)).
This section uses this evaluation method to quantitatively analyze the comprehensive performance of the three discharge modes.The results are shown in Table 2.
The performance of the SL-DBD and EX-DBD modes showed more significant improvement than that of the DBD mode,with maximum values of 3.63 times and 3.88 times that of DBD, respectively.However, whenVDC=-9 kV, the induced jet velocity and resultant body force of the SL-DBD are decreased dramatically,resulting in the comprehensive performance of the SL-DBD being lower than that of the DBD.Thus,SL-DBD only has a better comprehensive performance than DBD when the DC voltage is large.

Table 2.Comprehensive performance under different actuation parameters.
The significant increase in body force is the main reason behind the improved comprehensive performance of the EX-DBD and SL-DBD.It is worth noting that the evaluation method of Eq.(7) only considers two output characteristics of the actuator, namely, induced jet velocity and body force.However,the discharge area and controllable jet direction for the SL-DBD are not quantified.In addition,it is known from the discussion of Subsection 4.1 that most of the power consumed under a DC supply does not contribute to the plasma discharge.If the dielectric layer material and thickness can be further optimized to reduce the DC power consumption,the comprehensive performance of the TED plasma actuator would be expected to improve.
5.Summary
In this paper,we calculate the power consumption of different TED discharge modes and analyze the effect of DC voltage on the AC and DC power consumption.The induced flow field structures of the DBD, EX-DBD and SL-DBD modes are comparatively studied.The body force distributions of the three actuation modes are calculated using the Navier–Stokes equation in differential form based on the PIV velocity distribution.The differences in the body force distributions of the three discharge modes are discussed.Finally,the comprehensive flow control performance of the three discharge modes is comprehensively analyzed based on the experimentally obtained maximum induced jet velocity,resultant body force and power consumption.The following conclusions can be drawn from our experimental results:
(i) Study of the discharge waveforms revealed that the EX-DBD and SL-DBD modes show current peaks of different amplitudes in the negative half-cycle of the AC waveform,which is the main difference between the TED and DBD discharge waveforms.In addition, most of the power consumption of the DC component is independent of the AC voltage change, and the primary power loss is the DC conductance loss.
(ii) The area of influence of the induced flow field of EX-DBD and SL-DBD is much larger than that of DBD.The extreme velocity values of EX-DBD are enhanced by 7.02%compared with DBD.In addition, the induced jet of the SLDBD is deflected, and the velocity extremum position is far from the wall, appearing at 5 mm from the wall, with the velocity being reduced by 22.07%compared with the DBD.
(iii) The change in the horizontal body force and the increase in the vertical body force of the SL-DBD are the main reasons for the deflection of the jet direction.In addition,the peak maximum body force of the EX-DBD and SL-DBD does not significantly increase compared with that of the DBD.The resultant body force of both the EX-DBD and SL-DBD increased significantly, by 91.15% and 141.33%, respectively,compared with that of the DBD,which is mainly attributed to the increase in the body force distribution area.
(iv)The OFM analysis shows that when a higher DC voltage is applied, the comprehensive flow control performance of the EX-DBD and SL-DBD is significantly improved(3.63 times and 3.88 times that of the DBD,respectively).In this paper, the comprehensive performance evaluation method only focuses on flow control performance; it does not quantify the advantages of the large discharge area and controllable injection direction of the SL-DBD.In addition,the primary power loss caused by the DC electrode is conductivity loss.Power consumption can be further reduced by optimizing the dielectric layer material and thickness to improve the comprehensive flow control performance of a TED.
Acknowledgments
Project supported by the National Natural Science Foundation of China(Grant Nos.12175177 and 61971345)and the Foundation for Key Laboratories of National Defense Science and Technology of China(Grant No.614220120030810).
猜你喜欢
杂志排行

Chinese Physics B的其它文章
- Dynamic responses of an energy harvesting system based on piezoelectric and electromagnetic mechanisms under colored noise
- Intervention against information diffusion in static and temporal coupling networks
- Turing pattern selection for a plant–wrack model with cross-diffusion
- Quantum correlation enhanced bound of the information exclusion principle
- Floquet dynamical quantum phase transitions in transverse XY spin chains under periodic kickings
- Generalized uncertainty principle from long-range kernel effects:The case of the Hawking black hole temperature