Unveiling phonon frequency-dependent mechanism of heat transport across stacking fault in silicon carbide
2023-10-11FuWang王甫YandongSun孙彦东YuZou邹宇BenXu徐贲andBaoqinFu付宝勤
Fu Wang(王甫), Yandong Sun(孙彦东), Yu Zou(邹宇), Ben Xu(徐贲), and Baoqin Fu(付宝勤),†
1Key Laboratory of Radiation Physics and Technology of the Ministry of Education,Institute of Nuclear Science and Technology,Sichuan University,Chengdu 610064,China
2Graduate School,China Academy of Engineering Physics,Beijing 100193,China
Keywords: silicon carbide,stacking fault,thermal conductivity,interface thermal resistance,phonon transport,
1.Introduction
Renewable energy development cannot be achieved without advanced materials, such as silicon carbide (SiC).Due to its excellent mechanical and physical/chemical properties,SiC is widely used in the fields of nuclear energy[1–3]and semiconductor.[4–6]For example, SiC materials have been a middle layer for preventing fission product diffusion and providing structural support in TRISO fuel particles for the high-temperature gas-cooled reactor.[7]SiC is also used in high-temperature/high-voltage wide band-gap semiconductor device, which is also known as third-generation semiconductor materials.Furthermore, it is expected to become an application material in the field of thermoelectric power at high temperatures.[8–11]In these fields, the thermal conduction properties are usually considered critical metrics for evaluating the performance of SiC materials.High thermal conductivity is conducive to rapid heat transfer, while low thermal conductivity is conducive to improving the thermoelectric properties of the material.The thermal conductivity of perfect crystal SiC has been explored by theoretical or experimental approaches in several studies.[12–15]In general,experimental measurements are often lower than theoretically calculated values, which may be due to the existing crystal imperfections in the experimental sample.Previous researches have established that defects in crystalline materials such as point defect,[16,17]dislocation,[18]and grain boundary(GB)[19]will reduce the thermal conductivity of the SiC materials.Stacking fault(SF),as a typical GB,is widely exiting in the usual SiC materials.It has been found that a larger number of SFs will occur in the processes of growth[20–23]and irradiation[24]of silicon carbide.It can be conceivable that the occurrence of SFs may inevitably affect the thermal conductivity of SiC materials.Therefore,it is important to study the effect of SFs on the thermal conductivity of silicon carbide and its mechanism.
Some works have shown that SFs could play an important role in the thermal conduction of SiC,which was also demonstrated later in this work.Goelaet al.[25]used x-ray diffraction(XRD) technology to characterize SFs in SiC, demonstrated that the effect of SF densities on the thermal conductivity of silicon carbide is notable and the thermal resistance (inverse thermal conductivity)is observed to vary roughly linearly with the SF densities.However,the XRD technology is an indirect characterization means to measure the density of SFs and it cannot give the exact type and composition of the crystal imperfections of the SiC materials.An SF in 3C-SiC (β-SiC,face-centered cubic structure) is composed of one irregularity in the stacking sequence of the close-packed Si–C bilayers and two twin boundaries (TBs).There is more than one SF type, e.g., the intrinsic SF (isolated 1SF plane) and extrinsic SF (2SF layer),[26]and continuous stacking faults can form twin crystals locally.It has been pointed out that the TB and the SF in indium phosphide materials have different interface thermal resistances (ITRs),[27]so they may have different influence mechanisms on heat transport.In non-metallic materials,phonons are generally considered to be the main carriers of thermal transport.There exists extra rotated phonon polarization between two connective leads for TB with respect to SF, whereas only the structural distortion at the SF plane is the physical reason behind the ITR.Thus, the study of the SF plane can more effectively focus on the effects of localized structure at the interface on thermal conduction,which is also the motivation of this work.There are only a few researches about the ITR of SF in SiC.Panet al.[28]studied the effect of the isolated SF on the phonon density of states (DOS).It was found that the phonon DOS of the SF with respect to that of the bulk changed in the acoustic branches part, forming a defective phonon state.However, phonon transport is influenced not only by the DOS but also by the group velocity and phonon lifetime.Little has been reported about the SF effect on the phonon lifetime,and the phonon scattering mechanism of the SF is still unclear for SiC.It is both interesting and important to understand the interaction between phonon and SF from the point of view of heat-conduction physics and its applications.Non-equilibrium molecular dynamics(NEMD)are widely used to simulate phonon transport processes in some materials, such as mono-crystalline materials and materials with defects.[29,30]However, it is difficult to obtain phonon information for NEMD, spectral heat flux methods based on NEMD simulations and lattice dynamics are required to obtain the contribution of the phonon with different frequencies to the heat flux.[31,32]
In this work,the ITR of an isolated SF in SiC was studied and the phonon scattering mechanism by the SF is systematically investigated.First, the SF effect on the thermal conductivity of SiC was studied using NEMD simulation,and the size effects on the thermal conductivity and ITR are discussed.Second,based on the analysis of the spectral heat flux,the frequency range of the phonon scattered by an isolated SF was obtained.Lastly, the phonon properties were calculated by lattice dynamics,and the influence mechanism of the SF interface on phonon transport is further analyzed.The rest of the article is structured as follows.The methods(e.g.,NEMD simulation,the method of spectral heat flux,and lattice dynamics simulation)employed in this work are briefly described in Section 2.The simulation results were presented and discussed in Section 3,and the following is the conclusion.
2.Methods
2.1.Nonequilibrium molecular dynamics
In this paper,all NEMD simulations were carried out using the LAMMPS software package.[33]A machine learning(ML)potential developed in our group[34]was adopted to describe the interactions between atoms in silicon carbide since the ML potential can well reproduce the thermal properties of SiC.The simulation cell used in the NEMD simulations is shown schematically in Fig.1.To reduce the computational cost, we adopt the end-fixed model, which can also prevent the simulation cell from translational motion.To reach a stable non-equilibrium state with thermal current through the simulation cell,the atoms located in the hot(cold)region adjacent to the two end-fixed regions are coupled to hot and cold Langevin heat baths[35]at temperaturesT+ΔTandT-ΔT, respectively.In this work, the mean bath temperature (T) and the temperature bias (ΔT) were usually set to 300 K and 100 K,respectively.The simulation time step was 0.25 fs, and the bath coupling time constant was chosen as 0.1 ps.The lengths of stacking fault and perfect models(the lengths of the simulation cells in thezdirection)were chosen aslz(lz=33.5 nm,95.1 nm, 128.1 nm, and 181.4 nm) to deal with the effect of finite size, and the cross-sectional dimensions (lx×ly) were set to 2.1 nm×2.4 nm.The cross-sectional dimensions are adequate,and their effect on thermal conductivity will be discussed in Subsection 3.1.The mutually perpendicular axes(x,y, andz) are oriented along [1¯12], [110], and [¯111] directions,respectively.For the SF models,one isolated 1SF plane perpendicular to thezdirection was created in the middle of the simulation cell as shown in Fig.1.The detailed structure of the stacking fault is shown in Fig.2.The dotted line in Fig.2(a)facilitates observation of the stacking fault structure from a front view.Periodic boundary conditions were adopted in thexandydirections.

Fig.1.Schematic representation of simulation cell used in NEMD.The two regions at opposite ends of the simulation cell are fixed.The hot/cold regions adjacent to the two end-fixed regions are coupled to hot/cold baths.The atomic velocities in the two groups(denoted by L and R)on both sides of the interface(e.g.,SF)are sampled for calculating the spectral heat flux.The width of fixed regions,hot/cold regions,and L/R-group regions are all more than the cutoff distance of the used potential.
The simulation procedure can be divided into several stages: First,the simulation cell was optimized to find the local lowest energy state,the atomic velocity was set according to the Maxwell–Boltzmann distribution, and then 4000 timesteps are run in the isothermal–isobaric ensemble (NPT) to reach 0 Pa and a given temperature, and 4000 time-steps of the canonical ensemble (NVT) continue running for a stable temperature evenly distributed in the simulation cell.Second,Langevin heat baths were coupled to the hot and cold regions and the simulation cell was running 3×10⁶time-steps in the micro-canonical ensemble (NVE).The duration of the data(e.g., temperature distribution, heat flux, and velocity fields used in the calculation of spectral heat flux) collection is the later 2.5×10⁶time-steps,and the previous 5×10⁵time-steps(125 ps) are long enough to establish a stable temperature gradient in the simulation cell as discussed below.Therefore, based on the stable heat flux (J) and temperature gradient(dT/dx),the thermal conductivity(κ)can be calculated through Fourier’s law[36]J=-κ(dT/dx).
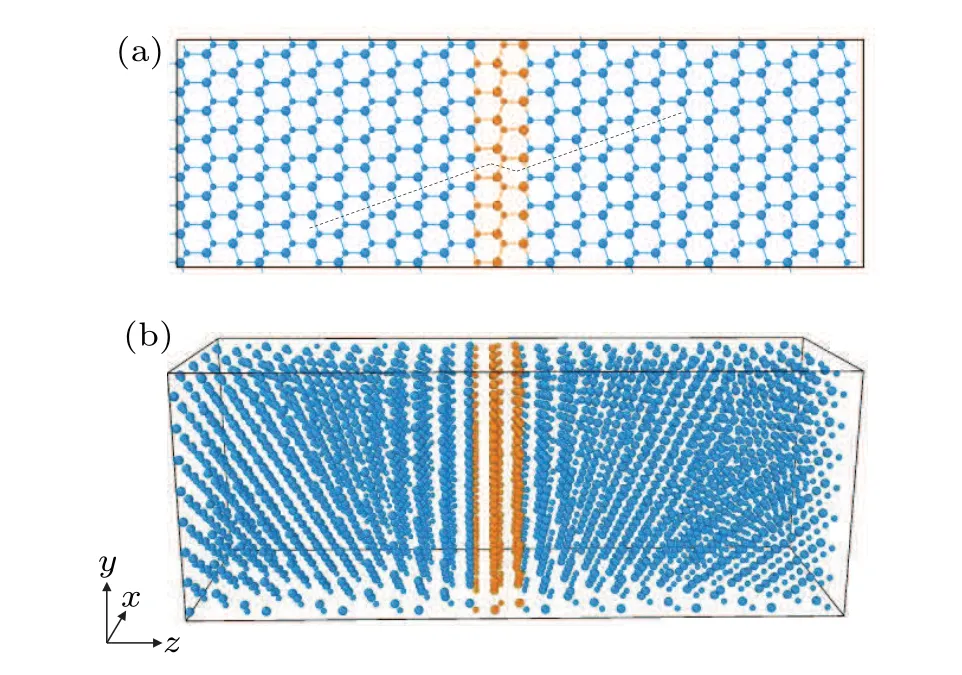
Fig.2.Schematic diagram of the stacking fault structure in both(a)the front view and(b)the perspective view.The blue atom(large ball is silicon atom,small ball is carbon atom) represents the perfect structure, and the orange atom (large ball is silicon atom, small ball is carbon atom) corresponds to stacking fault structure.The dotted line serves as a guide line.
2.2.Spectral heat flux
To study the phonon frequency-dependent contribution to thermal conduction,the spectral heat flux(q(ω))resolved by phonon frequency through thezdirection in the simulation cell was calculated.The spectral heat flux transferred from atomi(in the L-group) to the atomj(in the R-group) through the interface between the L-group and R-group(qi→j(ω))can be calculated by the following formula:[37]
Summing the heat flux transferred from the atoms in the L-group to the atoms in the R-group and dividing by the crosssectional areaAof the simulation cell,the total phonon spectral heat flux can be yielded,
where the width of the L/R-groups is 1.0 nm, more than the cutoff distance of potential.
2.3.Lattice dynamics
3.Results and discussion
3.1.Thermal conductivity
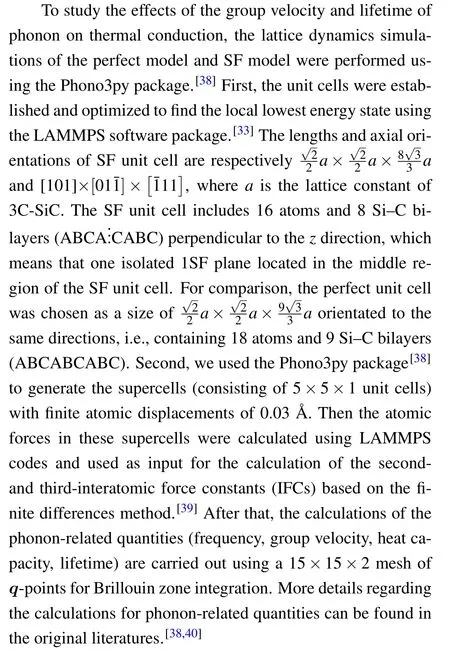
To obtain the stable heat flux through the simulation cell,the hot and cold regions were held at different temperatures(T+ΔTandT-ΔT).The cumulative energy added to the hot-region (ε+) is similarly equal to that subtracted from the cold-region (ε-) and proportional to the heat flux through the simulation cell.The heat flux (J) can be calculated byJ=Δε/AΔt,where Δεis the average cumulative energy(Δε=(ε++ε-)/2)at time interval of Δt.Figure 3(a)shows the variation of the average cumulative energy of the two models over time.It can be seen that the energy of both models varies linearly with time,indicating that the heat flux in the simulation system has been constant and the simulation cell has reached a steady state.There exists a stable temperature profile along the heat flux direction (zdirection) although two strong nonlinear temperature profiles are observed near the hot/cold regions.As can be seen from Fig.3(b), a linear temperature gradient(dT/dz)is obtained in the intermediate region of the perfect model; however, a temperature drop is found around the SF region in the SF model.A similar phenomenon was also reported for tilt grain boundaries in cubic SiC.[41]The destruction of the perfect periodicity caused by the SF plane increases the phonon scattering processes around the interface,resulting in a drop in temperature.The microstructures of the stacking fault model(···ABCA...CABC···)and perfect model(···ABCABCABC···) were also shown in Fig.3(b).For the determination of the temperature gradient of the SF model,an average value of dT/dzwas calculated in the whole intermediate region.As mentioned above, the thermal conductivity(κ)can be calculated based on the obtained heat flux and temperature gradient.First, we tested the effect of cross-section on thermal conductivity.
Fig.3.(a)The average cumulative energies of the two models as functions of time.(b)Temperature profile and microstructure of the perfect model and stacking fault model, big (small) balls denote Si (C) atoms and the red balls are identified as the SF–Si atoms.The length of the model is 33.5 nm.
Figure 4 shows the effect of cross-section on thermal conductivity of the perfect model with anlz-length of 33.5 nm.It can be seen that when the cross-section is larger than 2 nm×2 nm, it has almost no effect on thermal conductivity.Considering computational resources, we chose a crosssection of 2.1 nm×2.4 nm for the later work.
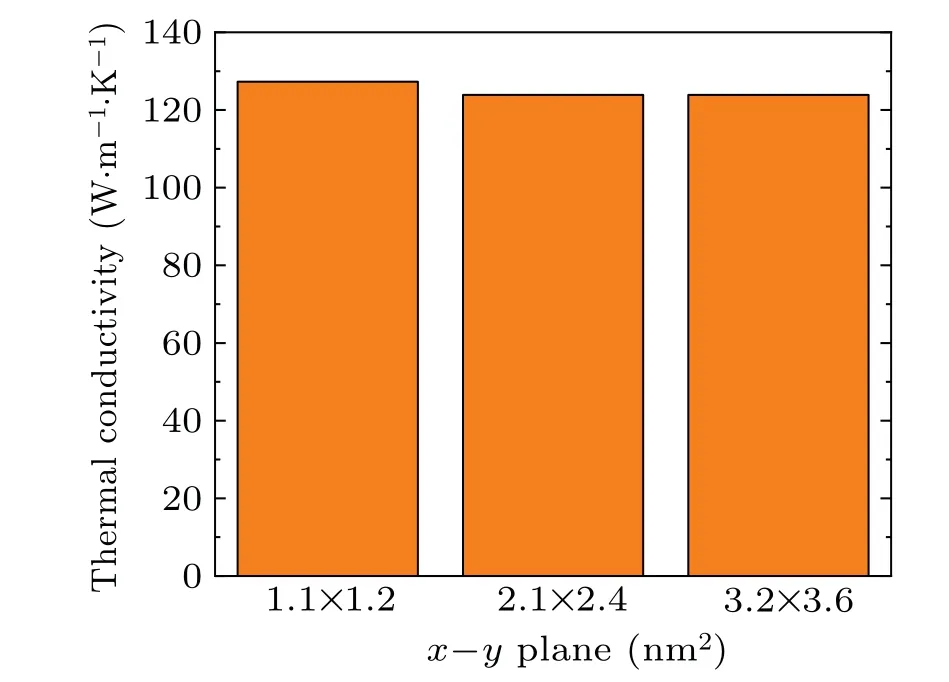
Fig.4.Thermal conductivity of the perfect model with different crosssection of x–y plane.The lz-length of these models is 33.5 nm.
As discussed in previous works,[42–44]the size of the simulation cell affects the thermal conductivity calculated by NEMD simulations.Figure 5(a) shows the dependencies of the thermal conductivity on the model length(i.e.,lz).Whether for the perfect model or the SF model,the thermal conductivity increases with the increase of the model length.The finite-size effects arise when the length is not significantly longer than the phonon mean free path, being a result of the phonon scattering that occurs at the interfaces with the heat bath.[45]When the model length is much smaller than the phonon mean free path,the characteristic features of some phonon transports are quasi-ballistic and the thermal conductivity is linearly related to the model length.With the increase of the model length,the increment rate of thermal conductivity is reduced,and the phonon transport is gradually dominated by diffusive transport due to phonon–phonon scattering.For the SF model,the extra phonon-SF scattering results in a lowering of the thermal conductivity,which is in agreement with experimental results.[25]
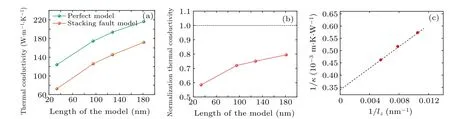
Fig.5.(a)Thermal conductivities of the two models and(b)normalized thermal conductivity of the SF model as functions of the length of the model.(c)Perfect model length dependence of 1/κ on 1/lz.The dashed lines are linear fits to the discrete data.
Figure 5(b)shows the normalized thermal conductivity of the SF model as a function of the length of the model, where the normalized thermal conductivity is the ratio of thermal conductivity between the SF model and the perfect model for each size.As shown in Fig.5(b), the smaller the length, the smaller the normalized thermal conductivity of the SF model.A smaller length means there is a high SF density in the simulation cell.Therefore, the SF effect on the thermal conductivity gradually increases as the SF density increases, which is also in agreement with the result of previous work.[25]In Fig.5(c), we show the relationship between the inverse of thermal conductivity (κ) and the inverse of the length (lz) of a perfect model calculated by NEMD.It can be seen that 1/κlinearly increases with 1/lz,allowing us to extrapolate to obtain the thermal conductivity for infinite model length (kbulk) and then deal with the effect of finite size.Thekbulkis found to be 294.1 W·m-1·K-1,which was close to the experimental value 298.8 W·m-1·K-1.[3]Additionally,we calculated the thermal conductivity of perfect SiC using lattice dynamics method,resulting in a value of 406.5 W·m-1·K-1, which is larger than NEMD result due to lattice dynamics method not considering phonon scattering above the third order.
3.2.Interface thermal resistance
To explore the possibility of an analogous size effect for ITR, we have determined the temperature drop at the interface for models with different lengths.As shown in Fig.3(b),the temperature discontinuity(ΔT)at the isolated 1SF plane is determined by extrapolating the linear parts ofT–zsurrounding SF to the interface.The temperature drop measured in the method is more accurate than subtracting with points where the temperature profiles deviate from linearity near the stacking fault.The ΔTis 8.7 K–20.9 K,as shown in Fig.6,decreasing with the increasing of the model length, which is analogous to the previous results.[46]The corresponding ITR can be calculated by the following equation:[46]
whereJis the heat flux.The ITR is 6×10-11m2·K·W-1–7.8×10⁻¹¹m2·K·W-1, as shown in Fig.6, also decreasing with the increasing of the model length, which could be attributed to the specular reflection of ballistic phonons at the SF plane.When the length is short,the specular reflection of ballistic phonons at the SF plane results in fewer phonons crossing the interface and leads to the increase of the ITR.A similar conclusion was also obtained in the previous study of thermal resistance at heterogeneous smooth interfaces.[47]Moreover,it can be found that the extremely low ITR for the SF plane is much less than that in some heterointerfaces.[48,49]
In addition to being of applied relevance, the results for ITR are important because they directly challenge common phenomenological models for calculating ITR, such as the acoustic mismatch model[50](AMM)or the diffuse mismatch model[51](DMM),both of which derive ITR from mismatches in the vibrational properties of the materials involved, where the phonon dispersion is the same on both sides of the interface in the SF model.Therefore, AMM predicts an ITR of zero,which is inconsistent with our results,which yield a small but finite value.On the other hand,the DMM will produce a nonzero ITR, but it cannot distinguish between an SF interface and a virtual interface with truly zero thermal resistance, i.e.,a perfectly homogeneous sample divided into two halves considered as different regions.
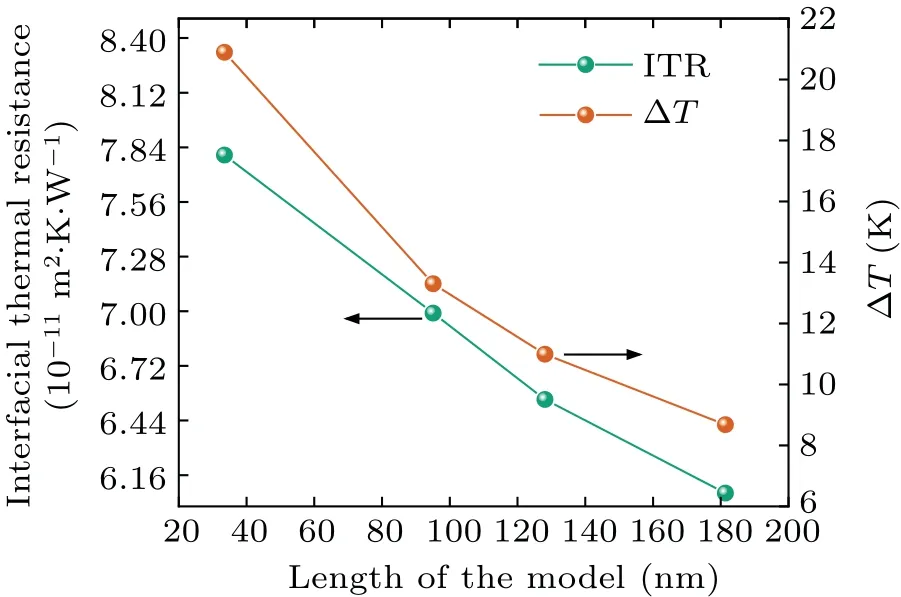
Fig.6.Interfacial thermal resistance and temperature discontinuity(ΔT)as functions of the length of the stacking fault model.
3.3.Spectral heat flux
To further understand the interface scattering process of phonons,we can calculate the spectral heat flux for both models according to Eqs.(1) and (2).From Fig.5(b), it can be seen that below 100 nm, the SF drastically reduces the thermal conductivity with respect to that of the perfect model.On the other hand, the smaller the length model is, the weaker the phononphonon scattering is, and the stronger the phonon scattering at the SF plane is.Thus, the simulations with a length of 33.5 nm were chosen as a typical example to analyze the SF effect on the spectral heat flux.We compared accumulated thermal conductivity from spectral heat flux method(κacc) with the results of NEMD method to verify the reliability of the spectral heat flux method.The accumulated thermal conductivity can be determined by making an integration of spectral heat flux and dividing it by the temperature gradient.As shown in Fig.7(a), the result is 125.7 W·m-1·K-1for perfect model(lz=33.5 nm)which is close to our NEMD results(123.9 W·m-1·K-1).The spectral heat fluxes through the SF interface of the stacking fault model and one virtual interface of the perfect model are shown in Fig.7(b).For both the two models,the major contribution to the heat flux is from the phonons whose frequencies are below 19 THz corresponding to acoustic phonon branches of the bulk material, while the contribution of optical phonon branches(ω >22 THz) is minor.The SF mainly affects the phonon transport in the frequency range of 7.5 THz–12 THz.Theq(ω)of the SF model is less than that of the perfect model in the frequency range.The difference(qperfect(ω)-qSF(ω))in the heat flux was also shown in Fig.7(b), and the prominent peak of the curve is in nearby 10 THz.The phonon DOS can be calculated by taking the Fourier transform of the autocorrelation function of the velocity of atoms nearby the interface(L-group and Rgroup).[52]It can be found that the frequency ranges of acoustic/optical phonon branches contributing to the heat flux are almost the same for both the two models since phonon dispersion and phonon DOS are similar as shown in Fig.8.The phonon frequency ranges of both the two models are consistent,and their phonon dispersions have no imaginary frequencies, proving that the structure is stable.In addition, the heat fluxes at a frequency range of lower than 5 THz are almost the same for the two models, which may be understood by considering that low-frequency phonons have longer wavelengths,these long wavelength phonons will not be scattered by the stacking fault and pass through with no reduction in energy.
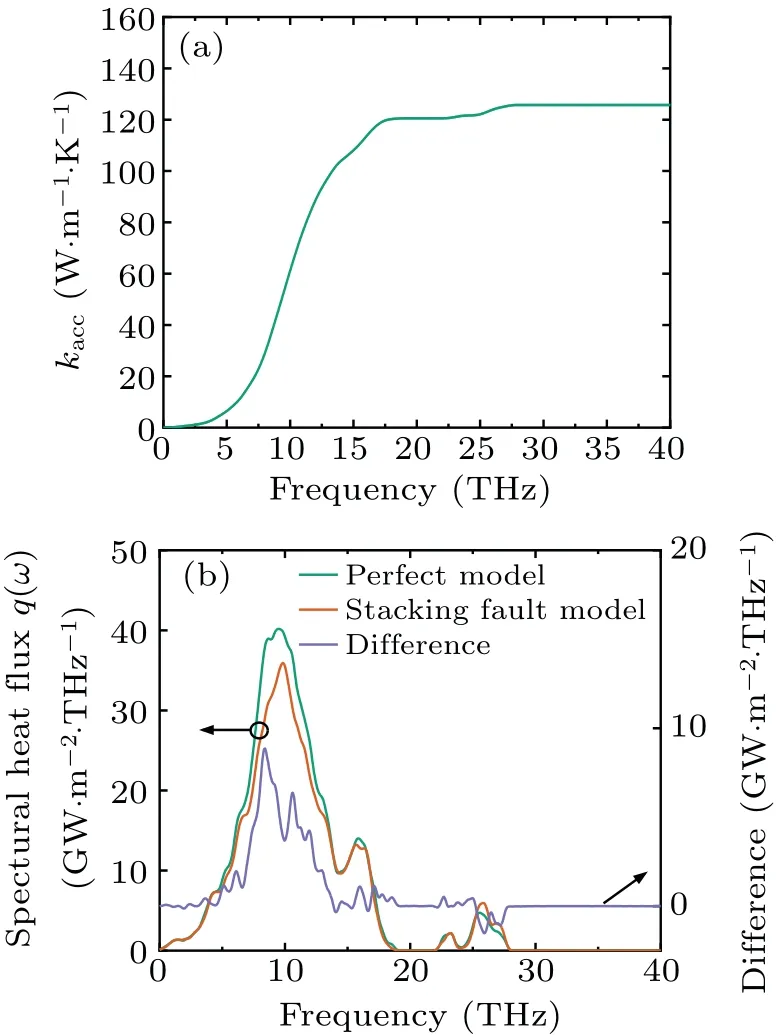
Fig.7.(a)The accumulated thermal conductivity of the perfect model with lz of 33.5 nm.(b)Spectral heat flux of the perfect model and SF model,the purple line denotes the difference([qperfect-qSF](ω))in the heat flux.
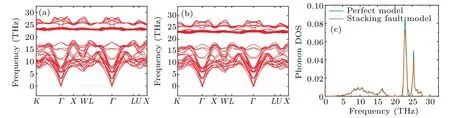
Fig.8.Phonon dispersions for both(a)perfect model and(b)SF models.(c)Phonon DOS of the perfect model and SF model.
3.4.Phonon properties
Although we can know that the phonon scattering by SF mainly ranged in the acoustic branches(nearby 10 THz)based on the above analysis of the spectral heat flux,the mechanism of the SF-phonon scattering is not yet clear.According to the phonon kinetic theory,[53]the thermal conductivity(k)can be expressed as
whereC(ω) is the spectral volumetric specific heat,vis the phonon group velocity in the corresponding direction of the thermal conduction, andτis the phonon lifetime.Based on the lattice dynamics simulation, we have calculated the specific heat capacity,group velocity,and phonon lifetime for the SF model and the perfect model.Figure 9 shows the spectral heat capacity of the SF model and the perfect model at 300 K.It can be seen that the spectral heat capacity of the acoustic branches is higher than that of the optical branches, which could be a cause of the major contribution of acoustic branches to the heat flux.In addition,the specific heat capacities of the SF model and perfect model are almost identical in the entire frequency range,which means that the isolated SF has almost no effect on specific heat capacity.Thus,the reduced thermal conductivity of the SF model could be attributed to the group velocity and lifetime of the phonon.

Fig.9.Spectral heat capacity of the perfect model and the SF model as functions of phonon frequency at 300 K.
In this work, we focus on the thermal conduction in the[¯111]direction ofβ-SiC(zdirection of simulation cells),i.e.,the direction perpendicular to the SF plane.Thus,only thezcomponent of the group velocity,as shown in Fig.10,can contribute to the thermal conductivity in thezdirection.It can be seen that thez-component of the group velocity of the acoustic branches is usually higher than that of the optical branches,which could be another cause of the major contribution of the acoustic branch phonon to the heat flux.Moreover, thezcomponent of the group velocity of the SF model is usually less than that of the perfect model in the frequency range of around 10 THz, which results in the prominent reduction of heat flux for the SF model.Incidentally,there is a decrease in other frequency ranges(e.g.,optical branch),but the phonons in these frequency ranges do not contribute much to the heat flux, so the corresponding spectral heat flux does not change much.

Fig.10.The z-component of phonon group velocities of the perfect model and SF model as functions of phonon frequency.
Figure 11 shows the calculated phonon lifetimes for the SF model and the perfect model at 300 K.The phonon lifetimes and the phonon scattering rates of the perfect model were also calculated by Wanget al.,[54]and their results are also in agreement with this work.It can be found from Fig.11 the phonon lifetimes of the SF model are lower than those of the perfect model in the low-frequency range.The SF-phonon scattering at the frequency range leads to reducing its phonon lifetime and then reducing the thermal conductivity.Therefore, the reduced phonon lifetime and the reduced group velocity are the reasons for the reduction of thermal conductivity by the stacking fault with respect to the perfect model.
4.Conclusion
In summary,the influence of the SF on the thermal transport of silicon carbide was investigated using nonequilibrium molecular dynamics,spectral heat flux method,and lattice dynamics.It was found that the SF reduced the thermal conductivity of silicon carbide.This is caused by the additional ITR which is difficult to capture by the common phenomenological models(e.g.,AMM and DMM).There exists a temperature drop and an extremely low ITR around the SF region.And the finite-size effects of the thermal conductivity as well as the ITR of isolated SF were discussed.The thermal conductivities of the SF model and the perfect model increase with the increase of the length of the models, which can be attributed to the phonon scattering near the heat bath.And the ITR of the SF decreases with the increase of the length of the model,which is attributed to the specular reflection of ballistic transport phonons at the SF plane.The acoustic phonons account for the major proportion of the heat flux and the SF mainly affects the phonon transport in the frequency range of 7.5 THz–12 THz.The major contribution of the acoustic phonons to the heat flux can be attributed to the higher specific heat capacity,group velocity in thezdirection,and lifetimes of the acoustic phonons.The reduction of group velocity and phonon lifetime in the frequency range around 10 THz is the main reason that the SF hinders phonon heat transport.These results provide a reference for material thermal management, device thermal design,and lattice thermal conductivity regulation.
Acknowledgements
Project supported by Sichuan Science and Technology Program (Grant No.2023NSFSC0044), the National Natural Science Foundation of China (Grant No.51501119), and the Fundamental Research Funds for the Central Universities.The authors acknowledge that this study was also partially supported by the High-Performance Computing Center at Sichuan University.
杂志排行

Chinese Physics B的其它文章
- Dynamic responses of an energy harvesting system based on piezoelectric and electromagnetic mechanisms under colored noise
- Intervention against information diffusion in static and temporal coupling networks
- Turing pattern selection for a plant–wrack model with cross-diffusion
- Quantum correlation enhanced bound of the information exclusion principle
- Floquet dynamical quantum phase transitions in transverse XY spin chains under periodic kickings
- Generalized uncertainty principle from long-range kernel effects:The case of the Hawking black hole temperature