Optimization of Insulin Rapid Amyloid Fibrosis Conditions
2023-09-22HUANGChenLIUYaojia刘耀嘉LIYimeng李依萌ZHANGKaiCHENXiangMAShutao马树涛LIZhenCHENTing
HUANG Chen(黄 晨), LIU Yaojia(刘耀嘉), LI Yimeng(李依萌), ZHANG Kai(张 凯), CHEN Xiang(陈 祥), MA Shutao(马树涛), LI Zhen (李 真), CHEN Ting(陈 婷)
College of Biological Science and Medical Engineering, Donghua University, Shanghai 201620, China
Abstract:Amyloid fibers are now considered as one of the possible therapeutic targets of neurodegenerative diseases due to their unique physicochemical properties and toxicity. To efficiently trace in real time how the drug inhibits protein amyloid fibrosis, it is necessary to study the conditions for rapid amyloid fibrosis. Insulin is selected as the model protein in vitro to explore the process of amyloid formation. The effects of the molar concentration of NaCl, pH and reaction temperature in the single-factor experiment are discussed and the response surface analysis is carried out. Amyloid fibrosis is labeled by Thioflavin-T (ThT). The optimal molar concentration of NaCl, pH and reaction temperature for insulin rapid amyloid fibrosis are 50.0 mmol/L, 2.02 and 54℃, respectively. With the addition of 0.1 mmol/L phenol, the half-time of insulin amyloid fibrosis is shortened from 5.4 h to 1.7 h. The insulin rapid amyloid fibrosis system provides a new approach for screening the protein amyloid fibrosis inhibitors.
Key words:amyloid fibrosis; response surface analysis; insulin; model protein
0 Introduction
The physiological function of proteins is related to their three-dimensional structures formed accurately in cells. The process of guiding the formation of three-dimensional structures is called protein folding[1]. The hydrophobicβ-lamella which can be dyed by iodine-like starch, is called the amyloid fiber, and its formation process is called protein amyloid fibrosis[2-3].
At present, many neurodegenerative diseases,e.g.Alzheimer’s disease, are caused by the physiologically toxic fibers or aggregates which come from the protein amyloid fibrosis[4-5]. Aggregates or mature fibers generated by protein amyloid fibrosis can gather on the cell membrane, which promotes the formation of mature fibers or aggregates, thereby destroying the stability of the cell membrane, leading to cell disruption or death, or activating the apoptosis pathway, inducing the cell apoptosis[6]. Amyloid fibrosis is a common property of proteins[7]. Theoretically, all proteins can develop amyloid fibrosis under specific conditions. Protein amyloid fibrosis has a common aggregation process that involves spontaneous nucleation, aggregation of fibrils precursor, and eventually growth into mature fibers. In addition, fibers or aggregates formed by different proteins or polypeptides have common characteristics, such as containing a large number ofβ-lamellae and straight-chain fiber structures and possessing special physical and chemical properties[8-10].
Insulin can also form amyloid fibers under certain conditions. At high concentrations, insulin is stored as a hexamer. While at low concentrations, the insulin is dissociated into monomers which play physiological activities. Insulin is prone to fibrosis through the dissociation of hexamers into monomers and is thought to be the protein that forms amyloid fibers easiest[11-12]. It is often used as a model protein to study the process of protein amyloid fibrosis[13].
It has been reported that both polar and non-polar functional groups of formamide and its methyl derivatives contribute to the denaturation of globular proteins[14]. The polar functional group (amide) solvates the polypeptide skeleton, while the non-polar functional group (the methyl group in amide) stabilizes the externally exposed hydrophobic residues. Studies have pointed out that the low concentration of phenol has a promoting effect on insulin fibrosis[15]. Therefore,N,N-dimethylformamide (DMF) and phenol were selected as additives for condition optimization.
Thioflavin-T (ThT) has been widely used to detect amyloid fibers[16]. ThT bound to amyloid fibers generates a new excitation peak at 450 nm and the emission peak at 482 nm is enhanced. ThT is thought to interact with amyloid fibers relatively specifically and rapidly, and the binding is independent of the primary structure of the protein[17]. Thus ThT can be used as an effective amyloid fiber detection tool.
At present, it has been reported that insulin is prone to form amyloid aggregates under low pH and high temperature conditions, and the formation of amyloid aggregates is inhibited by high ionic strengths. Besides, mechanical disturbance in the process of insulin fiber formation can accelerate the formation of insulin fibers[18]. In addition, the use of appropriate concentrations of anionic surfactant sodium dodecyl benzene sulfonate(SDBS) has been reported to promote insulin fibrosis[19]. Besides using insulin itself for research, using synthetic short peptides to simulate the process of insulin fibrosis has become a new way of research[20].
In this study, ThT is used as a fluorescent dye to detect insulin amyloid fibers. The molar concentration of NaCl, the environmental pH and the reaction temperature are selected as three factors to conduct a single response factor experiment of insulin fibrosis, and then the half-time of insulin fibrosis is measured to reflect the rate of insulin fibrosis. The Box-Behnken design (BBD) model is used for response surface designs and analyses to optimize the conditions of insulin amyloid fibrosis.
1 Instruments and Materials
1.1 Instruments
A fluorescence spectrophotometer RF-2000 (Shimadzu (Shanghai) Global Laboratory Consumables Co., Ltd., China) was used to detect the emission fluorescence intensity of the samples.
1.2 Materials
Zinc-deficient porcine insulin was prepared in the laboratory. ThT and Tris were obtained from Sangon Biotech (Shanghai) Co., Ltd., China. Sodium chloride (NaCl) was purchased from Shanghai Lingfeng Chemical Reagent Co., Ltd., Shanghai, China. Hydrogen chloride (HCl), disodium hydrogen phosphate dehydrate and phenol were purchased from Sinopharm Chemical Reagent Co., Ltd., Beijing, China.
2 Methods
2.1 Preparation of insulin fibrils
An appropriate amount of zinc-deficient porcine insulin was dissolved in HCl solution (pH 2.00). The insulin solutions with different concentrations were prepared. The insulin solution (500 μL) was pipetted into a tube and incubated in the water bath at 60 ℃. After incubation, the sample was stored on ice temporarily.
2.2 Fluorescence detection of ThT
Tris-HCl buffer solution (2 870 μL, 10.0 mmol/L, pH 8.00) was pipetted into a 15 mL centrifuge tube, and then the insulin fibrils sample (100 μL) and ThT (30 μL, 1.0 mmol/L) were added. It was fully shaken for 10 s to mix the solution evenly. The well-mixed liquid was pipetted into a cuvette and it was set in the fluorescence spectrophotometer to detect the emission fluorescence intensity. The excitation wavelength and the emission wavelength were set as 440 nm and 487 nm, respectively. Partial fluorescence intensity was normalized on a scale of 0 to 1. The ThT fluorescence intensity was plotted as a function of time and fitted to a sigmoidal curve by using the same approach as that in Nielsen’s research[21].
2.3 Tests exploring the effect of the molar concentration of NaCl on insulin fibrosis
HCl solutions (pH 2.00) containing 0, 25.0, 50.0, 75.0 and 100.0 mmol/L NaCl respectively were prepared. An appropriate amount of zinc-deficient porcine insulin was dissolved in the above solutions, and the mass concentration of insulin in each solution was 1.0 mg/mL. Then they were incubated in the water bath at 60 ℃ for 24 h, and sampled once per hour for fluorescence detection.
2.4 Tests exploring the effect of pH on insulin fibrosis
HCl solutions with pH of 1.50, 2.00, 2.50 and 3.00 were prepared respectively. An appropriate amount of the zinc-deficient porcine insulin was dissolved in the above solutions, and the mass concentration of insulin in each solution was 1.0 mg/mL. Then they were incubated in the water bath at 60 ℃ for 24 h, and sampled once per hour for fluorescence detection.
2.5 Tests exploring the effect of temperature on insulin fibrosis
An appropriate amount of zinc-deficient porcine insulin was dissolved in HCl solution (pH 2.00), and the mass concentration of insulin in each solution was 1.0 mg/mL. The insulin solution (500 μL) was pipetted into the 1.5 mL microcentrifuge tube and then incubated in the water bath at 30, 40, 50 and 60 ℃ respectively for 24 h, and sampled once per hour for fluorescence detection.
2.6 Method of data processing
Based on the results of the single-factor tests, the BBD model was used to design and analyze the response surface. The half-time of insulin fibrosis was considered as the response value[22]and the reaction system was optimized.
2.7 Tests exploring the effect of DMF and phenol on insulin
After the optimal conditions of insulin fibrosis were obtained by the analysis of the response surface, DMF and phenol with the same molar concentration (0.1 mmol/L) were respectively added into the insulin fibrosis reaction system. The systems were incubated for 24 h, and sampled once per hour for fluorescence detection[23].
3 Results
3.1 Relation between insulin concentration and insulin fibrosis
As shown in Fig.1(a), from the growth curves of insulin fibers incubated in HCl solution (pH 2.00) at 60 ℃ with different initial insulin mass concentrations, it can be found that the growth of insulin fibers follows a specific S-type kinetic pattern. The insulin samples with mass concentrations of 1.0 mg/mL and 2.0 mg/mL have a fast progression of fibrosis (Fig.1(b)). In order to save cost and achieve rapid fibrosis, 1.0 mg/mL insulin solution was used in subsequent experiments. There is a high linear correlation between the initial insulin mass concentrationxand fluorescence intensityywhen the insulin fibrotic reaction enters the plateau phase (Fig.1(c)). The fitted regression equation isy=175 188.64x+ 37 609.52 (R2=0.99). Therefore, it can be considered that ThT fluorescence intensity is linearly correlated with the mass concentration of insulin, and the higher the mass concentration of insulin, the more insulin fibers.

Fig.1 Effects of various insulin mass concentration on insulin fibrosis:(a) growth curve of insulin fiber; (b) half-time of fibrosis at each insulin mass concentration; (c) relationship between initial insulin mass concentration and fluorescence intensity of the sample in the plateau phase
3.2 Effect of ionic strength on insulin fibrosis
Improving the ionic strength of the solution can increase the amount of electric charge on the surface of the insulin molecule and enhance the stability of the insulin molecule in the solution. Therefore, the increase in the ionic strength may change the rate of insulin fibrosis reaction. We explored the effect of the ionic strength on the half-time of fibrosis by changing the NaCl molar concentration in the range of 0-100.0 mmol/L in the insulin fibrotic reaction system. The effect of the molar concentration of NaCl on the half-time of fibrosis is shown in Table 1. When the molar concentration of NaCl was 0-50.0 mmol/L, the half-time of the insulin fibrosis decreased with the increase in the molar concentration of NaCl because NaCl was conducive to the nucleation process, thus promoting insulin fiber formation[24]. When the molar concentration of NaCl was over 50.0 mmol/L, the electrostatic interactions were shielded, which inhibited the elongation of the fibril, resulting in a longer half-time of insulin fibrosis[25-26].
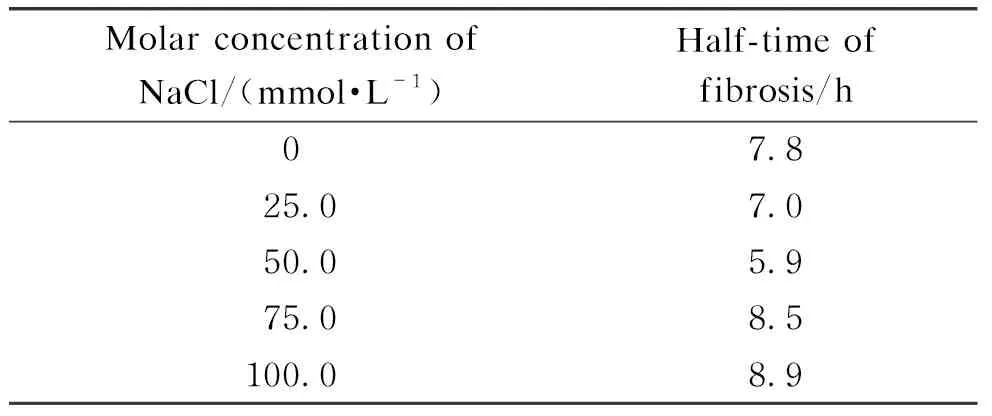
Table 1 Effect of the molar concentration of NaCl on half-time of fibrosis
3.3 Efffect of pH on insulin fibrosis
The oligomerization of insulin is greatly affected by pH. Therefore, pH is closely related to the rates of fibrosis reactions. The pH of the reaction system from 1.50 to 3.00 was selected to explore the effect of pH on the half-time of fibrosis. As shown in Table 2, the change in pH can also affect the half-time of fibrosis.

Table 2 Effect of pH on half-time of fibrosis
When pH was 2.00, the half-time of fibrosis was the shortest, which was 8.5 h, while the half-time of fibrosis was 15.1 h when pH was 1.50. It seems that the half-time of fibrosis is not linearly correlated with pH. When pH was 3.00, the fluorescence intensity was low, indicating that the insulin fibers were still in the growth phase. Thus, the half-time of fibrosis at pH 3.00 was not obtained.
3.4 Effect of temperature on insulin fibrosis
Insulin fibrosis is a spontaneous dynamic process, and the change in reaction temperature has a great influence on the reaction rate. Therefore, we incubated insulin samples in the water bath at 30-60 ℃ to explore the effect of temperature on the half-time of fibrosis. As shown in Table 3, the half-time of fibrosis decreased with the increase of the reaction temperature.
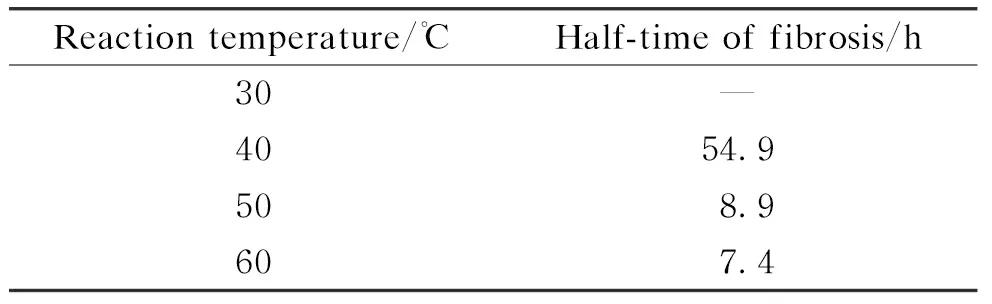
Table 3 Effect of temperature on half-time of fibrosis
When the reaction temperature was 30 ℃, no insulin fiber was detected during the 48 h experiment, indicating that the process of insulin fibrosis was in the lag phase.
So, the half-time of fibrosis at 30 ℃ was not obtained. When the reaction temperature was 60 ℃, the half-time of fibrosis was the shortest, showing that the fibrotic growth was fastest at 60 ℃, and the conditions were more suitable for the fibrosis. In conclusion, the higher reaction temperature is beneficial to accelerate the process of insulin fibrosis. When the reaction temperature increases, insulin in the system mainly exists in the form of a monomer, which may increase the rate of insulin denaturation and make its hydrophobic region expose faster, thus significantly accelerating the formation rate of fibrosis.
3.5 Analysis of response surface on insulin fibrosis
According to the above experimental results, the experimental design of three factors and three levels was carried out. The design is shown in Table 4.
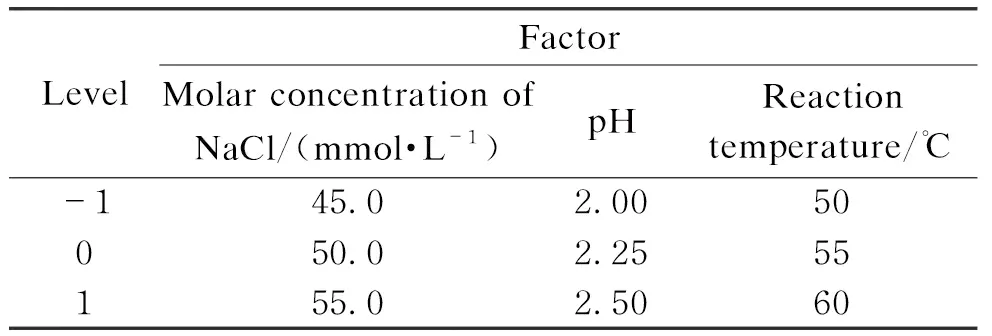
Table 4 Experimental design of three factors and three levels
Through the analysis software of Expert Design 13, the optimal combination of experimental conditions was 50.0 mmol/L NaCl, pH 2.02, 54 ℃, under which the half-time of fibrosis was 5.4 h. Through the analysis of response surface design software, the contour map and 3D stereogram were obtained, which could reflect the interaction of every single factor on the half-time of insulin fibrosis intuitively. The rounder the contour shape, the weaker the interaction. The steeper the slope of the 3D response surface, the greater the interaction. When the color becomes darker (blue), the interaction is more obvious[27]. According to the slope and the color depth in Fig.2, the interaction between the molar concentration of NaCl and the reaction temperature is the most obvious.
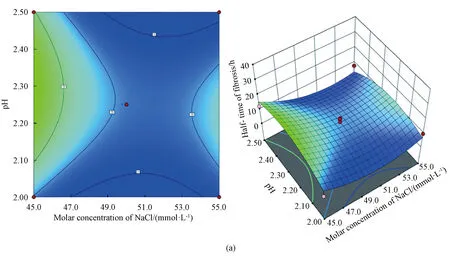
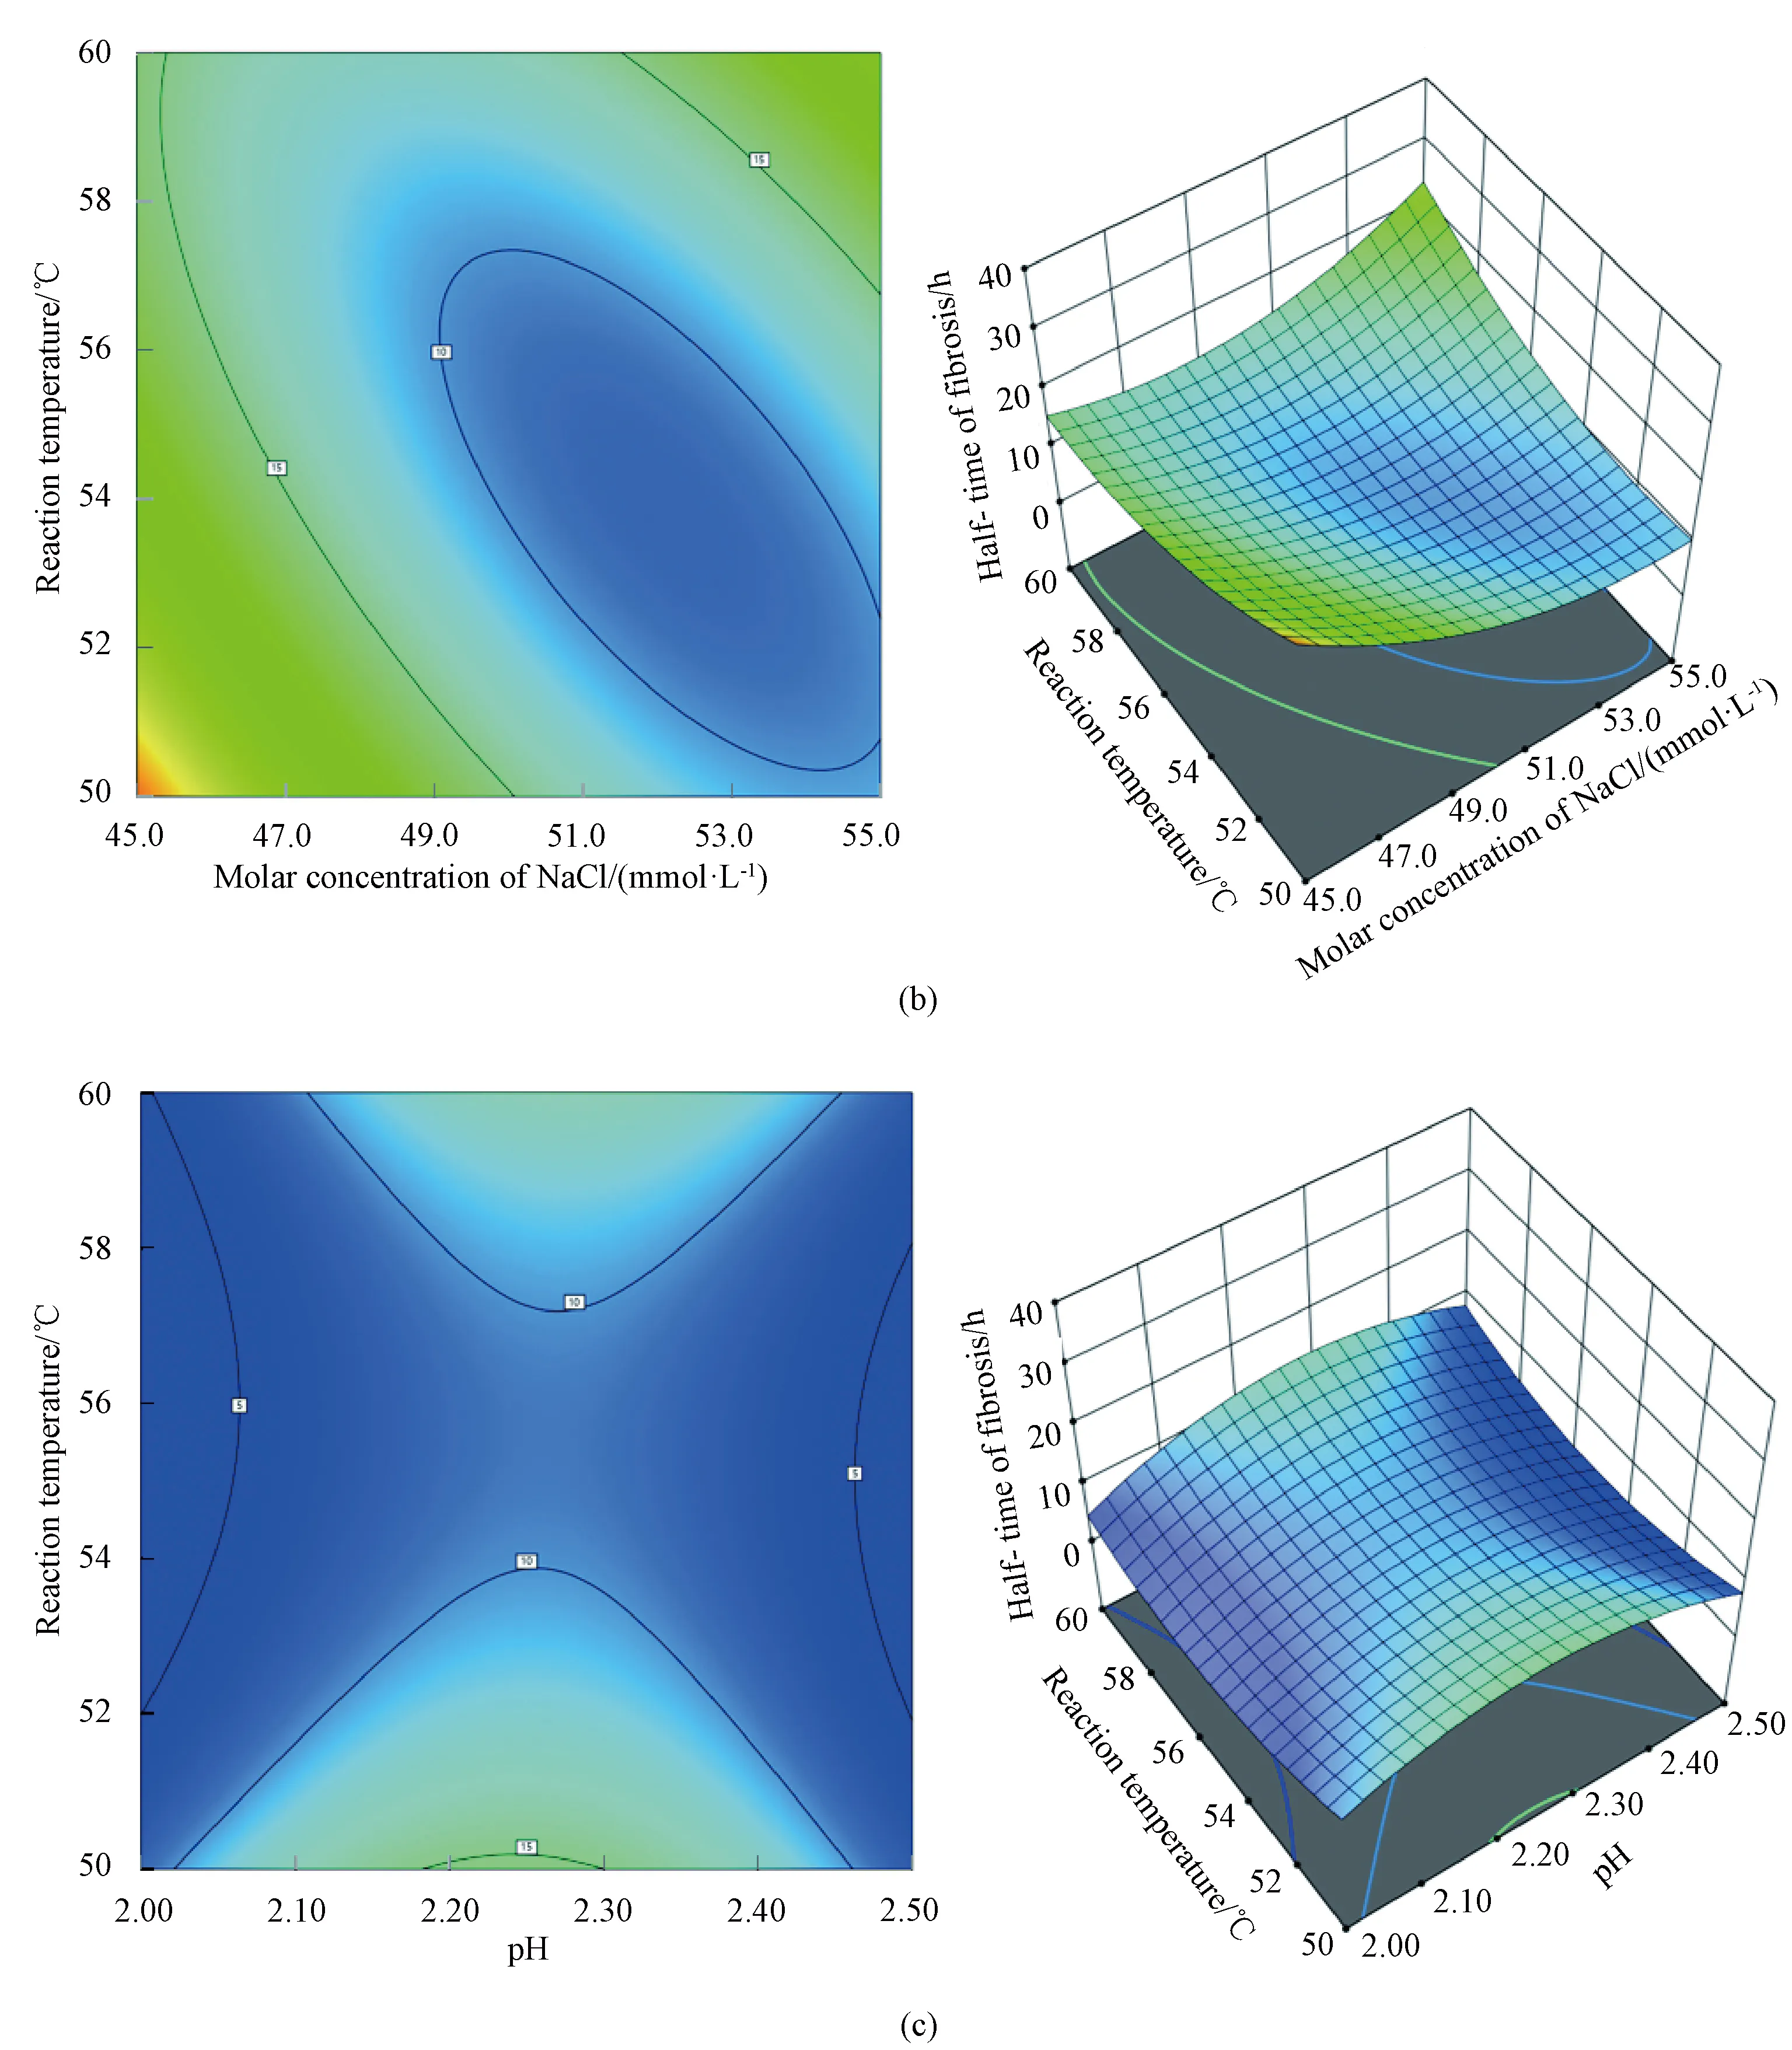
Fig.2 Interaction of two factors:(a) molar concentration of NaCl and pH; (b) molar concentration of NaCl and reaction temperature; (c) pH and reaction temperature
3.6 Effects of DMF and phenol on insulin fibrosis
In order to improve the efficiency of the model testing and obtain the half-time of insulin fibrosis more quickly, organic small molecules were added to the system described above. The results showed that when 0.1 mmol/L DMF was added, the half-time of fibrosis was 15.3 h (Fig.3(a)); when 0.1 mmol/L phenol was added, the half-time of fibrosis was only 1.7 h(Fig.3(b)). The half-time of fibrosis was 10.0 h when 0.1 mmol/L DMF and 0.1 mmol/L phenol were both added (Fig.3(c)). It can be concluded that 0.1 mmol/L phenol can significantly promote insulin fibrosis. The specific reasons are speculated as follows.
The B11-B17 residues of two insulin monomers cross each other to form aβ-lamellar structure constituting the skeleton of mature insulin fibers, which is the key step before nucleation[28]. However, the high concentration of DMF can keep the B11-B17 residues in theα-helix during the degeneration of insulin monomer due to a large number of substituted methyl groups[22]. Compared with insulin in an aqueous solution, it takes more time to destroy the structure of the B11-B17 region, which leads to an increase in the half-time of fibrosis. It is speculated that phenol can make protein denaturation at low concentrations so that the hydrophobic region of insulin is exposed, which makes insulin fibrosis easier[15]. When phenol and DMF were mixed, the concentration of organic solvent in the system increased and the effect on insulin denaturation increased. However, due to the methyl substitution of DMF, the half-time of insulin fibrosis was still higher than that in the simple aqueous solution.
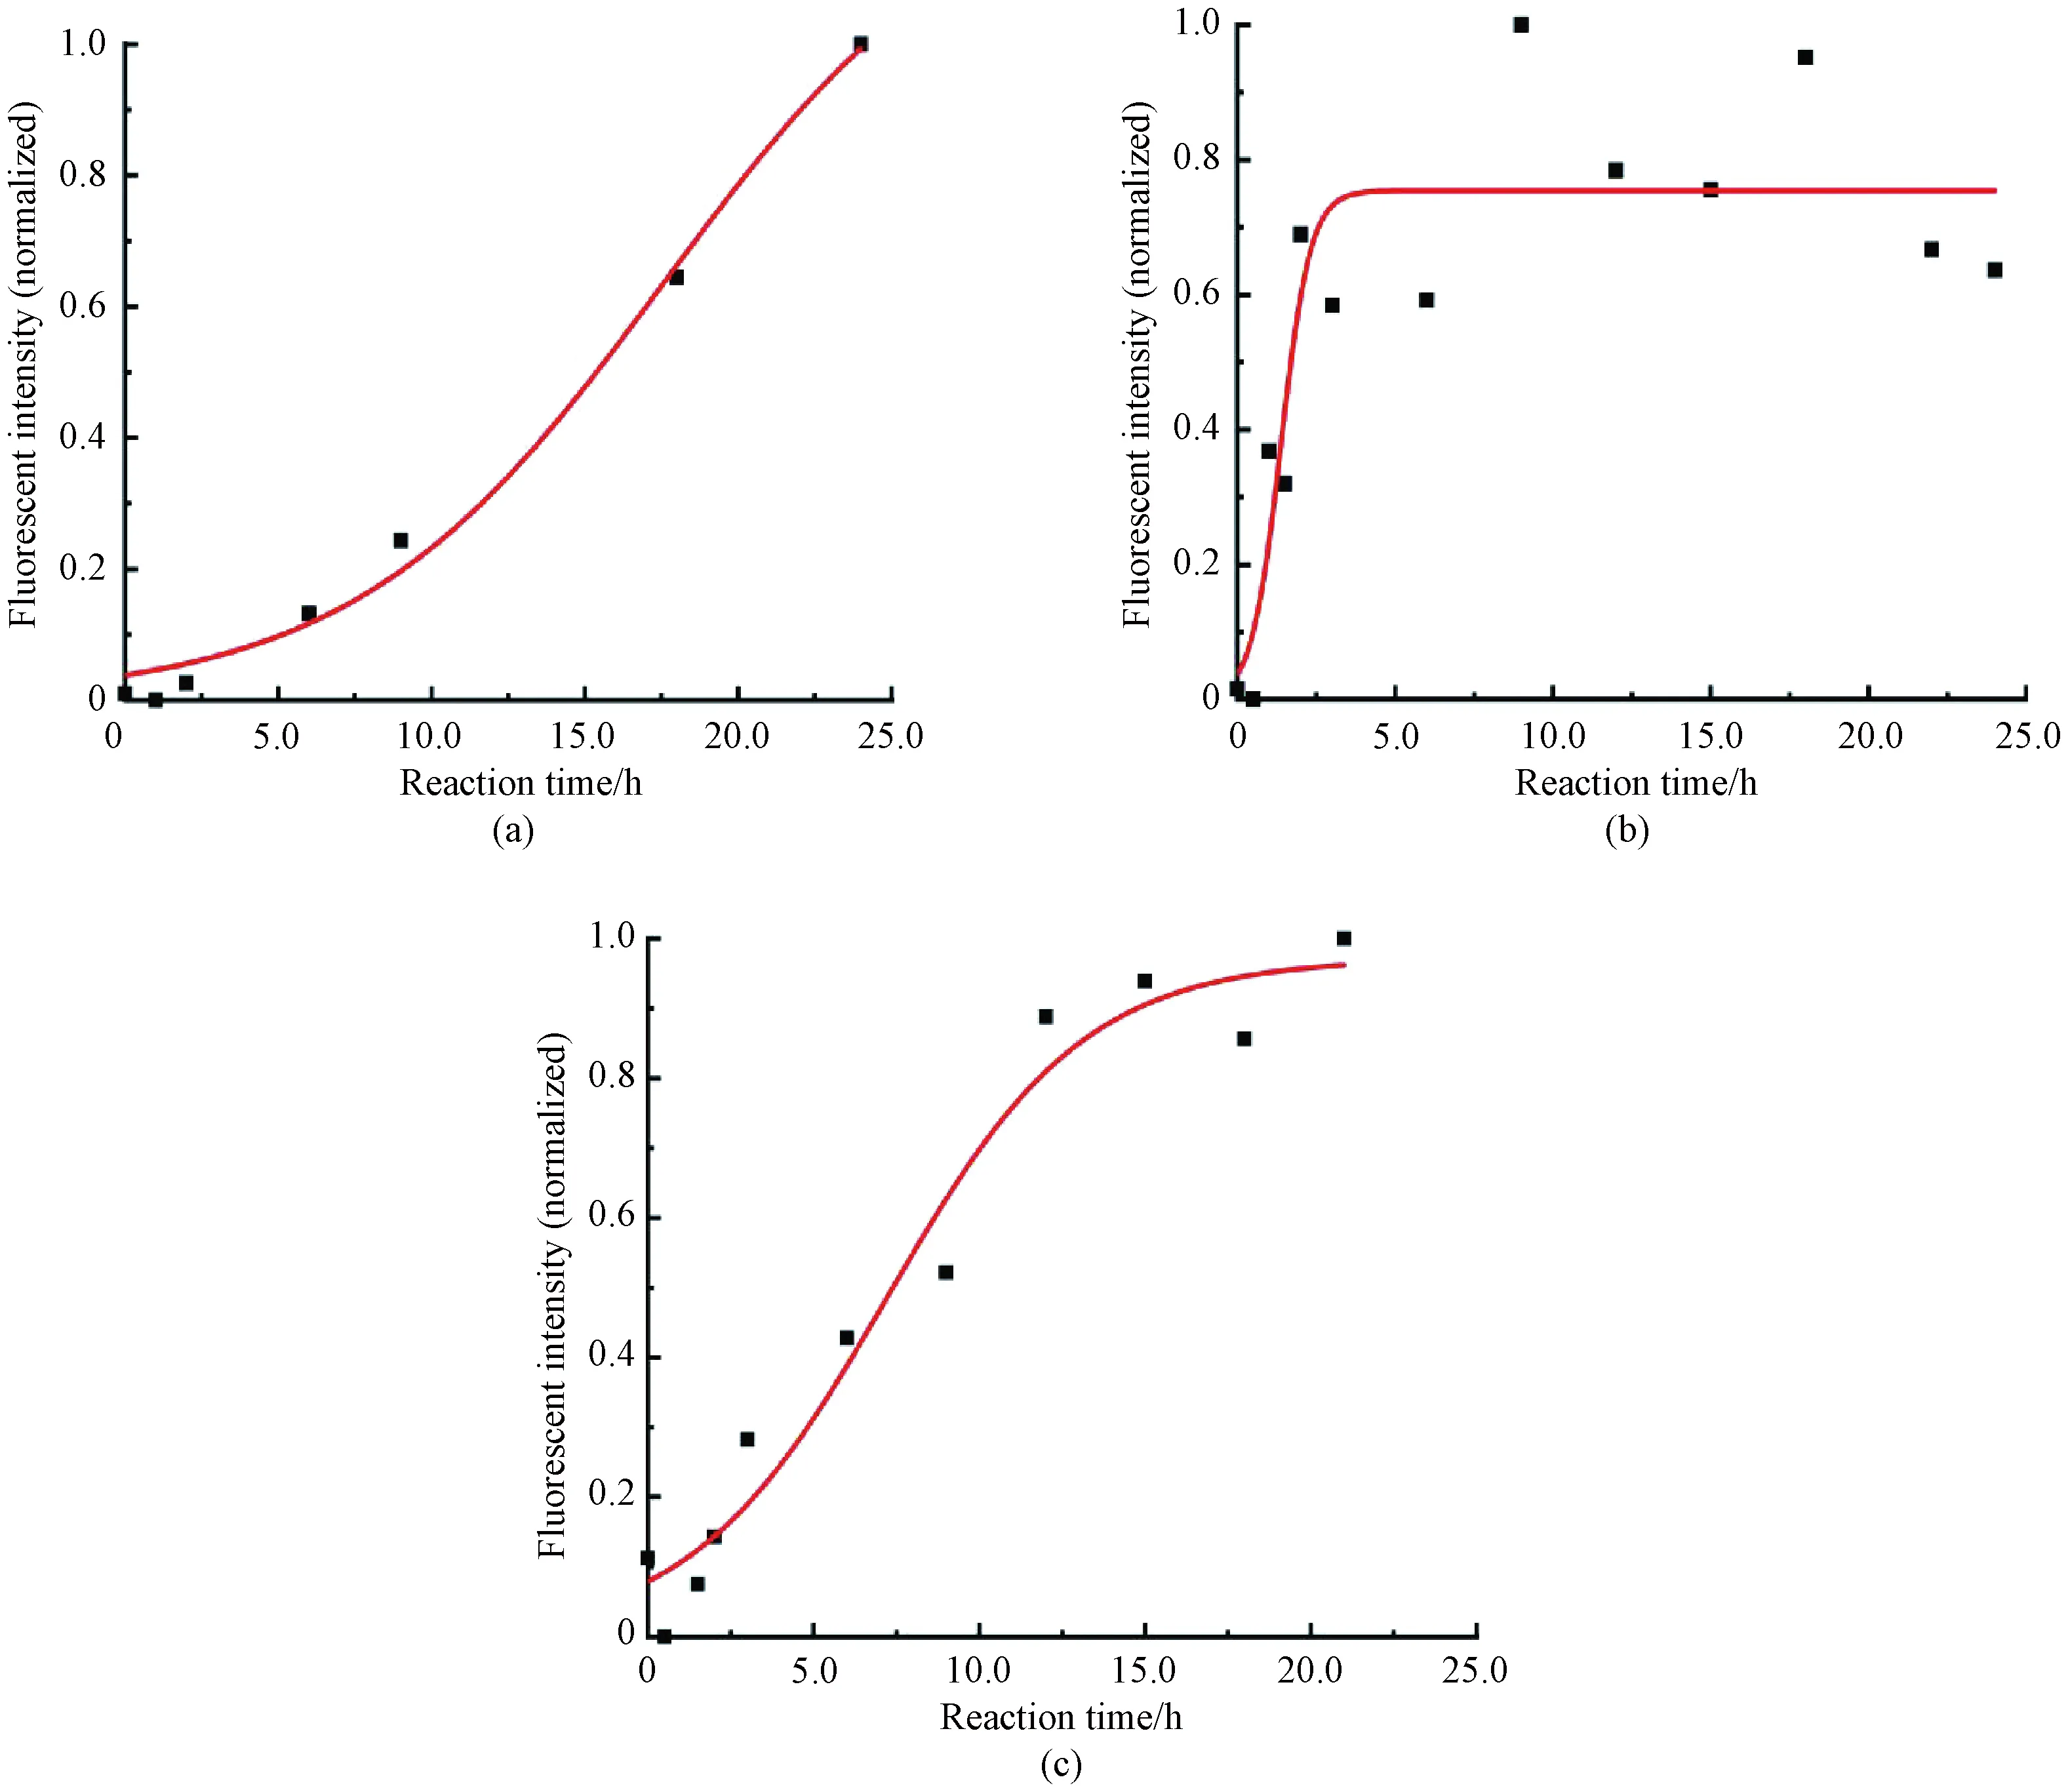
Fig.3 Fibrosis curves of insulin with different small organic molecules:(a) 0.1 mmol/L DMF; (b) 0.1 mmol/L phenol; (c) 0.1 mmol/L DMF and 0.1 mmol/L phenol
In conclusion, the optimal conditions for insulin fibrosis were as follows:the molar concentration of NaCl was 50.0 mmol/L (NaCl), pH was 2.02, the reaction temperature was 54 ℃, and the molar concentration of phenol was 0.1 mmol/L. Under this condition, the half-time of insulin fibrosis was 1.7 h, which was significantly shorter than that of normal insulin fibrosis.
4 Conclusions
According to previous studies, we used ThT as a fluorescent dye to establish an insulin rapid amyloid fibrosis system. Through the analysis of the response surface, we found the optimal reaction conditions. The optimal molar concentration of NaCl, pH and reaction temperature were 50.0 mmol/L, 2.02 and 54 ℃, respectively. Under this condition, the half-time of fibrosis was 5.4 h. The effects of DMF and phenol on the half-time of insulin fibrosis were compared. The addition of phenol shortened the half-time of insulin fibrosis to 1.7 h while the addition of DMF prolonged the half-time of insulin fibrosis. This system we proposed is convenient to screen the drugs for insulin amyloid fibrosis, and it is also a model to study the process of amyloid fibrosis.
杂志排行

Journal of Donghua University(English Edition)的其它文章
- Image Retrieval with Text Manipulation by Local Feature Modification
- Multi-style Chord Music Generation Based on Artificial Neural Network
- Polypyrrole-Coated Zein/Epoxy Ultrafine Fiber Mats for Electromagnetic Interference Shielding
- Design of Rehabilitation Training Device for Finger-Tapping Movement Based on Trajectory Extraction Experiment
- High-Efficiency Rectifier for Wireless Energy Harvesting Based on Double Branch Structure
- Review on Development of Pressure Injury Prevention Fabric