NuSTAR View of the R-Γ Correlation in the Hard State of Black Hole Lowmass X-Ray Binaries
2023-09-03YantingDongZhuLiuandXinwuCao
Yanting Dong ,Zhu Liu ,and Xinwu Cao
1 Institute for astronomy,Zhejiang Institute of Modern Physics,Department of Physics,Zhejiang University,Hangzhou 310027,China;ytd@zju.edu.cn,xwcao@zju.edu.cn
2 Max Planck Institute for Extraterrestrial Physics,Giessenbachstrasse 1,D-85748,Garching,Germany
Abstract The power law and reflection emission have been observed in the X-ray spectra of both black hole X-ray binaries(BHXRBs) and active galactic nuclei (AGNs),indicating a common physical origin of the X-ray emission from these two types of sources.The relevant parameters describing the shape of both components and the potential correlation between these parameters can provide important clues on the geometric and physical properties of the disk and the corona in these sources.In this work,we present a positive correlation between the photon index Γ and the reflection strength R for the low-mass BHXRBs in the hard state by modeling NuSTAR data,which is qualitatively consistent with the previous studies.We compare our results with the predictions from different theoretical disk-corona models.We show that the R-Γ correlation found in this work seems to favor the moving corona model proposed by Beloborodov.Our results indicate that the coronal geometry varies significantly among BHXRBs.We further compare our results with that of AGNs.We find that the reflection strength R is smaller than unity in the hard state of BHXRBs,while it can be as large as~5 in AGNs,which implies that the variations of the disk-coronal geometry of AGNs are more vigorous than that of the BHXRBs in the hard state.
Key words: accretion–accretion disks–black hole physics–X-rays: binaries
1.Introduction
Black hole X-ray binaries (BHXRBs) and active galactic nuclei(AGNs)are powered by the accretion of matter onto the central stellar-mass black holes and supermassive black holes,respectively.The accretion matter forms a disk around the black hole and liberates the gravitational energy,which is radiated in the form of electromagnetic waves (mostly thermal emission if the mass accretion rate is not very low,Shakura &Sunyaev 1973).The thermal emission from the disk is mainly in the optical and UV bands for AGNs and in the X-ray band for BHXRBs.In addition,a non-thermal component,which cannot be produced in thermal accretion disk accreting at≿0.01 Eddington scaled rate (Meyer et al.2000b;Maccarone 2003;Dexter et al.2021),is also observed in both AGNs and BHXRBs.It is widely believed that the soft photons can be inverse Compton scattered in a region of hot electrons around the compact object,namely the corona,in BHXRBs and AGNs,which produces the non-thermal primary hard X-ray emission(e.g.,Galeev et al.1979;Haardt &Maraschi 1991,1993;Cao 2009;You et al.2012).However,the geometry of the corona is still under debate both observationally and theoretically(e.g.,Dauser et al.2013;Liu&Qiao 2022;Yang et al.2022).It has been proposed that the corona could be a radiatively inefficient hot accretion flow at the innermost region of the disk(Esin et al.1997;Poutanen et al.2018),a slab of hot plasma over the disk (Petrucci et al.2001;Wilkins &Fabian 2012),a compact hot plasma above the black hole (Miller et al.2013;Ghosh &Laha 2021),or even the base of jet (Markoff et al.2003;Shidatsu et al.2011;Wang et al.2021).The geometry of the corona could also change (e.g.,Kara et al.2019;Méndez et al.2022) during outburst.
Except for the thermal emission and primary X-ray emission,a reflection component has also been observed in both stellar and supermassive black hole accretion systems,which is produced by the illumination of the cold material by the primary X-ray emission,including the fluorescent emission lines and a hump in~20–40 keV energy range (Fabian et al.1989;Young et al.1999;Ross &Fabian 2005;García et al.2020).The reflected emission produced at a region close to the black hole may also be affected by relativistic effects(Laor 1991;Fabian et al.2000;Reynolds &Nowak 2003;Dauser et al.2012).
Generally speaking,the primary X-ray emission can be well described by a power law with a photon index Γ.A cutoff at the high energy band has also been reported in some sources with high-quality broad-band X-ray data(Fabian et al.2015;Molina et al.2019;Dong et al.2022).The reflection strengthR(R=Ω/2π,Ω is the solid angle covered by the reflector viewed from the corona) represents the fraction of the primary X-ray photons intercepted by the disk.Despite the great achievements in understanding the accretion processes from the study of BHXRBs,some fundamental questions have still remained unanswered.For instance,the evolution of the inner region of the accretion disk(e.g.,Plant et al.2014;Stiele &Kong 2017;Connors et al.2022),the geometric and physical properties of the corona (e.g.,Malzac et al.2001;Wilkins et al.2014;You et al.2021;Barua et al.2022;Méndez et al.2022),or the physical process triggering the accretion state transition (e.g.,Meyer et al.2000a;Dong et al.2022;Liu et al.2022).These questions can be investigated by the study of the evolution of specific parameters,e.g.,the inner radius of the accretion disk,electron temperature,and optical depth of the corona,or the correlations between these parameters,e.g.,Γ andR(Zdziarski et al.1999;Malzac et al.2001;Molina et al.2009;Zappacosta et al.2018;Ezhikode et al.2020),Γ and Eddington scaled luminosity (Shemmer et al.2006;Wu &Gu 2008;Gu &Cao 2009;Brightman et al.2013;Yan et al.2020),inner radius and Eddington scaled luminosity (Allured et al.2013;García et al.2015;Chainakun et al.2021).
In this work,we investigate the correlation between the photon index Γ and reflection strengthRin the hard state of a sample of stellar-mass black hole systems by modeling their Nuclear Spectroscopic Telescope Array (NuSTAR,Harrison et al.2013) energy spectra and compare the correlation in BHXRBs with that in AGNs(Panagiotou&Walter 2019;Kang et al.2020;Hinkle &Mushotzky 2021).The correlation between Γ andRwas first found to be positive for the BHXRB GX 339-4 by fitting spectra using Ginga observations (Ueda et al.1994).Zdziarski et al.(1999) presented a similar correlation using a larger Ginga sample,including Seyfert AGNs,BHXRBs,and weakly magnetized neutron stars.TheR-Γ correlation was also investigated using RXTE/PCA for the BHXRBs GX 339-4 and Cyg X-1 (Revnivtsev et al.2001;Gilfanov et al.1999).A positiveR-Γ correlation has only been reported for X-ray binaries in the hard state,for instance,in Cyg X-1,GX 339-4,GS1354-64,Nova Muscae and GRS 1915+105 (Gilfanov et al.2000;Rau &Greiner 2003;Zdziarski et al.2003).
NuSTAR covers the broad bandpass of 3-79 keV and has unprecedented sensitivity above 10 keV,making NuSTAR ideal for studies of the disk reflection and the primary emission(Diaz et al.2020;Draghis et al.2020;Connors et al.2021).Therefore,the launch of NuSTAR provided a new opportunity to studyR-Γ correlation.Using NuSTAR data,theR-Γ correlation has been recently confirmed for Seyfert galaxies(Ezhikode et al.2020;Panagiotou &Walter 2020) and radio galaxies (Kang et al.2020).Based on the disk-corona model,in which the hot electrons in the corona are cooled by the soft photons from the cold disk (Haardt &Maraschi 1993),this correlation might be caused by the perpendicular movement of the corona with respect to the black hole (Beloborodov 1999).If the corona is assumed to be moving away from the disk,both reflection and irradiation toward the disk are reduced while the reduction of the soft photons into the corona leads to the harder primary emission (a smaller photon index),and vice versa.In Qiao &Liu (2017),they proposed that this observed correlation found in Seyfert galaxies can be roughly explained within the framework of the condensation of the hot corona onto the cold accretion disk with the movement of the inner radius of the disk.
In this paper,we present the sample of BHXRBs and AGNs in Section 2.Section 3 gives the spectral analysis.We present the best-fitting results and discussions in Section 4.Summaries are shown in Section 5.
2.Sample
We studied the NuSTAR energy spectra of the BHXRBs presented in Yan et al.(2020).Their sample includes 17 LMXRBs with 165 NuSTAR observations.The data were downloaded from HEASARC.3https://heasarc.gsfc.nasa.gov/cgi-bin/W3Browse/w3browse.plThey performed data reduction using NUPIPELINE,a task of the NUSTARDAS included in the HEAsoft 6.25,with calibration files of version 20181030.Further,the source and background spectra were generated using NUPRODUCTS.The spectra were extracted from a circular region within 90″ at the source position.The background spectra were extracted from an annulus region with inner and outer radii of 180″ and 200″,respectively.
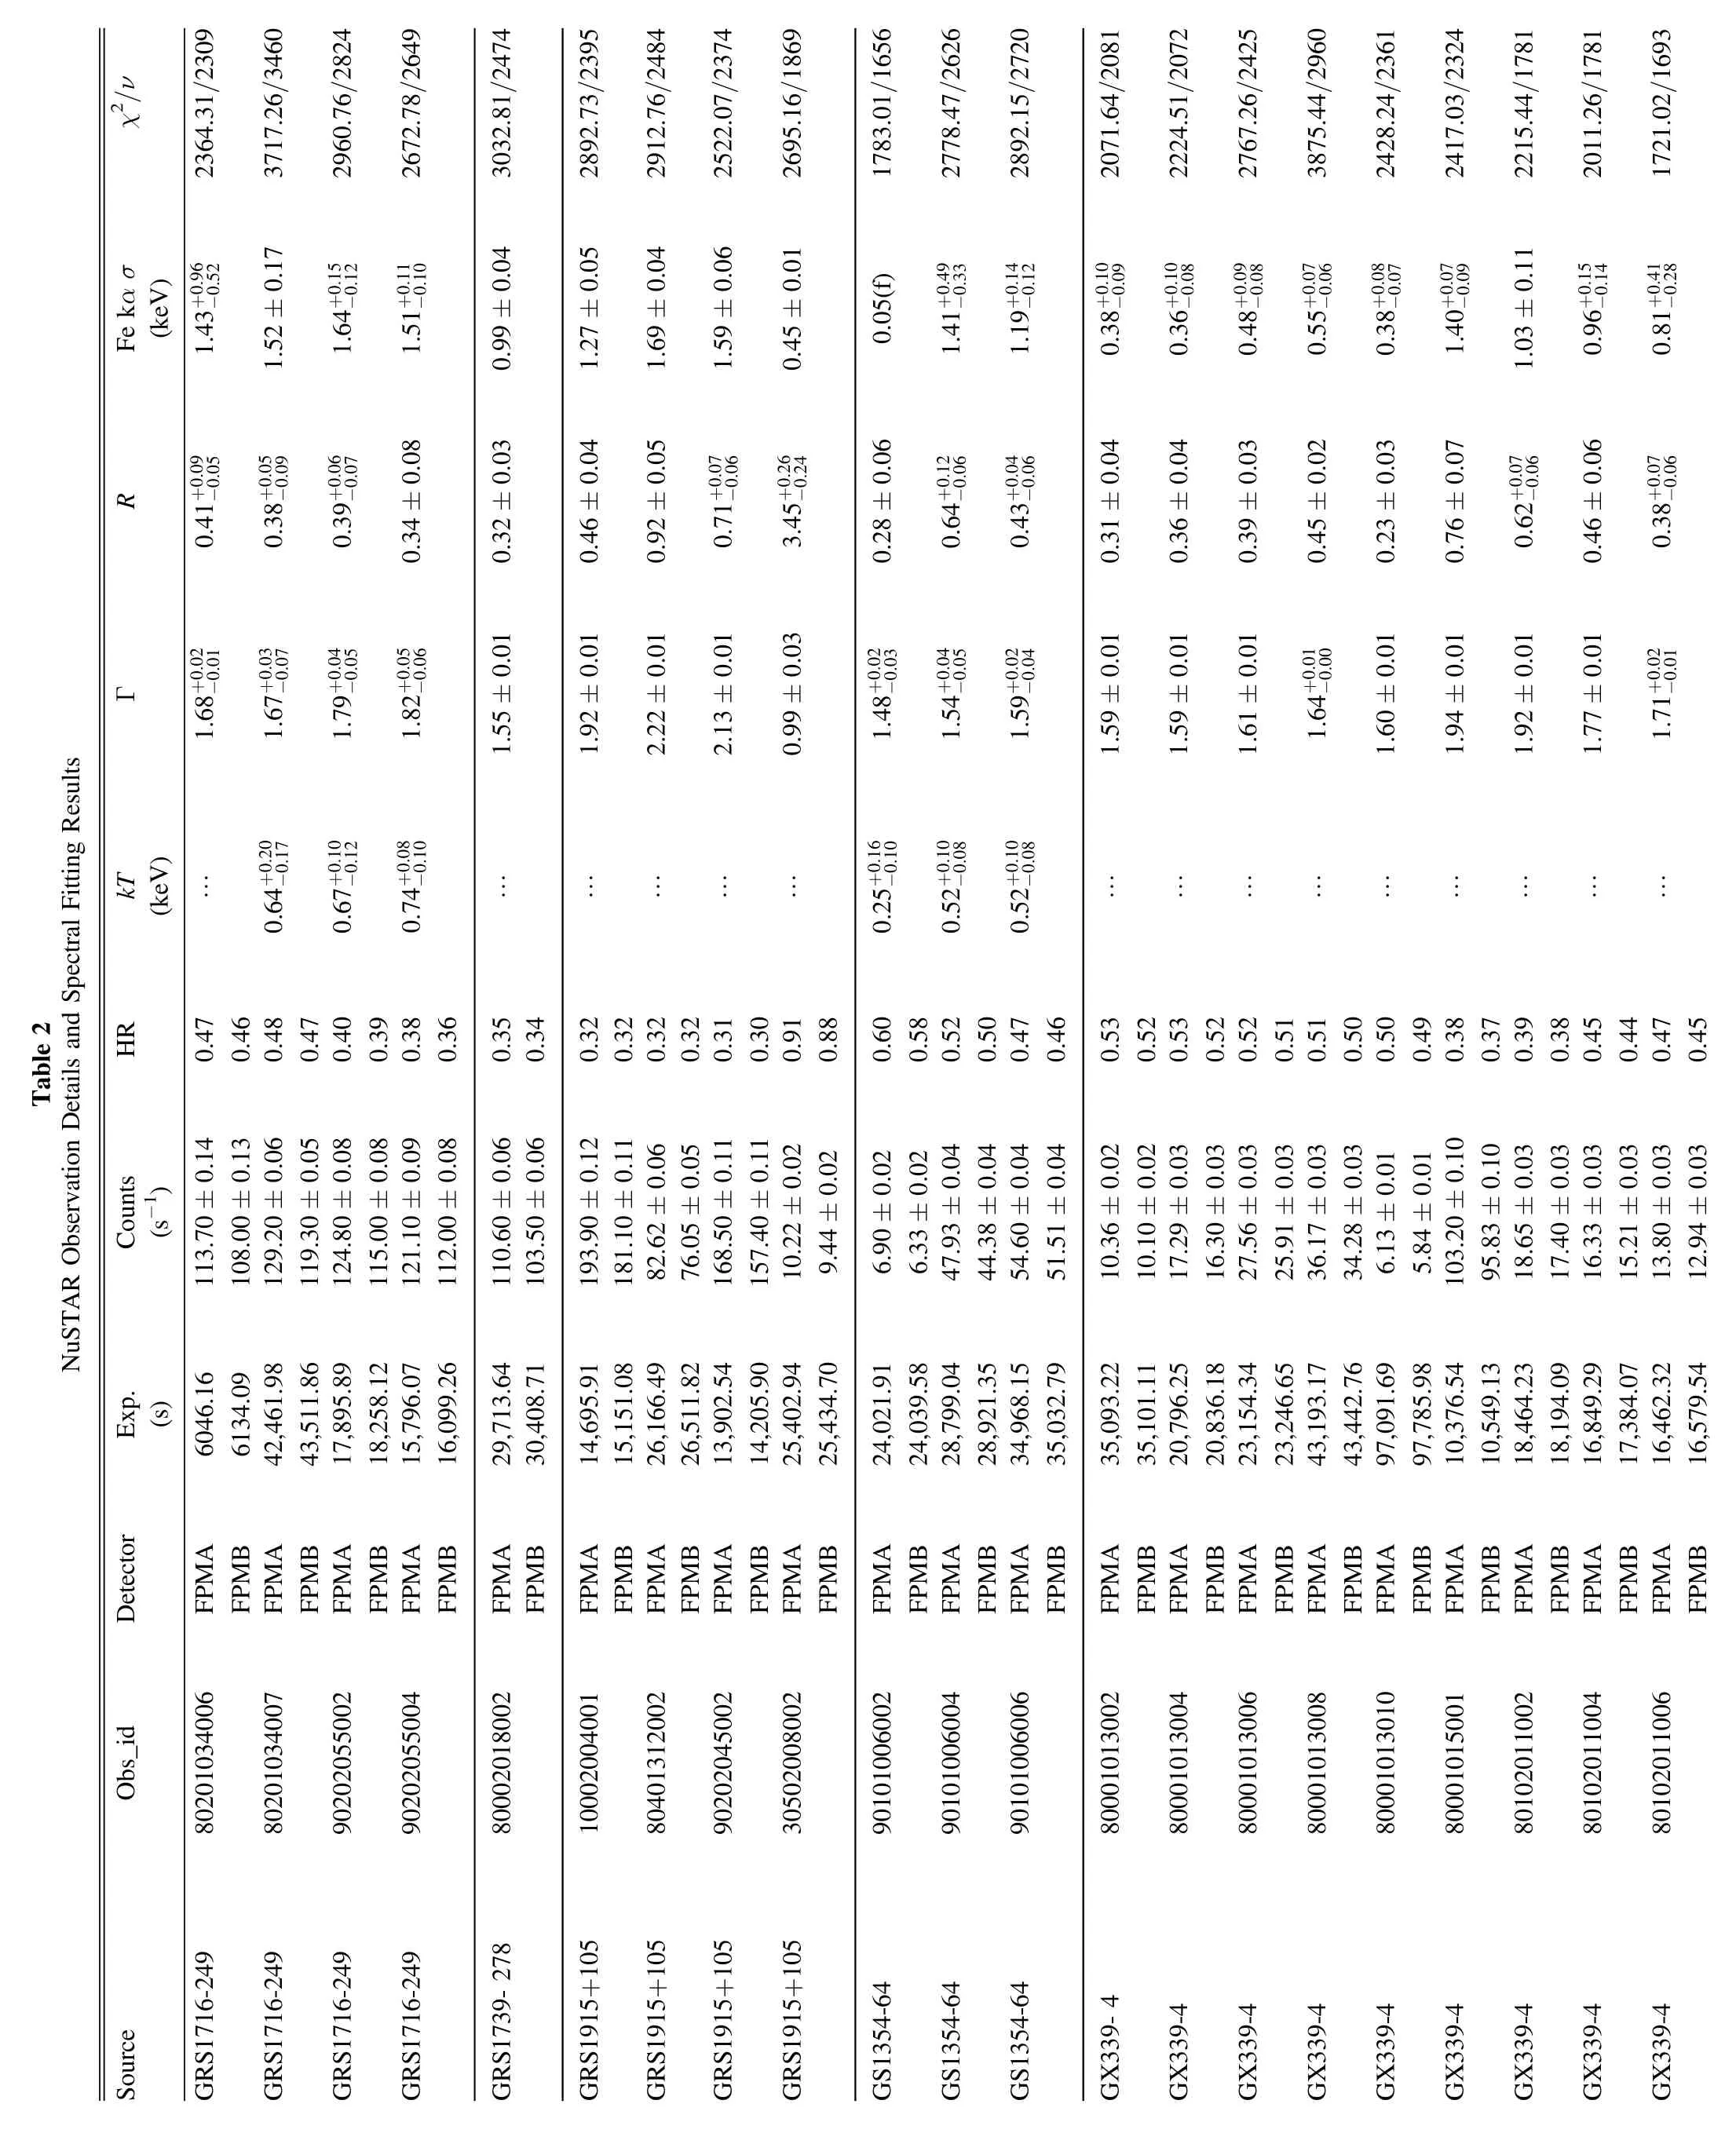
In order to achieve the goals of this work,we selected data as follows.(1)We excluded observations in which the spectra are dominated by the backgrounds (background subtracted photon counts below zero).(2)Here,we define the hardness ratio(HR)as the 10–78 keV count rate divided by the 3–10 keV count rate.To select observations that are in the hard state,we also excluded observations with HR<0.3.4See in Table 2,there may be some observations(the photon index is~2.22 in obs_id 80401312002 and~2.1 in obs_id 90202045002 for GRS 1915+105)are not in the hard state,but most of the observations (more than 97% with photon index <2.1) are most likely in the hard state (Remillard &McClintock 2006).(3) The observations in which a reflection component is not required in the X-ray spectral fitting are also excluded.(4) We further excluded observations that cannot be well fittedwith our model (constant×TBabs(diskbb+Gauss+pexrav) or constant×TBabs(Gauss+pexrav),see the detail in Section 3).The final sample consists of 69 observations in total.We present the details of the observations in Table 2.
In order to investigate the possible specific features appropriate for black holes of different scales,we will compare BHXRBs’ results with different types of AGNs’ in Section 4.AGN is classified as Seyfert1s (Seyfert 1–1.9) and Seyfert2s(Seyfert 2)based on the emergence of the broad emission lines in the optical spectrum,or the radio-quiet and radio-loud AGNs based on the ratio of the radio to optical luminosity.The Seyfert sample is from Hinkle&Mushotzky (2021),including 26 Seyfert1s and seven Seyfert2s,respectively.The radio-quiet AGN sample including 28 sources and the radio-loud AGN sample including 45 sources are from Kang et al.(2020) and Panagiotou &Walter (2019),respectively.We refer to these papers for detailed information on the observations of these AGNs.
3.Data Analysis
Spectral fitting is performed using XSPEC 12.11.1(Arnaud 1996) with χ2statistics.The errors are given with 90% confidence level.For each observation,the spectra of NuSTAR/FPMA and NuSTAR/FPMB in 3–78 keV are jointly fitted,accounting for a cross-normalization with a multiplicative constant.We use model TBabs to calculate the Galactic absorption.The Verner et al.(1996) photoelectric cross sections along with the Wilms et al.(2000) set of solar abundances are adopted.Because only fitting the energy band above 3 keV is not effective to well constrain the column densityNH,we fix theNHto the values in Table 1.
To model the primary X-ray emission and the reflection component,we use the model pexrav,which consists of a power-law with ane-folded and a reflection component(Magdziarz &Zdziarski 1995).In this model,we assume that the abundance of heavy elements,including Fe,of the reflecting medium is unity.For the inclination angleiof the disk,there are only five sources with constraints oni(60°±5°in GRS 1915+105 (Reid et al.2014),≤79° in GS 1354-64(Casares et al.2009),37°–78°in GX 339-4(Heida et al.2017),63°±3° in MAXI J1820+070 (Atri et al.2020),and ≥40° in Swift J1753.5-0127 (Neustroev et al.2014)) in the sample of BHXRBs studied in this work.Theicannot either be well constrained for the majority of sources.Therefore,for simplicity,the inclination angleiis fixed at the model’s default value,i.e.,cosi=0.45 (i≈63°).The photon index Γ,reflection parameterR,high energy cutEcut,and normalization are free parameters.We also include a Gaussian line with centroid energy fixed at 6.4 keV to model the Fe kα line.Even if the centroid energy is allowed to vary between 6.4 and 6.7 keV,the best-fitting results are not further improved.The width and the normalization of the line are free.However,the width of the line could not be constrained by the data when it is not significant enough to be detected,and then,it is fixed at 0.05 keV.A possible disk component (diskbb) will be included if it can significantly improve the fitting.We note that the popular reflection model,e.g.,relxill (Dauser et al.2014;García et al.2014),can self-consistently model the continuum reflection component and the Fe line (Dong et al.2020a,2020b;García et al.2022b).However,the pexrav model is used in this work so that we can directly compare our results with previous studies of NuSTAR AGN samples,in which the pexrav model is widely adopted (Panagiotou &Walter 2019;Kang et al.2020;Hinkle &Mushotzky 2021).
Deviations between FPMA and FPMB of NuSTAR data at the lowest energies in the observations for MAXI J1348-630(MJD 58515-58516,and MJD 58655-58672)and MAXI J1820+070 (MJD 58192-58397) are found.We let the temperaturekTand the normalization parameter of the diskbb untie between the two detectors for these observations.Note that the deviation at the low energy (E<~6.0 keV) between FPMA and FPMB in the observations of GX 339-4 on MJD 58060 is even worse.Therefore,for this observation,we fit the spectrum within 6.0–78.0 keV.The adopted model provides statistically accepted fits to our observationsWe list the temperature of the disk (kT),the photon index (Γ),the reflection parameter (R),and the width of the Gaussian line(Fe kα σ) of the best-fitting in Table 2.The spectra fits are insensitive to the Fe abundance,except for GX 339-4 and MAXI J1820+070.In order to check the effect of Fe abundance on GX 339-4 and MAXI J1820+070,we refit spectra of the two sources with Fe abundance allowed to be free.For GX 339-4,the value of the Fe abundance has a minor effect on the parametersRand Γ.Therefore,we only report the results with Fe abundance fixed at unity for GX 339-4.For MAXI J1820-070,a stronger negative correlation betweenRand Γ is shown when the Fe abundance is free,which is beyond the scope of this paper and will not be further discussed.
4.Results and Discussions
This work presents the first systematic study on NuSTAR X-ray spectra of BHXRBs to investigate theR-Γ correlation.In this sample,we only study the spectra obtained when the sources are in the hard state.The finally selected spectra consist of 69 observations in total.We modeled the continuum reflection component and the Fe line with pexrav and Gauss.The photon index Γ and reflection strengthRare well constrained.The values of Γ in most observations (more than 97%) are smaller than 2.1,which is consistent with the properties of hard state observation (Remillard &McClintock 2006).The Γ approximately equal to 2.2 and 2.1 in observations of GRS 1915+105 (Obs_id is 80401312002 and Obs_id is 90202045002,respectively),which may be associated with the model,will not affect the conclusion in this paper.For MAXI J1820+070,the Γ is in the narrow range of~1.6–1.8,while theRspans a wide range of~0.1–1.4.These two parameters in MAXI J1820+070 do not follow the positiveR-Γ correlation reported in previous works.We also note that the best-fitting parameter Γ is 0.9±0.03,andRisin the spectrum of GRS 1915+105 on MJD 58623 withWe consider these results as outliers of the regularR-Γ panel,which will not be further discussed in our work.For the remained observations,the values ofRobtained are roughly in the range of 0.1–1.0,and Γ ranges from~1.4 to~2.2.We present the points ofRand Γ in Figure 1.We test the correlation betweenRand Γ using the Spearman method.The Spearman’s coefficient is equal to 0.58 with apvalue of 1.13×10⁻⁵,which indicates a significant positiveR-Γ correlation.

Figure 1.The best-fitting parameters Γ and R.The gray lines are calculated based on the model of moving corona(Beloborodov 1999).μs represents the geometry of the corona,which corresponds to μs=0,0.1,0.2,0.3,0.4,and 0.5.
TheR-Γ correlation can provide important clues on the geometric and physical properties of the disk and the corona.Zdziarski et al.(1999) reported an extremely strong positive correlation betweenRand Γ in the sample of Seyfert galaxies,and the observations of their four X-ray binaries also satisfied this correlation.Zdziarski et al.(2003) further evaluated the reality of this correlation.In the work of Zdziarski et al.(1999),the obtained values ofRare smaller than 2 and the values of Γ are 1.4–2.2.The correlation is considered to provide evidence that the seed photons for the primary source come from the same medium that is responsible for the reflected emission.They found that the model with the inner radius movement failed to reproduce the data in the observed range of Γ andR,but only the data in the mid-range.On the other hand,the model proposed by Beloborodov (1999),in which the corona above the accretion disk moves toward or away from the black hole with relativistic bulk velocity,appears quantitatively to reproduce the correlation.This scenario is indeed consistent with the X-ray observations of an AGN sample,which provides evidence of the outflowing corona in AGNs (Liu et al.2014).Below,we calculate the correlation for a moving primary source using the equations of Beloborodov (1999).In their model,the reflection strengthRis computed as follows,
where β=ν/cis the velocity of the primary source,andμ=cosi(iis the inclination of disk).We assumed cosi=0.45 as fitting the data using pexrav.The spectral index Γ is calculated as follows,
where δ=1/6 and δ=1/10 are for BHXRBs and AGNs,respectively.Ais the amplification factor which can be estimated as follows,
whereγ=(1 -β2)-12.a(a≈0.1–0.2) is the reflection albedo,and μsis the coronal geometry.The parameterawill be assumed to be 0.15 when we calculate.The case μs=0 represents a slab geometry of the corona,while μs=0.5 means the corona roughly to be a blob with a radius of order its height.
We note that the geometry of the corona is still under debate.Here,we plot the expected curve for μs=0,0.1,0.2,0.3,0.4,and 0.5 as gray lines in Figure 1.It can be seen that all lines fail to reproduce the observed range of Γ andR.Most of our data points fall into the area between the two lines with μs=0 and μs=0.5 which may indicate that the geometry of the corona changes.The case that the coronal geometry evolves has been reported in previous studies.The work of Kara et al.(2019)found that the reverberation lags between the corona and the accretion disk in the BHXRB MAXI J1820+070 shorten while the profile of the broad Fe line remained remarkably constant and explained this case with a reduction in the spatial extent of the corona.In the microquasar GRS 1915–105,it is also found that the initially extended X-ray corona can become more compact and turned into the jet (Karpouzas et al.2021;García et al.2022a;Méndez et al.2022)with the evidence that(1)the phase lags of the type-C QPO made a transition from hard to soft,(2)the two separate correlations are presented between the iron-line flux and the total flux,(3)and the QPO frequency and the ratio flares evolved in a systematic way.Note that in the model proposed by Beloborodov (1999),R=1 is given for a static corona and independent of the coronal geometry.The ranges of β used to estimate the theoretical lines are larger than 0 for all assuming values of μs,indicating that the corona is moving away from the black hole.When the corona moves away from the black hole,the beaming effect reduces the photons irradiating the disk and subsequently the reflection emission.Moreover,the cooling effect on the corona temperature by seed photons reduces,and then a harder spectrum is presented.
In order to investigate the possible specific features appropriate for black holes of different scales,we compare BHXRBs’results with different types of AGNs’.In the work of Hinkle &Mushotzky (2021),they used XMM-Newton and NuSTAR data to analyze 33 AGNs,including 26 Seyfert1s and seven Seyfert2s.The authors presented the main fundamental parameters,such as the Γ,R,folding energy,black hole mass,and Eddington ratio for Seyfert AGNs,and looked for correlations between them.Seyfert2s tend to have lower Γ(harder spectra) than Seyfert1s,and the distributions ofRfor Seyfert1s and 2 s are consistent with each other.They recovered the positiveR-Γ correlation withp-value=2.6×10⁻³combining Seyfert1s and Seyfert2s.The work of Kang et al.(2020) measured Γ,R,folding energy,and Fe Kα EW for 28 radio-loud AGNs,and compared their results with 45 radio-quiet AGNs’ (Panagiotou &Walter 2019),in both of which NuSTAR observations were analyzed.They found that the radio-loud AGNs have harder spectra and weaker reflection emission compared with radio-quiet ones.Kang et al.(2020)reported a positiveR-Γ correlation with a very lowp-value(<10-4) combining radio-quiet and radio-loud,which contributed to the moving corona model.
We compare the best-fittingRand Γ for the hard state of BHXRBs and the sample of Seyferts,and for the hard state of BHXRBs and the sample of radio-loud and radio-quiet in Figures 2 and 3,respectively.In both figures,the distributions ofRand Γ are given in the lower right and upper left panels.The significant feature is that the reflection strength of BHXRBs’ hard state is smaller than 1,but it can increase largely to 5 in the AGN sample.When we see the distributions ofRand Γ in Figure 2,there are no significant differences for the three populations,while in Figure 3,the hard state of BHXRBs tends to have flatter spectra than radio-quiet and radio-loud AGNs,weaker reflection than radio-quiet AGNs,but the distribution ofRis consistent with radio-loud AGNs.To check for the robustness of the differences in the hard state of BHXRBs and radio-quiet/loud AGNs,we perform two nonparametric statistical tests,i.e.,Mann-Whitney U test(hereafter referred to as the U-test).The U-test for two independent samples can be calculated without the requirement of normal distribution.The null hypothesis is that there is no difference between any two compared data sets,and it is rejected when thep-value is below 0.05.We find that the distributions of Γ andRin BHXRBs are clearly different from that in radio-quiet AGNs,wherep-value is 3.1×10⁻⁷and 2.1×10⁻⁴,respectively.But BHXRBs and radio-loud AGNs have similar Γ andRdistributions withp-value being larger than 0.05 and 0.86,respectively.The relationships betweenRand Γ are shown in the lower left panels in Figures 2 and 3.Except for the theoretical lines predicted by Beloborodov (1999) model for BHXRBs,we also calculate the expected lines with μs=0 and μs=0.9 for AGNs.It can be seen that the areas between these two predicted lines mostly cover the observational points of AGN ignoring its classification.It is likely that the BHXRBs need a narrower area than AGNs to reproduce the data ofRand Γ,which may imply that the corona in BHXRBs changes less vigorously than that in the AGNs.
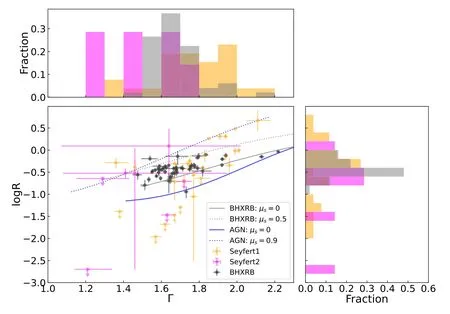
Figure 2.Distributions of photon index Γ and reflection strength R in the upper left and lower right panels,and R vs.Γ in the lower left panel.The results of Seyferts are from Hinkle &Mushotzky (2021).The orange,magenta,and black are for Seyfert1s,Seyfert2s,and BHXRBs,respectively.The gray solid and dotted lines correspond to μs=0 and μs=0.5 for BHXRBs,and the blue solid and dotted lines correspond to μs=0 and μs=0.9 for AGNs.
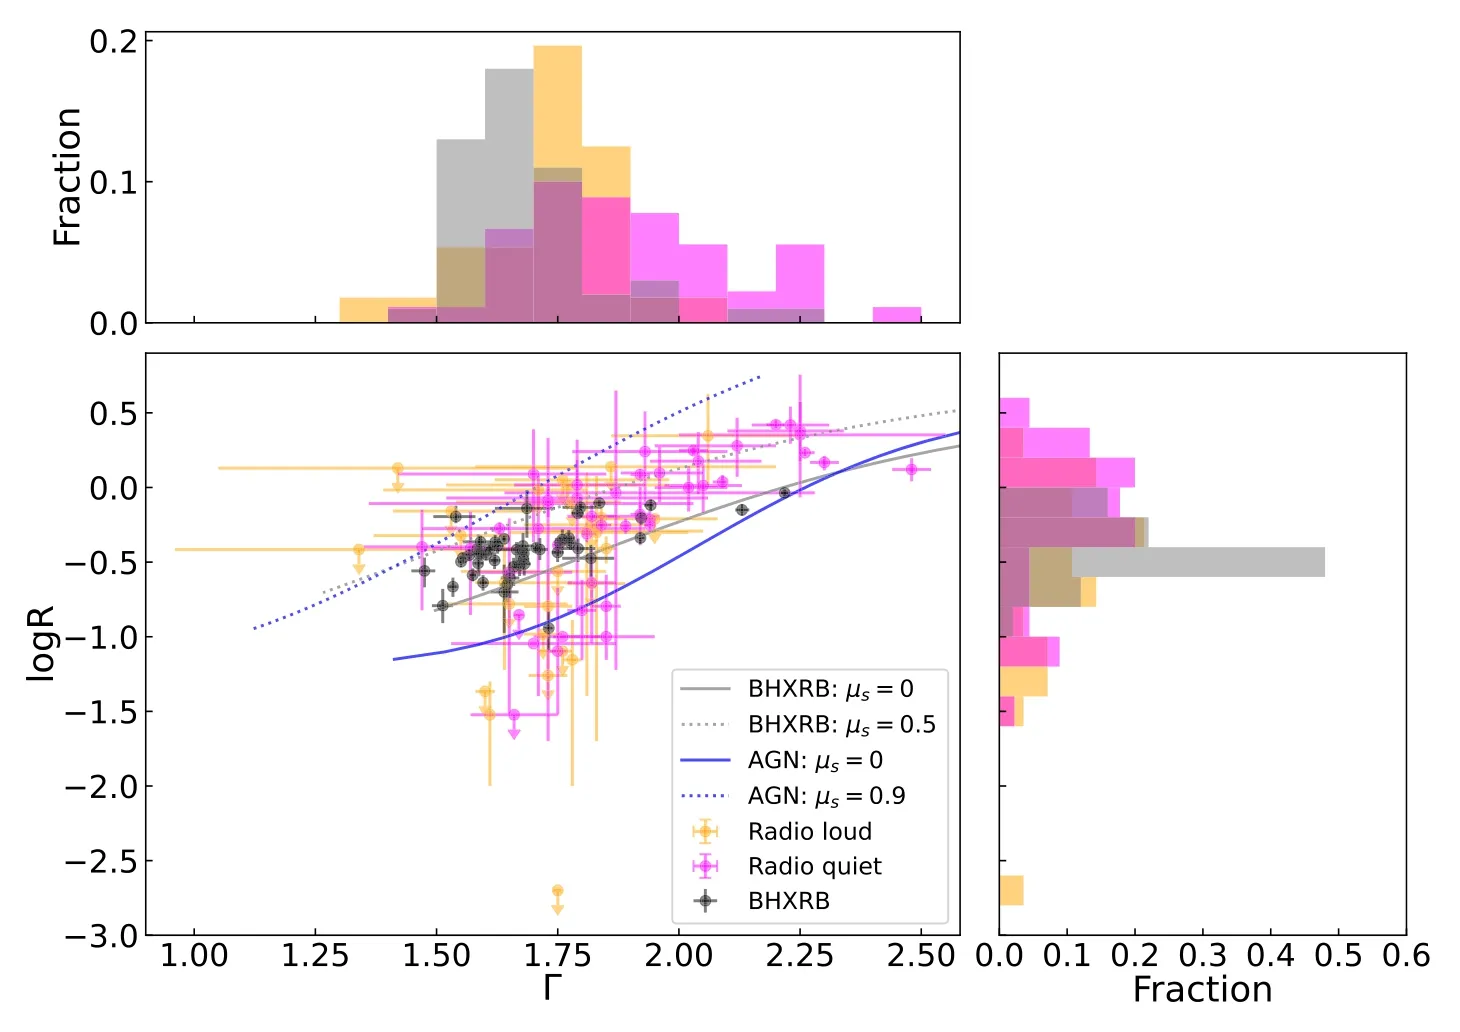
Figure 3.Distributions of photon index Γ and reflection strength R in the upper left and lower right panels,and R vs.Γ in the lower left panel.The results of radio-loud are from Kang et al.(2020),and radio-quiet are from Panagiotou &Walter (2019).The orange,magenta,and black are for radio-loud,radio-quiet,and BHXRBs,respectively.The gray solid and dotted lines correspond to μs=0 and μs=0.5 for BHXRBs,and the blue solid and dotted lines correspond to μs=0 and μs=0.9 for AGNs.
In the low/hard state of the BHXRBs,an advectiondominated accretion flow (ADAF) is present in the inner region near the BH (Narayan &Yi 1994),extending out to connect a thin disk at a truncated radius(Esin et al.1997).The truncated radiusRtrof the thin disk(i.e.,the ADAF radial size)increases with the decrease in the mass accretion rate (e.g.,Yuan &Narayan 2014).Thus,the reflection strengthRmay decrease with increasing truncated radiusRtr.As only the observations in the hard state of the BHXRBs have been included in our present investigation,while the AGN samples employed in this work include some luminous AGNs,which roughly correspond to the BHXRBs in the high/soft state.The inner edge of the thin disk in those luminous AGNs may extend to the inner stable circulating orbit (ISCO),and therefore their reflection strengthRis higher than that of the BHXRBs.It is also worth noting that the outer radius of a thin disk may vary from several thousand to ≿105Schwarzschild radii (You et al.2012;Cao 2016;Cao &Lai 2019;Cao &Zdziarski 2020),however,the affection of the outer disk radius to the reflection strengthRshould be much less important compared with that of the truncated radius of the thin disk.Thus,we think that it contributes little to the difference ofRbetween BHXRBs and AGNs.
5.Summary
We investigate the spectra of the hard state in black hole low-mass X-ray binaries using NuSTAR data.A positive correlation betweenRand Γ is tested by the Spearman method,with the Spearman’s coefficient equal to 0.54 and ap-value equal to 4.27×10⁻⁵,except for the source MAXI J1820+070.Rand Γ in MAXI J1820+070 seem to be the outlier in the regularR-Γ panel,which will be further explored in a future paper.TheR-Γ correlation presented here has been reported in GX339-4 and Cyg X-1,which is consistent with the previous report for AGNs.Our results support the moving corona model(Beloborodov 1999),in which the corona moves perpendicularly with respect to the black hole.To mostly cover the whole observational points,the geometry of the corona needs to be changed.When we compare the best-fittingRand Γ for the BHXRBs and the AGNs,we find that theRis smaller than 1 in BHXRBs while it can be as large as~5 in AGNs,which implies that the variations of the corona in AGNs are more vigorous than that of the BHXRBs in the hard state.We conjecture that the luminous AGNs with thin discs extending to the ISCOs may also be responsible for the systematically higherRin AGN samples.
Acknowledgments
We thank the referee for his/her helpful comments.We thank Dr.Bei You and Dr.Zhen Yan for very useful discussions.This work used data from the NuSTAR mission,a project led by the California Institute of Technology,managed by the Jet Propulsion Laboratory,and funded by the National Aeronautics and Space Administration.This work is supported by the National Natural Science Foundation of China (11833007,12073023,12233007,and 12147103),the science research grants from the China Manned Space Project with No.CMS-CSST-2021-A06,and the fundamental research fund for Chinese central universities (Zhejiang University).
杂志排行

Research in Astronomy and Astrophysics的其它文章
- In Search for Infall Gas in Molecular Clouds: A Catalogue of CO Blue-Profiles
- Pulsation Analysis of High-Amplitude δ Scuti Stars with TESS
- Cross-correlation Forecast of CSST Spectroscopic Galaxy and MeerKAT Neutral Hydrogen Intensity Mapping Surveys
- Mock X-Ray Observations of Hot Gas with L-Galaxies Semi-analytic Models of Galaxy Formation
- Fermi Blazars in the Zwicky Transient Facility Survey: A Correlation Study
- Spatially Resolved Properties of the GW170817 Host Galaxy