Observations of mode frequency increase and the appearance of ITB during the m/n = 1/1 kink mode in EAST high electron temperature long pulse operation
2023-03-06YanCHAO晁燕WeiZHANG张威LiqunHU胡立群KangningGENG耿康宁LiqingXU徐立清TaoZHANG张涛QingZANG臧庆andTianfuZHOU周天富
Yan CHAO (晁燕),Wei ZHANG (张威),Liqun HU (胡立群),Kangning GENG (耿康宁),Liqing XU (徐立清),*,Tao ZHANG (张涛),Qing ZANG (臧庆) and Tianfu ZHOU (周天富)
1 Institute of Plasma Physics,Hefei Institutes of Physical Science,Chinese Academy of Sciences,Hefei 230031,People’s Republic of China
2 University of Science and Technology of China,Hefei 230026,People’s Republic of China
3 Institute for Fusion Theory and Simulation,School of Physics,Zhejiang University,Hangzhou 310027,People’s Republic of China
Abstract A new long-pulse high electron temperature (Te) regime has been achieved on experimental advanced superconducting tokamak by pure radio frequency heating.In this new scenario,there are mainly two confinement states involving two magneto-hydrodynamic(MHD)modes,one of which is identified as m/n = 1/1 kink mode(where m and n are the poloidal and toroidal mode numbers,respectively).The frequency evolution of the kink mode is investigated through the three-dimensional,toroidal,and nonlinear Hall-MHD code CLT.We firstly find that the frequency of the m/n = 1/1 kink mode significantly increases during each sawtooth crash and then confirmed it through the experimental data.The simulation results indicate that the increase of the mode frequency is mainly due to the significant increase of the electron diamagnetic frequency nearby the reconnection region.We have also observed the internal transport barrier(ITB) during the m/n = 1/1 kink mode.To further investigate this m/n = 1/1 kink mode in this new regime,the multi-scale interactions between the m/n = 1/1 kink mode and turbulence are discussed.
Keywords: sawtooth,electron diamagnetic drift,ITB,multi-scale interaction
1.Introduction
The internal kink mode,characterized by poloidal and toroidal mode numbersm/n= l/l,is a common phenomenon in tokamak[1-3].It could be destabilized when the safety factorqon the magnetic axisq0drops below unity[1,4,5].Current theories generally believe that sawtooth crash is closely related to the internal kink mode[6-8].Sawtooth crashes can significantly reduce the central plasma pressure and even trigger other dangerous instabilities such as neo-classical tearing modes (NTMs) [5,9,10].However,some studies have revealed that small-amplitude sawtooth oscillations can help to prevent helium ash accumulation in the core and will not trigger NTMs.As a result,deliberately destabilizing the internal kink mode to achieve small-amplitude and frequent sawtooth crashes is chosen as one of ITER’s baseline scenarios [11].Furthermore,experiments on several devices have indicated that the fishbone activities [12-19]and long-live mode [15,20]are helpful for internal transport barrier (ITB) formation.It also has been found that multiscale interactions betweenm/n= 1/1 mode and micro-scale turbulence cannot only modulate turbulent transport [21-23]but may also trigger sawtooth crash [21,24].
In the EAST 2019 winter campaign,a new regime was achieved with characteristics of highTe,high ratio ofTe/Ti~ 10,long pulse,and low collision frequency [25].In this new regime,there are mainly two MHD modes observed,which appear individually or switch from one to the other in discharges.These two modes are identified as them/n= 1/1 kink mode and them/n= 3/2 tearing mode(TM).Compared with them/n= 3/2 TM dominated plasma,the plasma energy storage andTeare higher in the presence of them/n= 1/1 kink mode.The significant frequency increase of them/n= 1/1 kink mode is observed during sawtooth crashes.The three-dimensional,toroidal,and nonlinear Hall-MHD code CLT [26-28]is utilized to advance the understanding of the MHD behaviors in the highTeregime.Our simulation results are consistent with experimental observations and confirm that the increase of the mode frequency is mainly due to the nonlinear evolution of them/n= 1/1 kink mode.
In addition,ITB is observed in theTeprofile during the small amplitude sawtooth oscillations,which is possible to be the reason for the better confinement state than them/n= 3/2 TM phase.Previous study has indicated that them/n= 1/1 kink mode can modulate the turbulent transport in this new regime[25,29].However,the mechanisms of the interactions between them/n= 1/1 kink mode and turbulence were missing.Two possible mechanisms are analyzed and stressed in this work.
2.Experimental results
2.1.Experimental observation
Figure 1 shows the main parameters traces of discharge#90464.The traces ofIp,ne,and heating powers are shown in figures 1(a)-(d).The evolution ofH98[30],plasma stored energy,pβ(the poloidal ratio of plasma pressure to magnetic field pressure),and magnetic perturbation are shown in figures 1(e)-(h),respectively.As discussed in section 2.3,the one with smaller amplitude instability is them/n= 1/1 kink mode and the other is them/n= 3/2 TM,which correspond exactly to two confinement states.It is evident that the plasma energy storage andpβin the presence ofm/n= 1/1 kink mode are higher.We have also observed that the energy confinement becomes better when the dominated mode changes from them/n= 3/2 TM to them/n= 1/1 kink mode,and such a transition of the energy confinement is common in the new regime discharges.

Figure 1. Time traces of discharge #90464: (a) plasma current Ip ,(b) line-averaged electron density n e ,(c) 2.45 GHz (red) and 4.6 GHz(blue) LHW power,(d) ECRH power,(e) H98,(f) plasma stored energy,(g) β p,(h) magnetic perturbation.

Figure 2.(a)The spectrum of toroidal Mirnov signals,(b)the enlargement of the spectrum,(c)poloidal cross-phase of the m/n = 3/2 mode versus poloidal angle,(d) perturbation of SXR emissivity.
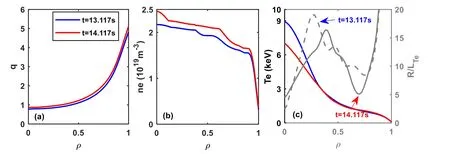
Figure 3.(a)q profiles,(b)plasma density profiles and(c)electron temperature and temperature gradient profiles measured by TS diagnostic of discharge #90464 at t = 13.117 s and t = 14.117 s.
2.2.Experimental setup and diagnostics used
The L-mode discharge presented in the paper is performed in upper single null divertor configuration with plasma currentIp≈ 0.5 MA in the counter-clockwise direction (top-view),toroidal magnetic fieldBt≈ 2.4 T in the clockwise direction,and plasma densityne≈2.25 × 10¹⁹m-3.Only low hybrid wave(LHW)[31,32]and electron cyclotron resonant heating(ECRH) [33-35]are utilized for plasma heating.The high time resolutionTeis measured by the multi-channel electron cyclotron emission(ECE)diagnostic[36],and the lower time resolutionTeprofile is measured by the Thomson scattering(TS) diagnostic [37].The electron densityneis detected by the density profile reflectometry (DPR) system [38]and the W-band multi-channel poloidal correlation reflectometry(PCR)system[39].The mode number is measured by Mirnov probes[40],and the 2D structure ofm/n= 1/1 kink mode is reconstructed by soft x-ray (SXR) [39]emission.
2.3.Identification of the modes
The evolutions of toroidal mode numbernand the mode frequencies are observed by the toroidal Mirnov probes(figure 2(a)).The frequency of then= 1 mode chirps from 10 to 5 kHz as figure 2(b) shows,and the frequency of then= 2 mode is much lower.Figure 2(d) shows the 2D distribution of the perturbed SXR emission att= 9.153 s,which indicates the distribution of the perturbed temperature.The structure ofm= 1 mode can be clearly seen in the perturbed temperature distribution.It is difficult to reconstruct the perturbed temperature distribution through SXR tomography whenm2.> As shown in figure 2(c),the poloidal mode number of then= 2 mode is calculated by poloidal Mirnov probes fromt= 13.85 s tot= 13.87 s,which indicates a clearm= 3 structure.
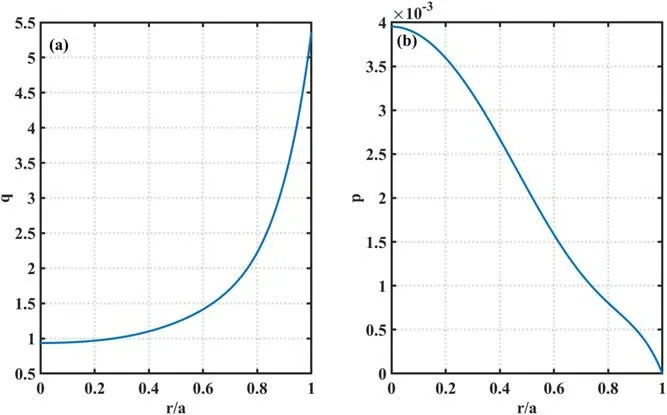
Figure 4.Safety factor and pressure profiles at t = 9.15 s of discharge #90464.The unit of pressure is /μ 0,where B00 is the magnetic field at the magnetic axis.
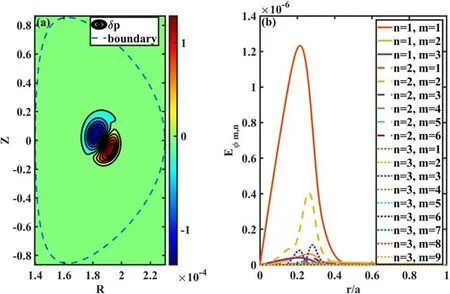
Figure 5.(a) Contour plot of the perturbed plasma pressure and (b)mode structures analysis at the linear stage of CLT’s simulation.

Figure 6.Evolutions of(a)the kinetic energy,(b)the growth rate,(c)the frequency of the m/n = 1/1 kink mode,and (d) the maximum plasma pressure from CLT’s simulation.

Figure 7.Poincaré plots of the magnetic field at (a)t = 5612.8t A just before the nonlinear stage,(b)t = 7394.7t A when the pressure crash occurs,and(c)t = 8909.2t Ajust after the pressure crash.Contour plots of the total plasma pressure at the same moments with the Poincaré plots of the magnetic field.The blue and red arrows indicate the rotation direction of the kink mode from CLT’s simulations and experimental observations,respectively.It should be noted that the mode rotation direction is counter to experimental observations.This is because the direction of the toroidal feild is set to be counter-clockwise in the simulations,which is different from experimental data.
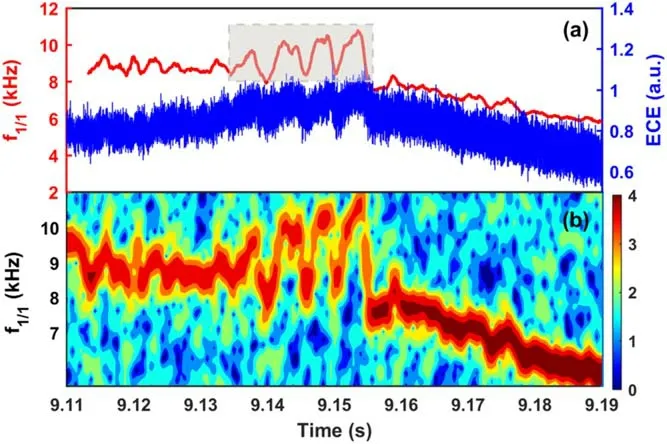
Figure 8. Evolutions of (a) the frequency of the m/n = 1/1 kink mode and core ECE signal,(b) the spectrum of SXR.
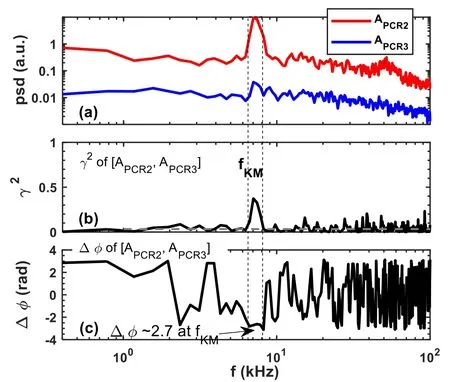
Figure 9.Analysis of the APCR2 and APCR3 of#90464 during t = [13 13.04]s: (a) auto power spectral density (PSD),(b) squared coherence and (c) the cross-phase spectra of APCR2 (LFS,ρ = 0.1)and APCR3 (HFS,ρ = -0 .25).
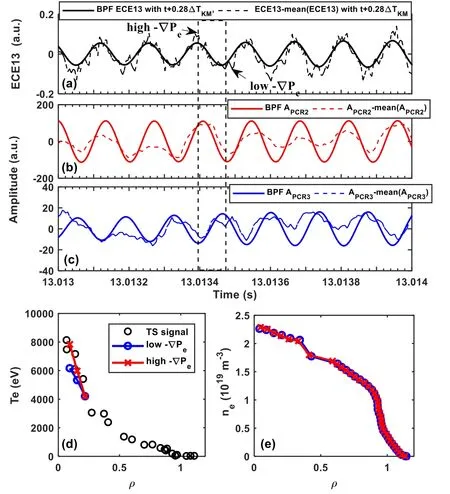
Figure 10.(a) Evolution of Te from ECE13 around ρ = 0.1,(b) and(c) evolutions of the fulctuation amplitude of PCR2 and PCR3,respectively,(d) the Te profile measured by ECE and TS,(e) the ne profile measured by density profile reflectometry (DPR).
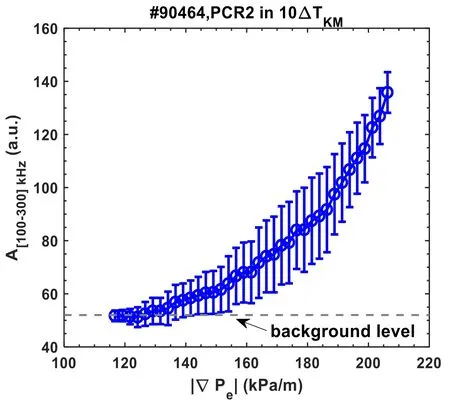
Figure 11.The high-frequency fluctuation amplitude APCR2 as a function of the local electron pressure gradient ∣ ∇Pe ∣.
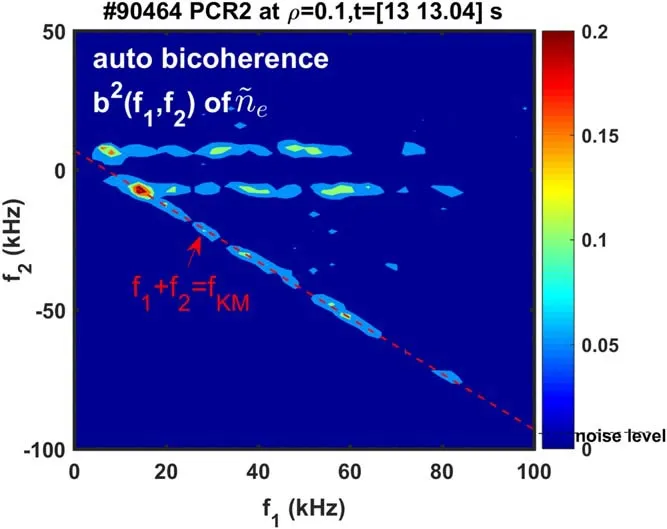
Figure 12.Auto bicoherence spectrum of density fluctuation of PCR2.
The normalized safety factorqprofiles,plasma density profiles,electron temperatureTeprofiles and temperature gradientR LTe/ profiles of discharge #90464 at aboutt= 13.117 s andt= 14.117 s are presented in figure 3.The ITB structure can be recognized in theTeprofile att= 13.117 s,whereas there is no ITB and the coreTebecomes lower att= 14.117 s.The appearance of ITB provides a possible explanation for the better plasma confinement duringm/n= 1/1 kink mode than them/n= 3/2 TM phase.
3.Simulation results
In this subsection,we numerically investigate the frequency evolution of them/n= 1/1 kink mode using three-dimensional,toroidal,and nonlinear Hall-MHD code CLT[41-44].In dimensionless units,the equations used in CLT are given as follows:
whereρ,v,p,pe,B,E,andJare the plasma density,the plasma velocity,the plasma pressure,electron pressure,the magnetic field,the electric field,and the current density,respectively,p0andJ0are the initial plasma pressure and current density,respectively.Γ is the ratio of specific heats and is chosen to be 5/3 in our simulations.η,D,κ⊥,κ∣∣,andνare the resistivity,the plasma diffusion coefficient,the perpendicular,and parallel thermal conductivity,and the plasma viscosity,respectively.The normalization of the variables can be found in[43].Since the resistive-kink mode,which our simulations focus on,is an internal mode,the boundary has little effect on it.All perturbed variables are fixed to be zero at the boundary for simplification.The detailed boundary conditions,numerical methods,GPU acceleration and systematically linear and nonlinear benchmarks with the M3D-C1 code could be found in [26,27].
Contour plots of the perturbed plasma pressure and mode structures analysis at the linear stage of CLT’s simulation are shown in figures 5(a) and (b),respectively,confirming that the dominated mode is them/n= 1/1 kink mode.They are consistent with the SXR tomography analysis shown in figure 2(b).The evolutions of the perturbed kinetic energy,the growth rate,the mode frequency,and the maximum plasma pressure are shown in figures 6(a)-(d),respectively.Similar to the experimental observations of discharge#90464,the system experiences sawtooth oscillations since the safety factor at the magnetic axis is smaller than 1.0.
The evolution of the frequency of them/n= 1/1 kink mode from CLT’s simulation is shown in figure 6(c).At the linear stage,the mode frequency from our simulations keepsωS= 12.2 kHz.As discussed in the[45],the mode rotation is due to electron diamagnetic drift,and the mode frequency of them/n= 1/1 kink mode is a fraction ofω*e=30.2 kHz.The linear mode frequency from experimental observation isωE= 8.8 kHz.The difference betweenωSandωEis about 37%,which is mainly due to the assumption of cold ions in the simulations and the errors from the diagnosis of pressure profiles.With finite ion temperature in experiment observations,the ion diamagnetic rotation also causes the mode rotates clockwise,which cancels part of the mode rotation caused by the electron diamagnetic effects.
Interestingly,the mode frequency significantly increases during each sawtooth crash,the frequency of them/n= 1/1 kink mode during the pressure crash can be several times larger than that at the linear stage,and the maximum mode frequency occurs at the same moments with the maximum kinetic energy.The increase of the mode frequency is due to the increase of the local electron diamagnetic frequency nearby the reconnection region of them/n= 1/1 resistivekink mode.Such a mechanism can be seen from the Poincaré plots of the magnetic field and the contour plots of total plasma pressure during the sawtooth crashes shown in figure 7.Firstly,the magnetic axis is driven to the reconnection region during the nonlinear development of the kink mode,and the hot core also moves towards the reconnection region due to the frozen-in condition.As a result,the local pressure gradient can be significantly increased (figure 7(e)).The mode frequency is greatly increased since it is proportional to the local electron diamagnetic frequency.These discussions are consistent with the results from [46],but the reconnection is complete both for the simulations and experimental observations in the present paper,while it is incomplete in [46].
The evolution of the mode frequency from experimental observations is shown in figure 8(b),which is calculated from the core SXR signal through the window fast Fourier transform (WFFT).As we can see,the mode frequency is aboutωE= 8.8 kHz before the pressure crash and increases toωE~ 11 kHz,which is qualitatively consistent with our simulations but quantitively different.WFFT should assume that a window contains enough periods,and the frequency should not change much in one window.However,as shown in figure 7,the local pressure gradient can significantly increase during a very short time (can be even shorter than one rotation cycle),and so as the electron diamagnetic frequency.Then one window of the Fourier transform is typically larger than the time scale of the frequency change.Thus,the WFFT method can only give accurate mode frequency before the crash and an increase in mode frequency during the crashes,but it cannot give the accurate mode frequency during the crashes.That is also why the frequency evolution oscillates during the pressure crashes in figure 8(b).In CLT’s simulations,we can calculate the phase of them/n= 1/1 mode at any time and then know the exact instantaneous frequency of them/n= 1/1 mode even during the pressure crashes.Although the mode frequencies from CLT’s simulations and experimental observations are quantitively different during the pressure crashes,the results agree well at the linear stage,and both confirm that the mode frequency has experienced significant increase during the pressure crashes.
It should also be noted that we find the increase of mode frequency from our simulations before detecting it in experimental data.We first find a significant increase of the mode frequency during each pressure crash in our simulations and then give a careful check of the mode frequency evolution in the experimental data.After that,we find that them/n= 1/1 kink mode’s frequency also increases during the pressure crashes.As discussed in the last paragraph,the frequency growth during the pressure crash is very likely to be ignored if one has not realized the bad accuracy of the WFFT during pressure crashes.This might be why such increase of mode frequency has not been reported before.
4.Interactions between m/n =11 kink mode and turbulence
4.1.Amplitude modulation
4.2.Nonlinear interaction
5.Summary
We have experimentally and numerically investigated the high electron temperature long pulse regime in EAST.Two energy confinement states corresponding to two MHD modes are found,one of which ism/n= 1/1 kink mode and the other ism/n= 3/2 TM confirmed by experimental data.Them/n= 1/1 kink mode rotates in the direction of electron diamagnetic drift,and its frequency is proportional to the local pressure gradient of the reconnection region.Through CLT’s simulations,we firstly find that the frequency of them/n= 1/1 kink mode significantly increases during each sawtooth crash.Then we carefully check the experimental data and confirm that the mode frequency is increased during pressure crashes.
The significant increase of the mode frequency is mainly due to the increase of the local electron diamagnetic frequency.During the nonlinear evolution of them/n= 1/1 kink mode,the magnetic axis moves towards the reconnection region and so as the hot core due to the frozen-in condition.As a result,the local pressure gradient and the electron diamagnetic frequency near the reconnection region become larger and larger during the nonlinear evolution of the resistive-kink mode.The maximum mode frequency can be several times larger than its initial values.
The interactions between the kink mode and the background turbulence were analyzed.On one hand,them/n= 1/1 kink mode can destabilize the local high-frequency fluctuations (100-300 kHz) with the increasing pressure gradient by compressing the local magnetic surface in both the LFS and HFS of the ITB region.The high-frequency fluctuations can be stimulated when the local pressure gradient reaches a threshold.Then its amplitude increases with the pressure gradient.On the other hand,the result of bispectral analysis indicates a direct nonlinear interaction between the fluctuations(<100 kHz)and them/n= 1/1 kink mode.Both mechanisms play a role in this steep central electron temperature gradient plasma.
Acknowledgments
The authors would like to acknowledge the help provided by EAST Team and Prof Z W Ma at Zhejiang University for his comments and suggestions.This work was supported by the National Magnetic Confinement Fusion Science Program of China (No.11505226),National Natural Science Foundation of China (Nos.11975273 and 12005185),the Fundamental Research Fund for Chinese Central Universities (No.2021FZZX003-03-02),the Science Foundation of Institute of Plasma Physics,Chinese Academy of Sciences(Nos.DSJJ-2021-03 and DSJJ-2021-08),and the National Key R&D Program of China (No.2019YFE03010002).
ORCID iDs
猜你喜欢
杂志排行

Plasma Science and Technology的其它文章
- Efficient combination and enhancement of high-power mid-infrared pulses in plasmas
- Realization of Te0>10 keV long pulse operation over 100 s on EAST
- Solving Poisson equation with slowingdown equilibrium distribution for global gyrokinetic simulation
- Experimental studies of cusp stabilization in Keda Mirror with AXisymmetricity (KMAX)
- BITS: an efficient transport solver based on a collocation method with B-spline basis
- Comparing simulated and experimental spectral line splitting in visible spectroscopy diagnostics in the HL-2A tokamak